Nordic Society Oikos
Implementing False Discovery Rate Control: Increasing Your Power Author(s): Koen J. F. Verhoeven, Katy L. Simonsen and Lauren M. McIntyre Source: Oikos, Vol. 108, No. 3 (Mar., 2005), pp. 643-647 Published by: Wiley on behalf of Nordic Society Oikos Stable URL: http://www.jstor.org/stable/3548810 Accessed: 02-06-2017 11:37 UTC REFERENCES Linked references are available on JSTOR for this article: http://www.jstor.org/stable/3548810?seq=1&cid=pdf-reference#references_tab_contents You may need to log in to JSTOR to access the linked references. JSTOR is a not-for-profit service that helps scholars, researchers, and students discover, use, and build upon a wide range of content in a trusted digital archive. We use information technology and tools to increase productivity and facilitate new forms of scholarship. For more information about JSTOR, please contact
[email protected].
Your use of the JSTOR archive indicates your acceptance of the Terms & Conditions of Use, available at http://about.jstor.org/terms
Nordic Society Oikos, Wiley are collaborating with JSTOR to digitize, preserve and extend access to Oikos
This content downloaded from 131.173.130.161 on Fri, 02 Jun 2017 11:37:41 UTC All use subject to http://about.jstor.org/terms
OIKOS 108: 643-647, 2005
Implementing false discovery rate control: increasing your power Koen J. F. Verhoeven, Katy L. Simonsen and Lauren M. McIntyre
Verhoeven, K. J. E, Simonsen, K. L. and McIntyre, L. M. 2005. Implementing false discovery rate control: increasing your power. - Oikos 108: 643-647.
Popular procedures to control the chance of making type I errors when multiple statistical tests are performed come at a high cost: a reduction in power. As the number of tests increases, power for an individual test may become unacceptably low. This is a consequence of minimizing the chance of making even a single type I error, which is the aim of, for instance, the Bonferroni and sequential Bonferroni procedures. An alternative approach, control of the false discovery rate (FDR), has recently been advocated for ecological studies. This approach aims at controlling the proportion of significant results that are in fact type I errors. Keeping the proportion of type I errors low among all significant results is a sensible, powerful, and easy-to-interpret way of addressing the multiple testing issue. To encourage practical use of the approach, in this note we illustrate how the proposed procedure works, we compare it to more traditional methods that control the familywise error rate, and we discuss some recent useful developments in FDR control.
K J F Verhoeven and L. M. McIntyre, Computational Genomics, Dept of Agronomy,
Purdue Univ., Lilly Hall of Life Sciences, 915 W. State Street, West Lafayette, IN 47907-
2054. USA (kverhoevengpurdue.edu). - K L. Simonson, Dept of Statistics, Purdue Univ., 150 N University Ave. West Lafayette, IN 47907-2068, USA.
Bonferroni procedure, which performs each of m tests at
The problem The appropriate threshold to declare a test statistic's
p value significant becomes complex when more than one test is performed. In the absence of a true effect each
a type I error rate of ac/m, is undesirable because of this
trade-off: only a very strong effect is likely to be recognized as significant when many tests are performed.
Several improvements to the classical Bonferroni have test has a chance of ot to yield a significant result, and thebeen proposed in order to reduce the problem of low
chance of drawing at least one false conclusion increases
rapidly with the number of tests performed. Protection
against false rejections of the null hypothesis, or type I errors, is usually achieved via a Bonferroni-type correction procedure (Holm 1979). By performing individual tests at error rates that are a fraction of the overall nominal a, the chance of making even a single type I
error can be maintained at the desired cx level (usually 5%). This is called control of the familywise error rate (FWER). With an increasing number of tests, maintaining a low chance of making even one type I error comes
at the direct cost of making more type II errors, i.e. not recognizing a true effect as significant. The classical
power (reviewed by Garcia 2004). For instance, the well known Holm's step-down or sequential Bonferroni procedure (Holm 1979, popularized among evolutionary biologists and ecologists by Rice 1989) performs tests in order of increasing p values, and conditional on having rejected tests with smaller p values an increasingly
permissive threshold can be used while maintaining the FWER at the desired level (5%). Further power gains are
possible with the sequential approach by using a step-up instead of a step-down procedure (that is, testing in
order of decreasing p values, Hochberg 1988), by estimating the number of true null hypotheses and correcting for those instead of all tests performed
Accepted 7 September 2004
Copyright ? OIKOS 2005 ISSN 0030-1299
OIKOS
108:3
(2005)
This content downloaded from 131.173.130.161 on Fri, 02 Jun 2017 11:37:41 UTC All use subject to http://about.jstor.org/terms
643
(Schweder and Spjotvoll 1982, Hochberg and Benjamini
ling FWER and FDR are equivalent. In that case either
1990), and by accounting for correlations within the
V/r=0 (by definition if V=0) or V/r= 1 (if V>0,
dataset which can reduce the effective number of
because all significant results are false), and the expected
independent tests performed (Cheverud 2001). Although
ratio equals the chance that any false rejection is made.
an improvement over the classical Bonferroni, all these
However, if some of the alternative hypotheses are true
procedures still focus on limiting the chance of making
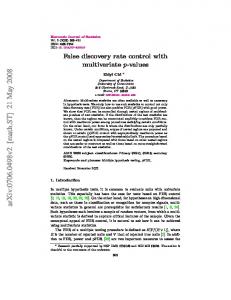
and S >0, then V/r is either 0 (if V =0) or 0 0. 10- l oa= 0.2 levels of 0.05, 0.1, and 0.2. Only the 25
QO
lowest
p
values
are
shown.
Closed
-- - -- - -- ~ symbols represent true alternative cases and open symbols represent true
005--~ 3 0.1 null cases. Lower panels show ----- - tabulated outcomes when applying - - - - - - - different type I error control
- i------------------------ procedures - -- - --- ---------------- - = 0.05 Hochberg FDR control, sharpened
0.00 , Benjamini and Hochberg FDR 0 5 10 15 20 25 control [see 'Beyond the Benjamini
Tests ranked by ascending p value and Hochberg FDR procedure'], classical Bonferroni FWER control,
Decision and Holm's sequential Bonferroni
NS S NS S NS S FWER control), at different levels, to
the simulated set of p values (Ho: t
FDR: Benjamini and Ho 35 0 34 1 32 3 null case; HI: true alternative case;
3og(195 10 5 10 2 13 NS: not significant; S: si
Hochberg (1995) H1 10 5 5 10 2 13 Type I and type II errors are shown in italics.
FDR: Sharpened Ho7 34 |71 L [ 132 | i3 LIIL29 I6iI Benjamini and 3 1 2 L 1%
Hochberg (2000) 55 H1I LJL 1L2 L L FWER: classical Ho H 7 37 l 7I77 0L|
Bonferroni HL 14 1j 12 j3 j11 3 4
FWER: Holm's Ho 35 L I0 | I35I I 0 L35 |0 sequential Bonferroni H,14 [j j 12j | 3 l j 10 | 5l 0.05
0.1
and show that power can be increased considerably.
0.2
p values are significant and which are not, it quantifies
Applied to our example of 50 tests described above, at
a rate of making type II errors. The FNR can be oc =0.05, this sharpening procedure resulted in eight type estimated based on an estimate of the proportion of true II errors and one type I error, compared to ten and zero null cases (mo/i in Table 1) combined with an expecta-
without sharpening (Fig. 2).
tion for the number of false discoveries (from an FDR
In the same example, similar sharpening of the FWER
controlling procedure; V/r in Table 1, Genovese and Wasserman 2002, Taylor et al. in press). Insight into the
controlling methods using the procedures described in
Hochberg and Benjamini (1990) did not result in fewer
FNR complements FDR control in a fundamental way,
type II errors. Brown and Russell (1997) use simulation
studies to compare the power of these sharpened FWER procedures with a number of other type I error control
methods, and provide software for applying the procedures to a list of p values.
since the motivation to switch from FWER to FDR control is to strike a more balanced compromise between type I and type II errors. Joint consideration of FDR
and FNR allows the total misclassification risk to be
estimated (type I plus type II errors; Genovese and Wasserman 2002). It can be used as an evaluation tool to
The false non discovery rate (FNR)
get a sense of the 'miss rate'. For instance, in simulation studies different FDR controlling procedures (or even
A natural companion to the FDR is the false non
different tests) can be compared in terms of their FNR.
discovery rate (FNR), or the expected proportion of non
In a genomics context where thousands of tests are
rejections that are incorrect (Genovese and Wasserman
performed, Taylor et al. (in press) propose to estimate
2002). This is the ratio T/m -r in Table 1. The FNR
the FNR over a range of null hypotheses that were close
plays a similar role in FDR control as power does in
to being rejected (for instance with p values between the
FWER control: given a procedure to decide which
cutoff value determined by the FDR procedure and 0.05).
646
OIKOS
108:3
(2005)
This content downloaded from 131.173.130.161 on Fri, 02 Jun 2017 11:37:41 UTC All use subject to http://about.jstor.org/terms
Measuring significance in the FDR context The Benjamini and Hochberg procedure sets the FDR at a desired level a, which defines a threshold to which individual p values are compared, and results in a list of rejected hypotheses of which a proportion a are expected
to be type I errors. The threshold in itself does not give insight into the degree of significance for individual tests. The p value is a measure of significance in terms of the false positive rate, and is useful in the FWER context to assess for each test the risk that the null hypothesis is
of many experiments. FDR control is more powerful and often is more relevant than controlling the FWER. It is also flexible, and ease of interpretation is not affected by changing the significance threshold. The threshold level can vary with, for instance, the number of tests and the nature of the study (e.g. exploratory or confirmatory), in a way that is less constrained than FWER control. Sensible biological interpretation of multiple testing results may therefore benefit more from FDR than FWER control.
falsely rejected. Storey (2002) proposes a corresponding
Acknowledgements - This material is based upon work supported by the National Science Foundation under Grant No. 9904704. Any opinions, findings, and conclusions or This value gives the expected proportion of significant recommendations expressed in this material are those of the results that are truly null cases (false discoveries) when author(s) and do not necessarily reflect the views of the National Science Foundation. the cutoff point for Ho rejection is at that test's p value.
significance measure for the FDR context, the q value.
The q value for a test is estimated by reversing the
Benjamini and Hochberg process: a rejection threshold
is set at a the test's p value and the associated FDR is estimated. Q values can be calculated for each test,
References
ranked in ascending order, and the FDR consequences
Benjamini, Y. and Hochberg, Y. 1995. Controlling the false
of choosing a cutoff point for Ho rejection are then
discovery rate - a practical and powerful approach to multiple testing. - J. R. Stat. Soc. B 57: 289-300. Benjamini, Y. and Hochberg, Y. 2000. On the adaptive control of the false discovery rate in multiple testing with independent statistics. - J. Educ. Behav. Statist. 25: 60-83. Benjamini, Y. and Yekutieli, D. 2001. The control of the false discovery rate in multiple testing under dependency. - Ann. Stat. 29: 1165-1188. Black, M. A. 2004. A note on the adaptive control of false discovery rates. - J. R. Stat. Soc. B Met. 66: 297-304. Brown, B. W. and Russell, K. 1997. Methods correcting for multiple testing: operating characteristics. - Stat. Med. 16: 2511-2528. Cheverud, J. M. 2001. A simple correction for multiple comparisons in interval mapping genome scans. - Heredity 87: 52-58. Garcia, L. V. 2003. Controlling the false discovery rate in ecological research. - Trends Ecol. Evol. 18: 553-554. Garcia, L. V. 2004. Escaping the Bonferroni iron claw in ecological studies. - Oikos 105: 657-663. Genovese, C. and Wasserman, L. 2002. Operating characteristics and extensions of the false discovery rate procedure. - J. R. Stat. Soc. B 64: 499-517. Hochberg, Y. 1988. A sharper Bonferroni procedure for multiple tests of significance. - Biometrika 75: 800-802. Hochberg, Y. and Benjamini, Y 1990. More powerful procedures for multiple significance testing. - Stat. Med. 9: 811-818. Holm, S. 1979. A simple sequentially rejective multiple test procedure. - Scand. J. Stat. 6: 65-70. Moran, M. D. 2003. Arguments for rejecting the sequential Bonferroni in ecological studies. - Oikos 100: 403-405. Rice, W R. 1989. Analyzing tables of statistical tests. - Evolution 43: 223-225. Schweder, T. and Spjotvoll, E. 1982. Plots of P-values to evaluate many tests simultaneously. - Biometrika 69: 493-502. Storey, J. D. 2002. A direct approach to false discovery rates. - J. R. Stat. Soc. B 64: 479-498. Storey, J. D. and Tibshirani, R. 2003. Statistical significance for genomewide studies. - Proc. Natl Acad. Sci. USA. 100: 9440-9445. Taylor, J., Tibshirani, R. and Efron, B. in press. The 'miss rate' for the analysis of gene expression data.-Biostatistics.
apparent. Storey and Tibshirani (2003) provide software for transferring a list of p values to q values. Their FDR
procedure exploits estimation of the proportion of true null hypotheses among all tests, and is more powerful
than the 1995 Benjamini and Hochberg procedure and equally powerful to the sharpened 2000 Benjamini and Hochberg procedure (Black 2004).
Conclusion When many tests are performed, keeping the proportion
of false discoveries relative to all significant results at a low level is a powerful alternative to the traditional
approach of avoiding even a single false discovery.
Control of the FWER at A, via (sequential) Bonferroni procedures, is a suitable approach only if the penalty of making even one type I error is severe. In many studies avoiding any type I error irrespective of its cost in terms of type II errors is not a satisfactory approach. FDR control provides a sensible solution: it offers an easily interpretable mechanism to control type I errors while
simultaneously allowing type II errors to be reduced. Control of the false discovery rate is being widely
adopted in genomic research. Here, genomewide scans necessitate the interpretation of hundreds or thousands of simultaneous tests, and minimizing the chance of making even a single type I error can keep the vast
majority of true effects from being detected. FDR control can address a much wider range of multiple testing problems in evolution and ecology as well (Garcia 2003, 2004), where the loss of power inherent to strict FWER control does not do justice to the nature
OIKOS
108:3
(2005)
This content downloaded from 131.173.130.161 on Fri, 02 Jun 2017 11:37:41 UTC All use subject to http://about.jstor.org/terms
647