The NVM is calculated on a 0.2 x 0.2 degree grid between longitude E 165° to E 180° and latitude S 48° to ... Plot of the 11 resurveyed campaign stations in the.
Implementing Localised Deformation Models into a Semi-Dynamic Datum A. Jordan1, P. Denys2, G. Blick1 1. Land Information New Zealand, Private Box 5501, Wellington, New Zealand 2. School of Surveying, University of Otago, Box 56, Dunedin, New Zealand Abstract. The New Zealand Geodetic Datum 2000 (NZGD2000) has an associated deformation model that allows horizontal coordinates to be reduced to a reference epoch of 2000.0 and is therefore a semidynamic datum. Currently, the deformation model does not account for either discrete or continuous horizontal deformation that can be associated with localised events such as earthquakes and landslides. Such events will distort the geodetic network by as little as a few millimetres a year, or as much as several metres in a matter of seconds. Using the August 2003 M 7.2 Fiordland earthquake as a case study, we demonstrate the implementation of a Localised Deformation Model (LDM) into the NZ National deformation model. LDMs employ triangulated interpolation techniques that predict surface displacement. In the Fiordland earthquake, eleven existing monitoring sites were resurveyed immediately following the earthquake and movements of up to 17 cm were observed. To model the associated coseismic deformation, a LDM was generated from surface displacements predicted by a dislocation model of the earthquake. The LDM covered an area of approximately 56,000 km2. The implementation of a LDM into the NZGD2000 deformation model was successfully demonstrated. Keywords. Geodetic Datum, earthquakes, deformation model, deformation, New Zealand
1. Introduction New Zealand is prone to land deformation due to the steady motion between the Australian and Pacific tectonic plates as well as the episodic release of accumulated energy on the plate interface, known as earthquakes. The current geodetic datum for New Zealand is the New Zealand Geodetic Datum 2000 (NZGD2000). NZGD2000 was released on 25 August 1999 (Pearse 2000) replacing New Zealand Geodetic Datum 1949 (NZGD1949) as New
Zealand’s primary reference datum. NZGD1949 was a static datum and as a result, distortions in the geodetic network of up to 5 m had been measured due to tectonic motion, earthquakes and survey errors (Bevin and Hall 1995). NZGD2000 was realised as a semi-dynamic datum with a geocentric origin that is aligned with the International Terrestrial Reference Frame 1996 (ITRF96) at a reference epoch of 2000.0 and adopts the Geodetic Reference System 1980 (GRS80) ellipsoid. NZGD2000 is considered a semi-dynamic datum because it has an associated national horizontal deformation model that is used to account for tectonic motion. The National Deformation Model (NDM) associated with NZGD2000 accounts for the horizontal deformation resulting from the steady motion between the Australian and Pacific tectonic plates. Ideally, the datum and NDM would meet two requirements; (1) model national and localised deformation to a sufficient degree to allow old and new observations to be used together; and (2) supply coordinates that are “in terms” with the current positions of marks in the ground. However, the current NDM does not account for the horizontal deformation associated with localised events such as earthquakes and landslides. A significant event will create distortions in the geodetic network that will downgrade its integrity and accuracy in the affected area. Currently, there are no strategies or procedures in place to update the geodetic network after such events. This research addresses this problem through an approach that involves the use of Localised Deformation Models (LDM) that can be integrated into the NDM to account for horizontal movement associated with localised deformation events. Through modelling areas of significant land deformation, NZGD2000 can be updated to maintain and realign the geodetic network in order to retain/regain the integrity of the network by reflecting the true positions of geodetic stations on the Earth’s surface.
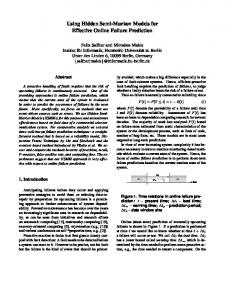
2. The National Velocity Model and the NDM The terms “National Deformation Model” (NDM) and “National Velocity Model” (NVM) in existing documentation have been readily interchangeable. However, when giving reference to the NVM model in association with NZGD2000, LINZ (2003a) clarified that the term NVM is not strictly correct. LINZ (2003a) states that the principal purpose of the model is to predict position, not to predict velocity, and that it is better termed a deformation model. For the purposes of this paper, however, both terms will be used, with each representing separate models. NVM will be the term used to represent the velocity model developed by the Institute of Geological and Nuclear Sciences (GNS) for Land Information New Zealand (LINZ), GNS NVM version 2.1 (see Beavan and Haines 2001). The term NDM will represent a model consisting of a number of deformation models, including the NVM. This distinction is covered further in Section 4. The NVM is currently the only deformation model included in the NDM. The NVM is represented as a complex curvilinear grid (Figure 1). To reduce the complexity and increase the efficiency of its evaluation at any given point, the NVM is implemented as a regular grid. The NVM is calculated on a 0.2 x 0.2 degree grid between longitude E 165° to E 180° and latitude S 48° to S 32° (Crook 2003). The velocity of a given point is evaluated by interpolation of the velocities at the four points that form the cell in which the point lies. From herein, the term NVM will represent this grid.
3. Dealing with Localised Deformation in the NDM It is possible that during an earthquake marks could move metres relative to one another. Due to such deformation the ‘authoritative’ coordinates of the affected marks will not reflect the true location in the ground. The deformation model that is currently associated with NZGD2000 cannot replicate or account for earthquakes, major landslides, or other localised deformation events. This is because the NVM predicts a constant velocity for any given point and is spatially coarse (LINZ 2003a). Therefore, after deformation events, the two requirements of the datum and NDM, stated early, are no longer met. LINZ (2003a) discusses and recommends the options for updating the NDM to account for
localised deformation. It was recommended to define a separate grid (regular or irregular) to represent a LDM that is applied as a ‘patch’ on the NVM. Therefore, the NDM would include the NVM and potentially one (or more) LDMs. A LDM is defined over both spatial and temporal extents for which the localised deformation event exists.
Figure 1. National Velocity Model (GNS NVM version 2.1).
At a minimum, a LDM needs to be of sufficient accuracy to maintain relative cadastral accuracy standards in New Zealand. The relative horizontal accuracy standard for cadastral traverse marks (Sixth Order) is 0.02 m + 100 ppm (LINZ 2003b). If these standards can be met, then cadastral surveys can still be carried out.
4. National Deformation Model – The Concept A NDM is made up of one or more layers of deformation models (Figure 2) and it makes no distinction between a NVM and a LDM; these terms describe what is being modelled and how it is represented. Each layer (deformation model) is represented by a ‘sequence’ of one or more deformation ‘components’. Figure 3 illustrates the structure of the NDM and the relationship between deformation-sequences and deformationcomponents. Essentially, by allowing a deformation event to be represented as a sequence of deformation-components, variations in the deformation through time can be easily managed.
For example, the earthquake cycle predicts further deformation after the main earthquake, i.e. postseismic deformation. Therefore, a LDM for an earthquake might include a model of an initial displacement (co-seismic deformation), with models of the post-seismic deformation added periodically after the earthquake. In this case, the deformation-sequence would consist of a deformation-component representing the co-seismic deformation, plus one or more components representing post-seismic deformation.
represented by a triangulated grid (LINZ 2003a) (Figure 4 (a)).
(a) NVM
(b)
Figure 4. (a) An illustration of a triangulated grid (irregular), with triangles and nodes explicitly defined. (b) An illustration of a rectangular grid (regular), with grid and nodes explicitly defined.
North LDM
East Figure 2. An illustration of how the NDM is made of layers with the NVM being the base layer, supplemented by a number of LDM layers. NDM SEQ 1 (NVM)
COMP 1 (GNS NVM v2.1)
SEQ 2 (LDM)
COMP 1 (Co-seismic def)
5. Case Study - August 2003 Fiordland Earthquake Fiordland is situated in the south-west corner of the South Island of New Zealand. On the night of 21/22 August 2003 a magnitude 7.2 (M 7.2) earthquake hit the area. The earthquake was located near Secretary Island. The fault surface is an area about 35 km long by 20 km wide, and is located on the dipping interface between the subducting Australian plate and the over-riding Pacific plate at a depth of about 13 km (Beavan and Wallace 2004; Reyners et al. 2003).
COMP 2 (Post-seismic def)
SEQ 3 (LDM)
COMP 1 (Co-seismic def) COMP 2 (Post-seismic def)
Figure 3. An illustration of how the NDM consists of one or more deformation-sequences, which in turn consist of one or more deformation-components.
The NVM is represented on a rectangular (regular) grid (Figure 4 (b)). However, due to the complexity of the deformation associated with local deformation events an LDM would need to be
Figure 5. Plot of the 11 resurveyed campaign stations in the Fiordland area. The star indicates the location of the earthquake below the surface. The solid black line indicates the location of the ruptured fault projected to the surface.
Although there was little LINZ geodetic control in the area, a deformation network had been established in 2001 by Otago University (OU) and GNS for scientific purposes (Beavan and Wallace 2004). In the week following the earthquake, GNS re-observed parts of this network and calculated coseismic displacements. This included 11 stations within the earthquake’s deformation zone (Figure 5).
σ ΔEΔN ⎤ ⎥ σ Δ2N ⎦ 2003
⎡σ2 +⎢ E ⎣σ EN
⎡ σ Δ2E σ EN ⎤ + ⎥ ⎢ σ N2 ⎦ 2003 ⎣σ ΔEΔN
X
Step 2: Calculate the difference between the projected August 2003 coordinates and the observed August 2003 coordinates. X
X
⎡ΔE ⎤ ⎡E ⎤ ⎡E ⎤ =⎢ ⎥ −⎢ ⎥ ⎢ΔN ⎥ N ⎣ ⎦ 2003 ⎣ ⎦ 2003 ⎣ N ⎦ 2003′
X − OUSD
X
OUSD
Equation 3. ⎡ΔE ⎤ ⎡ΔE ⎤ =⎢ ⎥ −⎢ ⎥ N N Δ Δ ⎣ ⎦ 2003 ⎣ ⎦ 2003
Summarised: Substitute Equations 1 and 2 into Equation 3. X − OUSD
⎡ΔE ⎤ ⎢ΔN ⎥ ⎣ ⎦ 2003
OUSD
σ ΔEΔN ⎤ ⎥ σ Δ2N ⎦ 2003
Ordinate
Projected using NVM
X X ⎛ ⎡E ⎤ X ⎞ ⎡VE ⎤ ⎡E ⎤ ( t − t0 )⎟ +⎢ ⎥ =⎢ ⎥ − ⎜⎢ ⎥ ⎟ ⎣ N ⎦ 2003 ⎝⎜ ⎣ N ⎦ 2001 ⎣VN ⎦ NVM ⎠ OUSD
⎡ΔE ⎤ −⎢ ⎥ ⎣ΔN ⎦ 2003
Jan 2000 Feb 2001
Aug 2003
Figure 6. An illustration of projecting the February 2001 coordinates to immediately before the August 2003 earthquake. The solid line represents the motion described by the NVM. The dashed line represents the true motion. The projected ordinate is represented by the light cross.
Equation 2.
Step 3: Calculate the station displacement relative to a stable reference station (OUSD). ⎡ΔE ⎤ ⎢ΔN ⎥ ⎣ ⎦ 2003
X
X
σ EN ⎤ ⎥ σ N2 ⎦ 2001
X
X
⎡VE ⎤ ⎡E ⎤ ⎡E ⎤ (t − t0 ) Equation 1. =⎢ ⎥ +⎢ ⎥ ⎢N ⎥ ⎣ ⎦ 2003′ ⎣ N ⎦ 2001 ⎣VN ⎦ NVM
X
⎡σ2 =⎢ E ⎣σ EN
Equation 5.
5.1. Methods There are three steps in the process used to calculate station displacements in this case study: Step 1: Project February 2001 coordinates to immediately before the earthquake at epoch 2003.638 (2003′) (see Figure 6).
X − OUSD
⎡ σ Δ2E ⎢ ⎣σ ΔEΔN
Equation 4.
The variance-covariance values associated with the displacement calculated at each station were calculated using Equation 5. Note that the error associated with the NVM is assumed zero for this study. This is the current assumption made when LINZ generates NZGD2000 coordinates. However, Beavan and Blick (2005) demonstrate that this is not a correct assumption. Future studies should apply an appropriate error weighting to the NVM values.
5.2. Displacements The data processing results are tabulated in Table 1 and shown in Figure 7. The largest movement was calculated at DF4Q as -0.162 m and 0.076 m east and north respectively. The smallest movement was calculated at B047 as -0.015 m and 0.009 m east and north respectively. The results show that stations DF4Q, DF4R and DF4U have the greatest movement in the WNW direction. They also show that while most stations move in a WNW direction, the three most south western stations (A0DW, B047, and DF4L) move in a SW direction. Significant vertical movement was also observed, with a maximum of 13 cm of subsidence at DF4Q. However, only the horizontal movement is of interest in this study. The displacements calculated here agreed well with those calculated by Beavan and Wallace (2004). Using their displacements, they generated a dislocation model for the earthquake (GNS Model 205). From the dislocation model, a grid of 14,000 surface displacement nodes at 2km spacing (280 km (east-west) and 200 km (north-south)) was generated.
Table 1. Tabulated differences in meters shown in Figure 7. Site dE dN σdE σdN 1002 1004 A0DW A1TH B047 DF4K DF4L DF4M DF4Q DF4R DF4U
-0.084 -0.048 -0.008 -0.058 -0.015 -0.043 -0.027 -0.083 -0.162 -0.148 -0.130
0.025 0.027 -0.063 0.005 -0.009 0.048 -0.042 -0.006 0.076 0.034 0.089
0.004 0.001 0.003 0.003 0.003 0.003 0.003 0.004 0.004 0.004 0.003
0.003 0.002 0.003 0.003 0.003 0.003 0.003 0.003 0.003 0.003 0.003
5.3. Localised Deformation Model An optimised triangulated grid (irregular) was generated from the 14,000 displacement nodes (Figure 8). The grid covers a 56,000 km2 area, and the perimeter nodes have zero deformation. This grid forms the LDM for the Fiordland earthquake. Evaluating this grid using linear interpolation, illustrates the surface deformation as a result of the earthquake, as predicted by the dislocation model (Figure 9).
Figure 9. Contour and directional plot of the Fiordland LDM. The solid black line indicates the position of the fault projected to the surface. Contours are spaced at 0.01 m intervals. The scale bar indicates the amount of deformation represented by each grey tone.
Figure 7. Fiordland station displacements relative to OUSD. The 95% error ellipses for calculated displacements are shown.
Figure 10. Comparison of calculated and modelled surface displacements relative to OUSD.
Figure 8. Optimised triangulated grid derived from GNS model 205.
Comparing the displacement as evaluated by the LDM with that calculated at the 11 stations listed in Table 1 and shown in Figure 10, results in RMS values of 8mm and 12mm east and north respectively. This is within the constant 2cm
portion of the 6th order accuracy standard previously stated and is therefore considered as an accurate representation of the observed displacement. However, it does not necessarily represent the accuracy of the model between stations. 5.4. A new National Deformation Model A new NDM was compiled using the NVM and the Fiordland earthquake LDM. When the NDM is evaluated for epochs after 22nd August 2003, the displacements as predicted by the LDM will be applied to all affected coordinates, as well as the NVM predictions. Figure 11 illustrates the evolution of surface movement.
months after the earthquake, however the deformation was considered too minor to materially impact on the datum. If any post-seismic deformation is detected in future surveys, an updated LDM could be produced. This paper has demonstrated a method for producing an LDM for an earthquake scenario, where the displacements are applied instantaneously at a specified epoch. However, this may not always be the case with other forms of localised deformation, such as slow earthquakes and creeping landslides. For such events, a velocity rather than a displacement maybe more appropriate. Also, not all localised deformation events will justify the cost of producing an LDM and implementing it into the datum. Jordan (2005) discusses these issues, including comprehensive case studies on the August 2003 Fiordland earthquake and a landslide scenario.
7. Conclusion
Figure 11. Evolution of the NDM in the Fiordland Area relative to OUSD.
6. Discussion It is important to note that using a dislocation model based on only 11 repeat observations to produce a LDM for an affected surface area (land) of approximately 28,000 km2 is unlikely to be sufficient to accurately model the deformation for the entire area. The spatial extents are probably sufficient, however the density of the network is likely to be insufficient. It also means that there is no redundancy as all observations will be required to produce the model. Therefore, there is no way to independently assess the accuracy of the model produced. However, this dataset is probably typical of the datasets that will be available after such events in rural situations, and serves well as a case study. In an urban situation, it is likely that the current LINZ geodetic network will provide a sufficient density of marks for resurvey after a significant earthquake event. It is also important to note that the LDM produced here does not account for any ongoing post-seismic deformation. A survey was carried 5
A new NDM structure has been defined, allowing for multiple deformation models to be compiled together, as recommended by LINZ (2003a). The NDM can now be made up of the NVM and one or more LDMs. Beavan and Wallace (2004) modelled the August 2003 Fiordland using a dislocation model (GNS Model 205). An optimised grid of deformation nodes, generated by the dislocation model, has been defined. An LDM has been produced using the optimised grid. The current NVM and the August 2003 Fiordland earthquake LDM have been successfully compiled into a new NDM, which can be implemented into NZGD2000.
8. References Beavan, J. and Blick, G. (2005). Limitations in the NZGD2000 deformation model. This issue. Beavan, J. and Haines, J. (2001). Contemporary horizontal velocity and strain rate fields of the Pacific-Australian plate boundary zone through New Zealand. Journal of Geophysical Research, 106, B1, 741-770. Beavan, J. and Wallace, L. M. (2004). The effect of earthquakes on the New Zealand Geodetic System: A scenario for a major Wellington Fault earthquake, and results from the August 2003 Fiordland earthquake. Report. Institute of Geological & Nuclear Sciences Ltd, pp. 49. Bevin, A. J. and Hall, J. (1995). The review and development of a modern geodetic datum. New Zealand Survey Quarterly, 1, 14-18.
Crook, C. N. (2003). Landonline Adjustment Datablade Design. Land Information New Zealand. Land Information New Zealand (2003a). Implementation of a Deformation Model for NZGD2000: OSG Technical Report 20 Land Information New Zealand. Land Information New Zealand (2003b). Accuracy Standards for Geodetic Surveys Land Information New Zealand, Wellington, pp. 26. Jordan, A. M. (2005). Implementing Localised Deformation Models in a Semi-Dynamic Datum. Masters Thesis, School of Surveying, University of Otago, New Zealand. In press. Pearse, M. B. (2000). Realisation of the New Zealand Geodetic Datum 2000: OSG Technical Report 5 Land Information New Zealand, pp. 18. Reyners, M., and others (2003). The Mw 7.2 Fiordland earthquake of August 21, 2003: Background and preliminary results. Bulletin of New Zealand Society of Earthquake Engineering, 36, 4, 233-248.