E-ISSN: 2321–9637 Volume 1, Issue 5, December 2013
International Journal of Research in Advent Technology Available Online at: http://www.ijrat.org
IMPLEMENTING PATTERN BASED CLUSTERING Pankaj Bhambri1 , Dr. O.P. Gupta2 12
1
Department of Information Technology Guru Nanak Dev Engineering College, Ludhiana 2 Punjab Agriculture University, Ludhiana 1 Email-
[email protected]
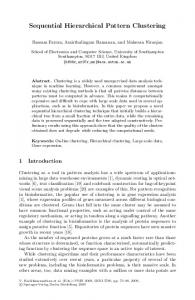
ABSTARCT: In traditional approaches for clustering market basket type data, relations among transactions are modeled according to the items occurring in these transactions. However individual transactions may induce different relations in different contexts. Since such contexts might be captured by interesting patterns in the overall data, so each transaction is represented as a set of patterns through modifying the conventional pattern semantics. Unlike traditional Euclidean distance-based approaches to clustering, the pattern based approach segments customer transactions so that the patterns generated from each cluster are very different from the patterns generated from other clusters. In this paper, pattern based approach to clustering is discussed and a comparison with traditional approaches is shown to prove how it out performs traditional approach. Keywords: Clustering; patterns; semantics. 1. INTRODUCTION Clustering can be considered the most important unsupervised learning problem. It comes under data driven data mining, which is used to discover the relationships between attributes in unknown data, with or without known data with which to compare the outcome. In data driven data mining, data itself drives the data mining process. This approach is best described in situations in which true data discovery is needed to uncover rules and patterns in unknown data. This tends to be the “I don’t know what I don’t know” approach. Clustering is defined as the process of finding groups in scattered cases, breaking a single, diverse set of cases into several subsets of similar cases based on the similarity of attributes; so, as every other problem of this kind, it deals with finding a structure in a collection of unlabeled data. In other words a cluster is a collection of objects which are “similar” between them and are “dissimilar” to the objects belonging to other clusters. We can show this with a simple graphical example:
In this case we easily identify the 4 clusters into which the data can be divided; the similarity criterion is distance: two or more objects belong to the same cluster if they are “close” according to a given distance (in this case geometrical distance). This is called distance-based clustering. But it is generally not clear why a distance based clustering in an n dimensional space, while convenient, is the appropriate manner to group customer. For mixture models, using changing model parameters to represent the difference between segments can often oversimplify the difference between segments and can ignore variables and patterns that are not captures by the parametric models.
79
E-ISSN: 2321–9637 Volume 1, Issue 5, December 2013
International Journal of Research in Advent Technology Available Online at: http://www.ijrat.org Here a different approach to segmenting customer transactions, one that is based on the idea that there may exist natural behavioral patterns in different group of transactions is discussed. For example, a set of typical behavioral patterns that distinguishes a group of wireless subscribers may be: • Their average call duration during weekday mornings is short and all the calls are from the same geographical area. • They call from outside the home area on weekdays and from the home area on weekends. • They have several “data” calls on weekdays. The above set of three patterns may be representative of a group of consultants who travel frequently and exhibit a set of common behavioral patterns. This example suggests that there may be natural clusters in data, characterized by a set of typical behavioral patterns. In such cases, appropriate “pattern-based clustering” approaches can be an intuitive method for grouping customer transactions. If the fundamental difference between segments is a set of such patterns, conventional approaches such as k-means and mixture models will not be appropriate. Pattern recognition is an activity that we humans normally excel in. We do it all the time without conscious effort. The main idea of a pattern-based clustering approach is to divide the transactions into clusters such that the patterns generated from each cluster, while similar to each other, are very different from the patterns generated from the other clusters. The actual representation of a pattern may depend on the domain. In the above example, rules are a natural representation. In a pattern-based clustering algorithm transactions are represented as itemsets. The text is to be typeset in 10 pt roman, single spaced with baselineskip of 13 pt. Text area is 5 inches in width and the height is 8 inches (including running head). Final pagination and insertion of running titles will be done by the publisher. Upon acceptance, authors are required to submit their data source file including postscript files for figures. 2. THE DIVIDE AND CONQUER FRAMEWORK We assume that there is an overall goal of modeling a specific outcome variable (such as whether or not a customer will make a purchase). The framework (Figure 2.1) consists of three stages: a clustering stage, a signature and model building stage, and a prediction stage. In stage one, a set of transactions is grouped into clusters based on an appropriate pattern-based clustering algorithm. Stage two has two parts. First for each cluster, we extract a “signature” that can describe the cluster based on its salient behavioral patterns. There are several methods to represent signatures and this is an active research area. One approach is to use a subset of patterns discovered from each cluster as its signature. The second part in stage two is to build a predictive model (e.g. decision trees, logit models) for the outcome variable separately for each cluster. Hence each cluster ci will have its signature sigi and corresponding model modi. The third stage is to make predictions for new transactions for which the outcome is not known. In this stage, the new transaction is compared to each signature to determine which signature most closely matches the
transaction. Based on this the appropriate model is used (or the models combined using a weighting scheme) to generate the final predictions. Figure 2.1 Framework for Modeling using a Divide and Conquer Approach
80
E-ISSN: 2321–9637 Volume 1, Issue 5, December 2013
International Journal of Research in Advent Technology Available Online at: http://www.ijrat.org 3. PATTERN-BASED CLUSTERING Consider a collection of transactions to be clustered { T1 , T2 , … , Tn }. A clustering C is a partition { C1 ,C2 , … , Ck } of { T1 , T2 , … , Tn }. Each Ci is a cluster. The goal is to maximize the difference between clusters and the similarity of transactions within clusters.
There may be several reasonable definitions of “difference” and “similarity”. For simplicity in illustration, below we provide one measure of the difference and similarity metric between two clusters.
Strength_Pa_Ci represents the strength of pattern Pa in cluster Ci . For example, if a pattern is represented as an itemset, the strength of the pattern can be defined as the proportion of transactions which contain the itemset. For every pattern in a cluster, the above difference measure adds the difference in the pattern strengths to the measure. Note that we normalize this by the actual strength values to capture the fact that the difference between two patterns with strengths 1% and 2%, for example, may be much higher than the difference between two patterns with strengths 97% and 98%. Under certain natural distributional assumptions the difference metric above is maximized when the clusters are pure. The goal of the similarity measure is to capture how similar transactions are within each cluster. The heuristic we use is that if transactions are more similar to each other then they would share more patterns. One approach is to use the number of strong patterns generated as a proxy for the similarity. It becomes easy to cluster the transactions based on similarity measure if the transactions are represented as itemsets. 4. EXPERIMENTAL RESULTS We applied pattern-based clustering on Web browsing data and built models on Web purchasing data to predict online purchase. For Web browsing behavior, a conjunction of conditions is a good representation to capture common behavioral patterns. For example {starting_time = morning, average_time_page < 2 minutes, num_categories = 3, total_time < 10 minutes} is a behavioral pattern that may capture a user’s specific morning pattern of web usage that involves looking at multiple sites (e.g. work email, news, finance etc) in a focused manner such that the total time spent is low. Another common pattern for this (same) user may be {starting_time = night, most_visted_category = games} reflecting her typical behavior at the end of days. Hence, in order to capture the typical behavioral patterns in Web transactions, we use itemsets as the representation for patterns. We report two sets of experimental results. First we show the potential of using a pattern-based clustering approach to learn good customer segments. Second, we evaluate the entire process and show the strength of this approach in building better models for predicting consumer purchase. 4.1. Results from pattern-based clustering Evaluating whether our grouping of transactions using patterns is “good” is hard since it, like any other clustering technique, is an unsupervised learning technique. However, in order to test the efficacy of patternbased clustering it is natural to combine transactions with some known category – e.g. web transactions from different users (without maintaining the user ID) - and examine how the method does in separating transactions that belong to the individual users as compared to traditional clustering techniques. This is the approach used in our experiments. We pick out the sessions belonging to a certain number of users to form sub-datasets in which we delete the specific user ID field. This is then used as the input to our patternbased clustering approach. In order to demonstrate the robustness of our approach, we constructed 30 such sub-
81
E-ISSN: 2321–9637 Volume 1, Issue 5, December 2013
International Journal of Research in Advent Technology Available Online at: http://www.ijrat.org datasets. Among these 30 datasets, 10 datasets contain sessions mixed from 2 users, 10 contain sessions mixed from 3 users, and 10 contain sessions mixed from 4 users. Table 4.1 Percentage of 95% pure clusters generated by the different approaches 2- user data sets 3-user data sets 4-user data sets Ki
Kis
PBC
Ki
Kis
PBC
ki
kis
PBC
1
90.63%
86.11%
75.38%
18.75%
26.47%
48.39%
6.45%
11.11%
47.06%
2
44.12%
60.00%
55.77%
10.00%
23.68%
23.26%
16.67%
22.86%
34.69%
3
42.42%
53.49%
71.01%
41.38%
64.06%
88.70%
15.63%
30.77%
68.18%
4
34.38%
35.42%
83.33%
20.69%
34.69%
52.70%
9.09%
29.17%
62.04%
5
60.00%
87.85%
95.35%
20.00%
46.15%
73.91%
35.48%
50.88%
70.34%
6
51.72%
90.20%
88.16%
30.00%
37.14%
58.10%
12.90%
18.18%
63.55%
7
35.71%
61.67%
95.29%
43.33%
58.54%
83.50%
29.03%
37.21%
85.81%
8
79.31%
83.61%
94.67%
24.14%
55.26%
63.29%
28.13%
43.75%
51.35%
9
21.21%
60.19%
81.16%
34.38%
33.33%
50.00%
16.13%
21.21%
41.67%
10
70.97%
69.77%
65.67%
36.67%
45.28%
45.76%
21.88%
19.44%
55.34%
Mean
53.05%
68.83%
80.58%
27.93%
42.46%
58.76%
19.14%
28.46%
58.00%
(Source: Yinghui Yang, Balaji Padmanabhan, Divide and Conquer: An Approach to Model Building Using Pattern-Based Clustering) Table 4.1 presents the results on the 30 datasets and we compare pattern-based clustering with two other approaches. One is applying hierarchical k-means on data represented in items (ki). The other one is applying hierarchical k-means on data represented in itemsets (kis). Our pattern-based clustering (PBC) is also applied on data represented in itemsets. The comparison between ki and kis demonstrates that itemset pattern representation is good. The comparison between kis and PBC shows that our algorithm is more effective in clustering data represented in itemsets. The hierarchical k-means algorithm is a divisive hierarchical algorithm that iteratively divides the transactions into two clusters. For each division, we use traditional k-means to divide the data into two clusters. Since hierarchical k-means has the same structure as our pattern-based clustering approach, we can draw better comparisons. Among all the clusters generated, we compute how many of them are “pure” in the sense that they contain transactions from mostly a single user. Since in practice it is hard (for all methods) to completely isolate individual users, we use a “95% pure” metric, which computes the percentage of clusters in which 95% of the transactions belong to a single user. The pattern-based clustering (PBC) approach significantly out-performs ki and kis, suggesting that pattern based clustering techniques may be a natural approach to cluster consumer transactions such as Web transactions. It is notable that as the problem got more difficult (isolating transactions of a single user becomes progressively difficult as the number of other users increases), the improvement from the pattern-based clustering technique actually increased. In addition to the quantitative results, there are several examples of interesting clusters discovered in the data. For example: • Two significant itemsets in a cluster were {starting_day = Saturday, most_visited_category = sports} and {starting_day = Sunday, most_visited_category = services such as chat rooms} –reflecting a weekend behavior pattern of one of the users in the data. • A highly significant itemset in a cluster was {start category = search, most visited category = retail} indicating shopping patterns driven by Web searches rather than going to favorite sites to make purchases. 4.2. Results from model-building Unlike the data used for the above results, each record in the dataset used in this set of experiments represents a user (as opposed to a user-session which was the unit of analysis above). The outcome variable we predict is whether a given user makes an online purchase. Explanatory variables include demographics and a summary of Web browsing behavior for each user. We divide the data into two time periods and build clusters and learn models based on the first period data. The problem is to make predictions for all the transactions in the second
82
E-ISSN: 2321–9637 Volume 1, Issue 5, December 2013
International Journal of Research in Advent Technology Available Online at: http://www.ijrat.org period data and all the results reported here are based on the predictive accuracies in the holdout sample. Corresponding to stage 1 of the framework, transactions are clustered based on the pattern-based clustering approach used above (and also based on k-means for comparison). Corresponding to stage 2, we use the set of most frequent itemsets (with support above 10%) as the signature for each cluster generated by PBC and we use the centroid of each cluster as the signature for the k-means approach. And then decision tree for each cluster is built. Corresponding to stage 3 of the framework, a new transaction is matched with each signature in the following manner. For the PBC approach, the match between a transaction and a signature is defined as the number of patterns in the signature that are contained in the transaction. For k-means the match is simply the Euclidean distance between the new point and each centroid. In both cases, we select the model corresponding to the cluster with the best match to make the final prediction. In addition to comparing the two clustering-based approaches, we also report results from building a single model on the entire data (Global). Table 4.2 lists the mean squared error for the three modeling techniques across 20 runs. A paired t-test shows that PBC significantly outperforms the k-means and global models (by 10.26% and 12.85% respectively). Table 4.2 Comparison of mean squared errors Global k-means PBC 1 25.79% 25.10% 22.95% 2 25.77% 26.30% 22.97% 3 26.05% 24.67% 23.07% 4 25.61% 25.25% 23.10% 5 26.50% 26.04% 22.00% 6 26.61% 25.23% 23.17% 7 26.27% 25.63% 22.23% 8 25.70% 25.20% 22.62% 9 26.09% 25.06% 22.92% 10 25.93% 25.39% 22.62% 11 26.13% 25.40% 22.40% 12 26.42% 25.59% 23.09% 13 25.84% 25.08% 22.32% 14 26.40% 25.56% 22.88% 15 26.53% 25.57% 23.14% 16 25.74% 24.84% 22.50% 17 26.36% 25.21% 22.97% 18 26.04% 25.22% 22.37% 19 25.88% 24.81% 22.45% 20 26.23% 25.75% 22.99% mean 26.09% 25.35% 22.74% (Source: Yinghui Yang, Balaji Padmanabhan, Divide and Conquer: An Approach to Model Building Using Pattern-Based Clustering) These results suggest that pattern-based clustering can be an effective segmentation technique and can be used to build better models. In future work we plan to do a more extensive evaluation spanning various types of prediction problems and across a large number of datasets. 5. CONCLUSION More generally, we wish to get a better handle on why and under what conditions pattern-based clustering will be a better approach than conventional techniques. While we do not provide an answer here, one conjecture is that many transactions often have natural categories that are not directly observable from the data. For example, web transactions may be for work, for entertainment, shopping for self, shopping for gifts, transactions made while in a happy mood etc. This information though, is just not in the data. However, the set of patterns corresponding to transactions in each category will be different. Transactions at work may be quicker and more focused while transactions for entertainment may be long and across a broader set of sites. Hence grouping transactions such that the patterns generated from each cluster are ‘very different’ from those generated from another cluster may be an effective method for learning the natural categorizations.
83
E-ISSN: 2321–9637 Volume 1, Issue 5, December 2013
International Journal of Research in Advent Technology Available Online at: http://www.ijrat.org References [1] [2] [3] [4] [5] [6]
Shanker K Pal, Pabitra MitraPattern Recognition Algorithms for Data Mining, CRC Press, 2005. Yinghui Yang, Balaji Padmanabhan. "GHIC: A Hierarchical Pattern-Based Clustering Algorithm for Grouping Web Transactions," IEEE Transactions on Knowledge and Data Engineering, vol. 17, no. 9, 2005. Wang, K., Xu, C. and Liu, B. “Clustering Transactions Using Large Items”, Proc. 8th Int. Conf. on Information and Knowledge Management (ACM CIKM'99), Kansas City, 1999. Wang, H., Yang, J., Wang, W., and Yu, P.S., “Clustering by Pattern Similarity in Large Data Sets”, Proc. ACM SIGMOD Conference, Madison, WI, June 2002. Yang, Y. and Padmanabhan, B., “Segmenting Customer Transactions Using a Pattern-Based Clustering Approach”, In Proceedings of the Third IEEE International Conference on Data Mining (ICDM2003), Melbourne, Florida, November 19-22, 2003. Yang, Y. and Padmanabhan, B., “YACA-2: A Pattern-Based Clustering Approach”. Working paper, OPIM Department, The Wharton School, October 2003.
84