... that support the link between quality improvements and customer satisfaction (e.g., Bolton and Drew ... In public transport services, negative critical incidents may have the ... were told that the first 100 to answer would receive a lottery ticket.
Implementing Quality Improvements in Public Transport
Implementing Quality Improvements in Public Transport Margareta Friman, Karlstad University, Sweden
Abstract This study addresses two questions: (1) What effect does quality improvement have on satisfaction with public transport services? (2) What effect does quality improvement have on passengers’ perceived frequency of negative critical incidents? A representative sample was used of people 16 to 75 years old in the 13 regions in Sweden that were conducting quality improvements in public transport. Data were collected before and after implementation (n=2797). The before and after samples consisted of independent groups of respondents. The response rate was 54 percent. The main conclusion of the study is that the satisfaction people experience when using public transport services is influenced by quality improvements only to a limited extent. Furthermore, the effect was directionally opposite in that respondents reported less satisfaction and higher frequencies of negative critical incidents after the quality improvements had been implemented.
Introduction Recent years have witnessed an emphasis on delivering high-quality services to customers using public transport (e.g., Cunningham, Young, and Kroeter 1995; Ieda et al. 2000). Empirical evidence exists from other services that support the link between quality improvements and customer satisfaction (e.g., Bolton and Drew 49
Journal of Public Transportation, Vol. 7, No. 4, 2004
1991; Nilsson, Johnson, and Gustafsson 2001; Simester et al. 2000). However, we know relatively little about the consequences of quality improvement programs in public transport services. An important question to ask is: Do quality improvements influence satisfaction? Thus, an aim of the present study is to examine the effects of different quality improvements among users of public transport services. Consumer Satisfaction A substantial amount of research in recent years has dealt with consumer satisfaction (e.g., Cadotte, Woodruff, and Jenkins 1987; Churchill and Surprenant 1982; Fornell 1992; Oliver 1980, 1997; Oliver and Swan 1989; Tse and Wilton 1988; Westbrook 1987). One approach in this research emphasizes transaction-specific or encounter satisfaction; that is, satisfaction with single transactions or encounters with a product or service (e.g., Oliver 1980; Oliver and DeSarbo 1988). Another approach focuses on cumulative satisfaction (e.g., Bolton and Drew 1991; Fornell 1992; Westbrook and Oliver 1991). In the latter approach it is assumed that satisfaction is determined by satisfying or dissatisfying encounters with a product or service over time. In both approaches satisfaction is either defined as overall satisfaction or broken down into satisfaction with performance attributes (Anderson and Sullivan 1993; Cronin and Taylor 1992; Gotleib, Grewal, and Brown 1994). The Role of Critical Incidents in Satisfaction Formation A critical incident is an encounter that is particularly satisfying or dissatisfying (e.g., Bitner, Booms, and Tetreault 1990). Its occurrence is assumed to have a significant impact on satisfaction. In public transport services, negative critical incidents may have the highest impacts. Examples are delay in the service, lack of information, misinformation, or rude employees/staff. In contrast to being customers of services that focus more on positive feelings (e.g., restaurants or entertainment outlets), avoiding dissatisfaction is likely to be the passengers’ goal when using public transport services. An important question to ask is: What influences do negative critical incidents have on satisfaction? One possibility proposed and tested by Friman, Edvardsson, and Gärling (2000) is that the frequency of remembered negative critical incidents is the source of attribute-specific cumulative satisfaction. This, in turn, has a direct effect on overall cumulative satisfaction. An example is that the remembered frequency of delays is related to attribute-specific satisfaction as a certain degree of unreliability of the service, which has a negative effect on a passenger’s overall cumulative satisfaction with the service. 50
Implementing Quality Improvements in Public Transport
In an experimental study, Friman and Gärling (2001) further examined the influences on satisfaction of different frequencies and types of negative critical incidents. As hypothesized, attribute-specific cumulative satisfaction was found to be related to the frequency of negative critical incidents, and overall satisfaction to attribute-specific satisfaction. The frequency of different negative critical incidents had about equally great effect on satisfaction with attributes corresponding to specific types of negative critical incidents. However, the effect on overall satisfaction of these frequencies varied. For instance, those related to rude treatment by employees, unreliability of service, and lack of or misleading information had greater effects than frequencies related to poor vehicle design. This finding can partly be explained by differences in affective reactions caused by different incidents (Friman 2001). If service performance is low (e.g., slow performance, long delays, no direct line), passengers are likely to be less satisfied over time. Conversely, high service performance is assumed to increase satisfaction with the service. One possible explanation is that low service performance results in many negative critical incidents. Consistent with previous results (Friman, Edvardsson, and Gärling 2001), this will lead to low overall and attribute-specific cumulative satisfaction. An implication of this logic is that quality improvements should increase overall satisfaction and decrease the total frequency of negative critical incidents. Friman, Edvardsson, and Gärling (2001) found that different negative critical incidents had selective effects on corresponding attributes. By including different quality improvements in this study, the relationship between type of improvement, type of negative critical incident, and attribute-specific satisfaction were possible to explore.
Method Overview and Samples The general research strategy was to measure perceived frequency of negative critical incidents and satisfaction in an initial data collection (Time 1, before quality improvements had been initiated) and in a second data collection (Time 2, when improvements had been completed). After contacting all transport authorities in Sweden (25 in total), only public transport companies that had budgeted and planned for quality improvements during the forthcoming year were selected to participate. As a result, 18 quality improvements implemented by 13 companies 51
Journal of Public Transportation, Vol. 7, No. 4, 2004
responsible for local bus service in just as many regions were included in this study. Specific improvements were in information systems (4), vehicle standards (7), increased number of departures (3), and construction of travel centers (4). Sample 1. A random sample of 2,600 respondents was selected consisting of people between 16 and 75 years old from the 13 regions. (See Table 1 for population and sample sizes in each region.) Questionnaires were mailed to each respondent’s home with a reply-paid envelope. To increase the response rate, the addressees were told that the first 100 to answer would receive a lottery ticket. Two reminders were sent out, the last one with a new copy of the questionnaire. After three months, 1,250 usable questionnaires had been received corresponding to a response rate of 48 percent, of which 40 percent were men and 60 percent women. The mean age was 45.0 years (SD = 19.1 years). Twenty-six percent reported that they used public transport on average more than once a week; 5 percent reported that they had no possibility to choose other means of travel than bus.
Table 1. Population, Sample Sizes, and Response Rates of the 13 Regions Region Karlstad Halmstad Kalmar Ljungby Gällivare Piteå Arjeplog Luleå Jönköping Söderhamn Hudiksvall Vaxholm Örebro Total 1 2
52
Population
Sample Size
T 11
T 22
80,958 86,504 60,026 26,965 19,408 40,519 3,297 72,118 18,509 27,278 37,053 9,612 125,461
200 200 200 200 200 200 200 200 200 200 200 200 200 2,600
93 86 91 79 83 80 91 101 91 97 92 102 164 1,250
123 114 130 110 107 112 107 107 115 107 119 124 172 1,547
Response rate Time 1, sample 1 Response rate Time 2, sample 2
Implementing Quality Improvements in Public Transport
Sample 2. Another random sample of 2,600 respondents living in the same regions (see Table 1) was selected after the improvements had been completed. (The post-test measures were collected approximately one year after completion of the improvements.) The sample consisted of people between 16 and 75 years old. Questionnaires were mailed to each respondent’s home with a reply-paid envelope. To increase the response rate, all respondents received a lottery ticket. Two reminders were sent out, the last one with a new copy of the questionnaire. After three months, 1,547 usable questionnaires had been received corresponding to a response rate of 60 percent, of which 37 percent were men and 61 percent women. The mean age was 44.5 years (SD = 16.2 years). Twenty-five percent reported that they used public transport on average more than once a week; 4 percent reported that they had no option to choose other means of travel than bus. Nonusers in sample 1 (202) and sample 2 (286) were removed from further analyses. Questionnaire The questionnaire consisted of three modules and concerned experiences with public transport services. In module A, respondents were asked to rate their cumulative overall and attribute-specific satisfaction. Module B consisted of descriptions of negative critical incidents that the respondents were asked to judge. In module C, respondents answered sociodemographic questions. Measures Satisfaction. Respondents rated their current satisfaction with the public transport service. Ratings were made of overall satisfaction (2 scales) and satisfaction with 13 attributes. The questions were intended to correspond to the following dimensions known to be important in public transport service (Friman and Gärling 2001) and other services (e.g., Edvardsson 1996): treatment by employees (how customers are treated by the staff and whether employees take appropriate actions), reliability of service (punctuality and travel time), straightforward information, and design (scales relating to comfort, security, and cleanliness). For each question, respondents checked a nine-point scale ranging from “very dissatisfied” to “very satisfied.” Frequency of Negative Critical Incidents. A set of 11 descriptions of negative critical incidents was presented in module B. These consisted of the negative critical incidents reported in Friman, Edvardsson, and Gärling (1998; 2001) based on analyses of actual experiences of public transport use obtained from customer complaints 53
Journal of Public Transportation, Vol. 7, No. 4, 2004
and interviews. The incidents referred to treatment by employees, reliability of service, simplicity of information, and design. In the questionnaire, one description was presented on each page. Instructions explained that the descriptions referred to events that had happened to bus or streetcar passengers in the respondents’ own region. Respondents were asked to read each description carefully and to indicate: (1) whether they had never, a few times, occasionally, or regularly experienced anything similar; (2) if they did not remember when it occurred, or if it was last week, last month, some time last year, or earlier; and (3) how negatively they experienced the incident.
Results The 13 satisfaction scales were summed and averaged to yield four indices corresponding to treatment by employees, reliability of service, simplicity of information, and design (Friman, Edvardsson, and Gärling 2001). Table 2 reports means, SDs, Cronbach’s alphas, and intercorrelations between the four indices among respondents of the total sample.
Table 2. Intercorrelations, Cronbach’s sa, Means, and Standard Deviations of Index Variables M Reliability of service Treatment by employees Simplicity in information Design
(REL) (TRE) (SIM) (DES)
6.15 6.21 6.01 6.45
SD
REL
TRE
SIM
DES
1.93 (0.82) 1.93 0.59 (0.91) 1.81 0.59 0.55 (0.69) 1.76 0.54 0.53 0.58 (0.68)
Cronbach’s s are given within parentheses in the main diagonal.
a
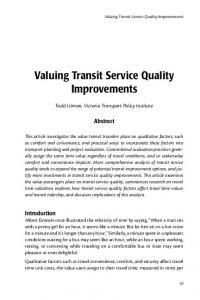
Baseline Satisfaction A core aim of the improvements was to increase customer satisfaction in public transport. Figure 1 shows perceived satisfaction among the respondents in the pre-sample. The higher the score, the more satisfied with the specific dimension of the public transport service.
54
Implementing Quality Improvements in Public Transport
Figure 1. Satisfaction in the Pre-Sample (n=1048)
There were no gender differences in satisfaction (p>0.01). However, significant differences in satisfaction were found when frequent users were compared with nonfrequent users. The former judged reliability of service lower than the latter (mean = 5.7 for frequent users and 6.2 for nonfrequent users, t=5.4,