Understanding Society Working Paper Series No. 2012 – 04 June 2012
Implementing the Biosocial Component of Understanding Society – Nurse Collection of Biomeasures Stephanie L. McFall, Cara Booker, Jon Burton, (Institute for Social and Economic Research University of Essex)
and Anne Conolly (NatCen Social Research)
Implementing the Biosocial Component of Understanding Society – Nurse Collection of Biomeasures Stephanie L. McFall, Cara Booker, Jon Burton, Anne Conolly Abstract The design of Understanding Society: The UK Household Longitudinal Study calls for enhanced health content relative to its precursor study, the British Household Panel Survey (BHPS). This paper documents the design and implementation of the collection of biomeasures by trained nurses in Understanding Society. It reports response outcomes for participation in the nurse visits. As an illustration of the utility of the data, we compare mean blood pressure and prevalence of hypertension with published figures from the 2009 Health Survey for England. This paper will be useful for Understanding Society users and be relevant to those implementing a longitudinal survey with biosocial data collection.
Key words: biomarkers, survey design, nurse data collection JEL Classifications: H10, C81, C83 Author contact details:
[email protected] Acknowledgements: This research is part of the Understanding Society programme, funded by the UK Economic and Social Research Council. We recognize the assistance of Kavita Deepchand, Maya Agur, and Rachel Craig.
3
Implementing the Biosocial Component of Understanding Society – Nurse Collection of Biomeasures Stephanie L. McFall, Cara Booker, Jon Burton, Anne Conolly Non-technical Summary This paper documents the implementation of collection of biomeasures (also referred to as biomarkers) by trained nurses in Understanding Society. The main motivation is to augment survey data with objective health assessments and genetic information to support exploration of biological pathways and environmental influences on human behaviour and health. This paper describes the consultation and selection of the general approach to data collection; a separate nurse assessment of eligible participants approximately five months after the survey interview. The paper describes training of nurses, characteristics of participants asked to have the nurse visits, the set of measures, and information about data collection. It also describes processes to ensure informed consent by participants prior to having measures conducted or giving biological samples. Using preliminary data from the first year of Wave 2, we examine the level of participation at household and individual levels and factors associated with higher or lower levels of participation. In Wave 2, Year 1, among households with at least one respondent eligible for the nurse stage, 62% had one or more successful nurse visits. Of the individuals eligible for a nurse visit, 74% took part. Participation in individual measures ranged from 95% to 99% of those eligible for the procedure. Consent to provide a blood sample for research purposes was 77% of eligibles and for DNA analysis was approximately 75% of respondents eligible for venepuncture. In addition, we compare gender and age patterns for blood pressure and hypertension to data from the 2009 Health Survey for England. The design choices adopted supported timely implementation of a suite of biomeasures and the collection of blood, for tests, such as cholesterol, and for genetic analysis. When the data collection has been completed, we anticipate that there will be more than 20,000 with direct measures like anthropometrics and stored blood samples for approximately 13,000 adults. The collection of biomeasures substantially enhances interdisciplinary research possibilities for research in the health and social sciences and will serve as a major research resource.
4
Implementing the Biosocial Component of Understanding Society – Nurse Collection of Biomeasures Stephanie L. McFall, Cara Booker, Jon Burton, Anne Conolly 1. Introduction This paper documents the implementation of collection of biomeasures by trained nurses in Understanding Society, the UK Household Longitudinal Study (UKHLS). It describes the design and early experience with the nurse visits. The documentation will be useful for Understanding Society users and be relevant to those implementing a longitudinal survey with biosocial data collection. Section 2 outlines the reasons for expanding the biosocial data collection for Understanding Society and alternative models for this type of data collection in longitudinal studies. Section 3 details features of the design. Section 4 reports on participation in the nurse visits. Section 5 summarises results for selected measures. Section 6 describes how the data will be released. Section 7 has conclusions.
2. Understanding Society as a biosocial survey The design of Understanding Society calls for enhanced health content relative to its precursor, the British Household Panel Survey (BHPS). The BHPS had annual questions related to health status and health service utilisation and periodic additional questions. Understanding Society augments survey questions with direct health assessments, the collection of biological samples and linkage of survey data with administrative health records. Understanding Society collects genetic information and selected phenotype information from participants to augment the rich longitudinal socio-economic and psychological data from the survey. This will support exploration of biological pathways and environmental influences on human behaviour and health (Hobcraft, 2008). Population-based sample surveys which combine demographic, social and behavioural data with biological measures will be referred to as biosocial surveys. The scientific importance of biosocial studies is plain. It is important to identify health effects of social and economic policy initiatives. The relationship of health on social and economic outcomes is similarly interesting. The design of Understanding Society shapes the research questions to be addressed by offering large 1
sample size, the ability to characterize shared living arrangements and other aspects of the social environment of households, and wide variation in age of sample members (Buck & McFall, 2012). The collection of biomeasures in Understanding Society substantially enhances interdisciplinary research possibilities for research in the health and social sciences including health economics, epidemiology, behavioural science, health psychology and medical sociology. The purpose is to provide objective health measures in order to understand the interactions of individuals’ behaviour, well-being, health and disease within their social context. Since Understanding Society is intended to be a resource for the larger research community, the biomeasures are intended for research conducted by a variety of researchers, not limited to a fixed set of guiding hypotheses. Some attention to terminology is important. Biological sample or specimen refers to the actual blood, urine or other biological substance taken from the participant’s body. Biomarker refers to an objectively measured indicator of normal or pathogenic processes or of response to treatment (Puntmann, 2009). Common examples are assays generated from a biological specimen such as glycated haemoglobin or blood pressure. We use the broader term, biomeasures, to refer to a range of biological, anthropometric, functional, and sensory measures (Jaszczak, Lundeen, & Smith, 2009). Data collection of biomeasures was funded by the Economic and Social Research Council with resources from the Large Facilities Capital Fund of the Department for Business, Innovation, and Skills. The period of funding was 2010-2012. The necessity to complete data collection in the period of funding limited the length of the development phase of this study component. The financial support helped the study to fulfil aspirations related to biosocial objectives earlier than would otherwise be possible. Consultation early in the study on biological and health content included two commissioned papers (Hobcraft, 2007; Kumari, Wadsworth, Blake, Bynner, & Wagner, 2006). Hobcraft (2007) advanced an approach of regular collection by survey interviewers of a small number of biomeasures in the context of the survey interview over multiple waves. He also emphasised the importance of genetic information, and, within the questionnaires of relatively stable characteristics believed related to brain function, and variables assessing context or environment. Kumari and associates (2006) recommended a model of collection by nurses. They also made specific recommendations on biomarkers, timing and sample considerations, release of the data, and costs.
2
Additional experts were asked to comment on the papers as part of the consultation. While very different in their recommendations, both papers have influenced design decisions.
2.1. Models of biosocial collection There are three principal models for collection of biomeasures. Each model combines interviews with collection of direct functional or physical measures, e.g., blood pressure, height, and obtaining biological samples. They can be categorised by the extent to which they try to replicate laboratory and clinical measurements or adapt these measurement processes to the survey situation (Lindau & McDade, 2008). It is also possible to use self-completion, i.e., have participants collect and return biological specimens. This approach will not be discussed as it is usually less comprehensive. 2.1.a. Clinic-based model In the clinic-based model participants are often interviewed in their homes and asked to come to a clinical facility for the biomeasures. The assessment centre may be mobile. Examples include The Irish Longitudinal Study on Ageing (TILDA) and the 1946 Birth Cohort study or National Study of Health and Development (Kuh, et al., 2011). TILDA has a three hour health assessment conducted by trained nurses in centres in Dublin and Cork (Kenny, et al., 2010). TILDA is notable for its implementation of sophisticated measures such as reaction time for cognitive function, phasic blood pressure and heart rate variability for cardiovascular health, novel measures of gait, balance and sensory problems in relation to mobility; ultrasound of the heel to assess osteoporosis, and retinal photographs for visual problems. Whole blood samples are obtained for multiple analytes, which are analysed in a central laboratory. TILDA uses nurses to conduct the health assessments. As noted, this model offers great flexibility in the range of measures and in processing biological samples. It is feasible to process samples immediately and to have greater control over temperatures. Equipment does not need to be set up repeatedly, so measurement reliability should be greater. It is also likely that with centralisation, fewer staff can be used. Major disadvantages for this model are in the heavy respondent burden and strong potential for selection bias since persons who have the greatest difficulty getting to the assessment centre tend to have more health problems (Kenny, et al., 2010). TILDA has implemented a shorter assessment conducted by nurses in participants’ homes, for those
3
not able to go to the health centre. The response rate for the interview portion was 62%, and it was reported that more than 80% of survey respondents had agreed to a health assessment (Kearney, et al., 2011). 2.1.b. In-home collection by nurses The second model uses trained health professionals to conduct assessments in the participant’s home. This is generally in a separate visit because of the different strengths and training of nurses and interviewers. This model is used by the English Longitudinal Study of Ageing (ELSA) (Marmot & Steptoe, 2008) and the Health Survey for England (HSE) (Mindell, et al., 2012). ELSA used a sample of persons aged 50 or older drawn from participants in the HSE in 1998, 2000 and 2001. The survey content focuses on health, financial resources, retirement and family. In separate visits in waves 2 and 4, qualified nurses trained in phlebotomy conducted the biomeasure collection. The measures included anthropometrics, blood pressure, respiratory function, and various functional performance measures. Venepuncture was used to collect whole blood samples for various analytes and for DNA. The principal advantage is that a core set of measures can be collected by trained professional staff within the participant’s home such that respondent burden is limited. Compared to the range of measures that can be conducted in the clinic-based model, the biomeasures are relatively low-tech, with portable equipment subject to wear and tear and requiring frequent recalibration. Biological samples must either be sufficiently robust so as to be transported without degradation or require processing or preservation. Finally, the separate nurse visit involves complexity and additional expense. In Wave 2 of ELSA, 82% of core sample members completed an interview. Of that group 88% had a nurse visit or 71% of those eligible for a wave 2 interview (Banks, Breeze, Lessof, & Nazroo, 2006). Participants received an incentive of £10 (Banks, Muriel, & Smith, 2010). 2.1.c. Integrated biomeasures collection by interviewers The third model collects biomeasures in participants’ homes using non-clinically trained interviewers. There is limited experience in the UK in training interviewers for collection of clinical measures. However, this model has been used in the US, notably by the Health and Retirement Study (HRS) (Weir, 2008). The HRS enhanced health approach integrates biomeasure collection with the interview, on a random half of the sample in each period of data collection. The measures include anthropometric measures, blood pressure, peak flow, grip strength, and timed walk 4
(Crimmins, et al., 2008b). The biological samples are capillary blood captured on filter paper (dried blood spots) and saliva for DNA (Crimmins, et al., 2008a). The chief advantage of this model is that all elements of data collection (interview and biomeasures) are carried out in a single visit, further limiting the respondent burden and eliminating the need to schedule separate visits. The selection of measures is constrained to those for which interviewers lacking clinical backgrounds can be trained to safely and reliably perform. The collection of biological samples using minimally invasive methods such as finger prick for collection of dried blood spots has been increasingly used in surveys (McDade, Williams, & Snodgrass, 2007), though this method limits the amount of blood and the range of analytes relative to those which can be extracted using venepuncture. The integration of interview and biomeasures extends the length of the interview, which could contribute to attrition in future waves. As with the nurse visit model, samples must be transported; this limits the selection of analytes. The biomeasures collection for HRS takes place in the middle of the interview. The consent ranges from 93% for body measures and 83% for blood spot collection (Sakshaug, Couper, & Ofstedal, 2010). The incentive is $100 per person (Banks, et al., 2010).
3. Design of the biosocial component The topics for this section include selection of the basic model of data collection and training. It is followed by eligibility for the nurse visit, measures, informed consent, data collection, and transfer of the biological samples.
3.1 Model of data collection and sample considerations Of the three alternatives, the use of clinical centres was rejected. We believed that homebased data collection would have smaller selection effects and reduced impact on attrition relative to clinic-based models. Also, the need for multiple clinical centres required to cover the study region would be logistically complex and expensive. Several factors supported the interviewer model. It had somewhat lower labour costs than the nurse model, and other surveys had implemented a reasonable range of measurement protocols. For the same amount of money we could conduct assessments on a larger number of participants though possibly with a smaller range of measures. In addition, National Centre for Social Research (NatCen) and ISER staff attended HRS interviewer training and concluded that it would be possible 5
to adapt training methods used by the HRS to the UK situation. However, there would be delays associated with the need to identify labs for analyses of dried blood spots, to develop training methods for the non-clinical interviewers, and to adopt some measurement protocols for interviewers. By contrast, the nurse model was strong in supporting early implementation of data collection using an approach of high quality. NatCen has extensive expertise with this approach through work on the HSE, ELSA and other studies. There were well-developed measurement protocols relevant to the research agenda of Understanding Society. We also perceived greater support within the UK scientific community for the more familiar nurse visit model. For example, Kumari et al. (2006) recommended use of nurses to collect biomeasures. A second major consideration was which parts of the sample would have assessments, since resources would not stretch to accommodate the full sample. Our first priority was to obtain objective information for participants with the richest survey data. This argued for studies of adults and particularly for participants in the BHPS. Second, we selected participants from the general population component to avoid potential issues of attrition if selecting the ethnic minority boost sample component. Finally, there was insufficient survey nurse workforce capacity in Northern Ireland and so the assessments were restricted to England, Scotland and Wales. With respect to the model of data collection, we opted for the nurse model. We continued to put effort into the development of an interviewer-based approach, potentially to be applied in a second phase. Such a second phase could potentially be used to increase the sample size with assessments, though with a smaller range of measures. The pilot study of this approach will be reported in a separate working paper.
3.2 Nurse training The training built upon the basic preparation for NatCen’s freelance nurse interviewers. All nurse interviewers were required to be currently registered on the Nursing and Midwifery Council (NMC), have active membership in the Royal College of Nurses (RCN) or Royal College of Midwives (RCM), and show evidence of competency in venepuncture within the last 6 months. In addition nurse interviewers were required to have evidence of satisfactory immunity to hepatitis B, tuberculosis and rubella and to complete a satisfactory Enhanced Criminal Records Bureau check. Nurses have an initial four day training, which covers NatCen working principles, laptop use and CAPI training and protocols for commonly collected bio-measures. Before commencing 6
work on Understanding Society, nurses attended a further one day briefing which covers the project-specific requirements and procedures. Nurses new to the freelance nurse panel observe an experienced nurse carrying out an in-home visit. Then they have a supervised launch in which their adherence to procedures, including venepuncture, is assessed. Following this assessment, nurses are permitted to work alone. Survey nurses are periodically observed by supervisors and receive feedback about the extent to which their performance adheres to the protocol.
3.3 Eligibility A sub-sample of Understanding Society participants was eligible for a nurse visit. Eligibility criteria were completion of a full face-to-face interview in the corresponding wave, being adult (aged 16 or older), living in England, Scotland or Wales, and completion of the interview in English1. Participants from the general population sample were assessed in wave 2. The second year of Wave 2 data collection used a sampling fraction of .81 of the primary sampling units. It was necessary to subsample because the Wave 3 collection of the BHPS sample component was taking place at the same time, putting limits on the nurse workforce. Participants from the former BHPS sample component were studied in wave 3. Nurse visits were not conducted in Northern Ireland, due to the low nurse capacity of the Northern Ireland fieldwork agency. In addition, the ethnic minority boost sample component was not sampled, although ethnic minorities in the general population sample were eligible. Nurses could be assigned multiple interviews per household; however, eligibility was based on characteristics of individuals. More information about the sample design of Understanding Society can be found in Lynn (Lynn, 2009).
3.4 Measures All measurements at the nurse visit were conducted by qualified nurses trained to the study specifications. The measurement protocols are listed in detail in the Nurse Measurement Protocol http://data.understandingsociety.org.uk/documentation/mainstage/fieldwork-documents. Table 1 summarises the measures, construct and the estimated time required. Measures were sought from all eligible participants. Appendix A summarises the exclusion criteria for each procedure.
1
Respondents could request the survey materials and a nurse visit in Welsh, as required by the Welsh Language Act. No such requests were made.
7
Table 1. Description of Measures Measure Anthropometrics – height, weight, waist circumference, percent body-fat
Equipment needed Leicester model portable stadiometer
Estimated time 11 minutes
Frankfort plane card
Respiratory function FVC, FEV1, PF, FEV1/ FVC
Tanita scale (BF-522) insertion tape ndd EasyOn-PC spirometer
15-20 minutes
Diastolic and systolic blood pressure, pulse
Omron HEM 907 monitor cuffs in 3 sizes
10 minutes
Hand or grip strength Blood samples, non-fasting (19.8ml). Taken in the following order: Serum (6ml tube) Citrated Plasma (1.8ml tube) Ethylenediaminetetraacetic acid (EDTA) (4ml tube) x 3
Smedley Hand Dynamometer, Venepuncture consumables
3 minutes 15 minutes
The sequence of measures began with a set of anthropometric assessments. Most are related to obesity and cardiovascular risk (Snijder, van Dam, Visser, & Seidell, 2006) though they are also considered relevant to other conditions and as general measures of health. They are height, weight, waist circumference, and percent body fat. Height and weight are used in the calculation of body mass index and are important for the study of obesity and as risk factors for major chronic conditions and social outcomes (de Koning, Merchant, Pogue, & Anand, 2007; Rexrode, Buring, & Manson, 2001). The waist circumference permits the assessment of excess fat concentrated in the abdomen. Body fat scales use bioelectric impedance analysis (BIA) to analyse body composition (percent body fat).This method is less accurate than underwater weighing or x-ray absorptiometry, but is less demanding in terms of specialised equipment and skills for data collection (Snijder, et al., 2006). Systolic and diastolic blood pressure and pulse were measured using the Omron HEM 907 electronic sphygmomanometer. Blood pressure that is persistently high is a risk factor for stroke, heart conditions and other adverse health effects (Fox, et al., 2007). The resting pulse rate or number of beats per minute has been studied as a risk factor for cardiovascular disease. Three 8
readings were obtained from all adult participants except those who were pregnant. Cuffs in three sizes were available to fit participants with varying sized arms. The nurses had a script with information to convey and advice to see their general practitioner in relation to different levels of elevated blood pressure. Respiratory function is relevant for detecting both obstructive and restrictive respiratory diseases including chronic obstructive pulmonary disease (COPD); it can also be used to assessing health in general (National Clinical Guideline Centre, 2010). Most of the data collection was done using the ndd EasyOn PC spirometer. The lung function tests in Scotland used the Vitalograph micro, with five trials. The ndd device has an ultrasound flow sensor which measures the transit time to determine flow velocity, volume and molar mass of the gas. The spirometer connects directly into the nurse’s laptop through a USB port with results saved directly onto the computer. The ndd software also provides instant feedback about the quality of the forced manoeuvre, reducing subjectivity in the assessment process. Three valid trials were sought. Several measures of respiratory function were obtained. The measures obtained include forced vital capacity (FVC), the amount of air that can be forcibly blown out after a full inspiration; forced expiratory volume (FEV1), the amount of air that can be blown out in one second; and peak expiratory flow (PEF), the maximum speed of air moving out of the lungs. FVC and FEV1 are measured in litres of air, PEF is measured in litres per second. The ratio of FEV1/FVC can also be computed and provides an indication of airway obstruction. Additional measures can be derived. Grip strength is assessed as an indicator of muscle strength and can also be used to monitor joint conditions that affect the hand. Hand grip strength in midlife has been shown to be highly predictive of functional limitations and disability in older ages and health-related quality of life (Rantanen, et al., 1999). The Smedley dynamometer was used to measure grip strength. The device adjusts for the size of the hand. The procedure was conducted in a standing position with the arm held at right angle. The assessment has three trials for both the dominant and non-dominant hand, switching between each measurement. Non-fasting blood samples were obtained for research. Participants were asked to consent to the use and storage of blood for research and separately for genetic studies. DNA was later extracted and stored. At the storage facility, samples were centrifuged and aliquoted and frozen at 80 degrees C. for storage.
9
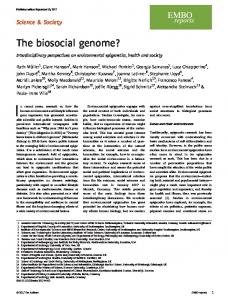
3.5 Informed consent Approval from the National Research Ethics Service was obtained for the collection of biosocial data by trained nurses in waves 2 and 3 of the main survey. (Understanding Society - UK Household Longitudinal Study: A Biosocial Component, Oxfordshire A REC, Reference: 10/H0604/2). Informing respondents takes place in various stages and formats. This sequence of data collection activities and communications with participants is shown in the flow sheet (Figure 1, Nurse Visit Flowsheet). The nurse visit followed the interview by approximately five months. After the interview, participants received an advance letter and small leaflet describing the nurse visit by post. These advance materials can be found at http://data.understandingsociety.org.uk/documentation/mainstage/fieldwork-documents. Staff from the NatCen Telephone Unit called to introduce this study component, answered non-clinical questions about the study, and explained that the nurse will be calling to make an appointment. The nurse scheduled the appointments. At the visit, participants received an additional leaflet about the specific measures and the collection of blood samples. The survey nurses were briefed to give the participants time to read the leaflet and consent form and to consider their decision before signing the consent form or orally agreeing to a procedure. Participants were free to consent or not to any procedure. Direct measurements like grip strength were based on oral consent while written procedures were used prior to obtaining the blood samples. The consent form booklet can be found at http://data.understandingsociety.org.uk/documentation/mainstage/fieldwork-documents. The participants received a copy of the signed consent form, which has information about how to withdraw their consent to blood storage, if they decide to do so after the nurse has left the household. Respondents aged 16 and 17 years old are legally capable of providing consent on their own behalf. However, nurses were advised to check with parents (when present), as a matter of courtesy, before taking a blood sample from this age group. Nurses followed advice from the Mental Capability Act to assess whether respondents suffer from mental impairments such that they are unable to provide informed consent, that is, if the person cannot understand, retain, and make use of the information relevant to the decision and communicate the decision.
10
Figure 1. Flowsheet of Biosocial Collection by Survey Nurses
STAGE 1 “T”
Advance letter including £10 voucher for eligible respondents
Interviewer visit: CAPI interview to nurse visit
Previous study: REC 08/H0604/124
Selection of eligible respondents
STAGE 2 “T + 5 months”
NURSE VISIT
Data returned to office
Advance letter, small leaflet
Nurse telephone contact: introduction, questions answered and appointment made
Telephone Unit contact: introduction, questions answered
Nurse visit: introduction, leaflet 2 protocols, equipment and measurements
Blood sample protocols and collection
Appointment letter
labeling & dispatch
Lab storage
Thank-you letter to participant with £10 voucher
11
3.6 Data collection Data collection began in May 2010 for eligible participants interviewed in January 2010. Blood samples were not collected the first month because procedures were not ready in the storage facility. Computer Assisted Personal Interviewing (CAPI) using Blaise software was used to record information from the assessment. The CAPI script reinforces some safety features of the assessment and performs some range checks on measurements. The average nurse visit required approximately 60 minutes if all measurement and samples were taken. Participants could, if they wished, receive a Measurement Record Card with their blood pressures, height, weight, and percent body fat. There was no feedback of other measurements, for example, the results of blood tests. Participants who took part in the nurse visit received a £10 voucher after the nurse visit, sent to them by NatCen.
3.7 Transport of the biological samples The procedures were designed to transport properly-labelled blood samples from the participant’s home to the secure storage facility, Fisher Bioservices in Hertfordshire. Up to five tubes of blood we obtained from participants. Each tube was labelled as it was obtained to avoid confusion of samples within a household. Samples from an individual were placed in a vial transport container and then in a plastic envelope. The samples were accompanied by despatch notes from the consent form package. This has information about the source of the sample (serial number, sex, date of birth), the samples enclosed and date taken, the nurse number and whether the participant consented to DNA analysis. The nurse posted the package as soon as possible and within 24 hours. For more detail see the Project Instructions for Nurses http://data.understandingsociety.org.uk/documentation/mainstage/fieldwork-documents.
4. Participation in nurse visits The analysis is based on data from sample members interviewed in the first year of Wave 2. This was all the data available at the time of the analysis. The analyses should be viewed as preliminary since the data have not been processed for release and the analyses are not weighted.
12
4.1 Household level participation As seen in Figure 1, households with adults considered eligible for the biomeasures were first issued to the telephone unit. Table 2 describes the disposition of households issued to the telephone unit. Of 9,836 households issued to the telephone stage, 1,869 refused and 19 were classified as not eligible by the telephone unit. Nurses were issued all households who had consented to the visit during the telephone stage, as well as all of those who had not been contacted. Nurses visited 62% of eligible households, but an additional 942 households refused and 21 households were found to be ineligible at this stage. For example, the eligible adult was pregnant.
Table 2. Household response n Issued to telephone unit
9,836
Refusals
2,811
Refusal to telephone unit or office
%
29
1,869
HH Refusal to nurse
942
Ineligible
40
Ineligible classified by telephone unit
19
Ineligible classified by nurse (pregnant)
21
Non-contact Successful nurse assessment
881
9
6,104
62
Table 3 describes the association of several factors with household participation in nurse visits among households issued to the telephone unit. Participation was lowest in Wales and highest in England. Within England, there were not major differences in participation but the lowest rates were in the North East and North West. The household composition in terms of number or age of children or number of pensioners was not associated with participation. Participation was lower in households in the lowest quartile of household income or if the household has no car. There was much lower household participation from households in which one or more member had refused an interview during wave 2 interview phase.
13
Table 3. Nurse Assessment Participation by Household Characteristics Nurse Assessment Household Characteristic Yes No % Country of Residence 29 England 71 Wales 65 35 Scotland 67 33 Government Office Region 31 North East 69 North West 68 32 Yorkshire and Humberside 72 28 East Midlands 71 29 West Midlands 71 29 East of England 71 29 London 71 29 South East 72 28 South West 72 28 Income Quartiles 1 68 32 2 70 30 3 71 29 4 72 28 Need Translated Interview Yes 67 33 No 70 30 Number of Cars 0 65 35 1 72 28 2 72 28 3 71 29 Number of People Employed 0 70 30 1 69 31 2 73 27 3 69 31 Number of People over Pensionable Age 0 71 29 1 70 30 2 70 30 Number of Children Under 11 0 70 30 1 74 26 2 74 26 14
Base
8402 539 887 495 1192 825 844 850 949 827 1419 988 2457 2457 2457 2457 159 9669 2074 4287 2750 712 1549 1558 3014 655 4816 723 1237 578 1145 855
3 4 Age of Youngest Child 0 3 5 10 Household Response Outcome All eligible members interviewed Interviews and proxies Interviews and refusals
71 60
29 40
219 40
73 74 73 71
27 26 27 29
855 408 746 828
72 66 58
28 7943 34 987 42 897
4.2 Individual level participation The 12, 412 households issued to the nurses were a combination of households which had made an appointment for a nurse assessment and those for which the telephone unit had not made contact. At the individual level, 9,178 had a nurse visit (74%), with 5,901 providing a blood sample and 3,277 having a nurse visit but not providing a blood sample. About 20% of individuals did not have a nurse assessment for a variety of reasons: refusal of all eligible members, lack of contact, moved, etc.). 83 persons were ineligible when it was time for the assessment (pregnant, dead). Table 4 summarises selected socio-demographic characteristics with individual participation in the nurse visit and Table 5 describes their association with providing a blood sample if they had a nurse visit. We have not shown consent to DNA analysis since most who gave a blood sample also consented to genetic analysis. There were no gender differences in participation or providing a blood sample. Younger participants were much less likely to have a nurse assessment and also less likely to provide a blood sample. Individuals aged 60 or older were most likely to have a nurse visit. Those aged 50 to 69 had the highest levels of providing blood samples. Individuals with GCSE qualifications or A-levels were the most likely to not have a nurse assessment, but educational qualifications were not associated with providing blood among participants. Persons never married were least likely to have a nurse visit or blood sample.
15
Table 4. Nurse Assessment by Individual Characteristics Nurse Individual Characteristics Visit No Visit % Gender Male 73 27 Female 74 26 Age 16-19 55 45 20-29 58 42 30-39 70 30 40-49 74 26 50-59 77 23 60-69 85 15 70-79 85 15
Base
5466 6496 716 1534 2071 2373 2045 1944 1729
Marital Status Never Married Married or Living in a Couple Separated/Divorced Widowed
62 76 79 83
38 24 21 16
2423 7977 1200 812
Highest Qualification No Qualification GCSE/O-Level A-Level Higher Education Degree Other
76 71 70 77 76 75
24 29 30 23 24 25
2560 2471 2329 1540 2713 688
NS-SEC Routine Semi-routine Lower supervisory and technical Small employers and own account Intermediate Lower management and professional Higher professional Large employers and higher management
71 70 73 71 73 72 73 76
29 30 27 29 27 28 27 24
659 1184 577 629 848 2184 605 361
16
Table 5. Blood Sample Provided among those with Nurse Assessment by Individual Characteristics (percent) Blood No Blood Base Individual Characteristics Sample Sample % Gender Male 64 36 4002 Female 64 36 5162 Age 16-19 50 50 393 20-29 58 42 888 30-39 58 42 1442 40-49 65 35 1746 50-59 72 28 1584 60-69 69 31 1649 70-79 64 36 1462 Marital Status Never Married Married or Living in a Couple Separated/Divorced Widowed
57 66 65 61
43 34 35 39
1491 6052 944 677
Highest Qualification No Qualification GCSE/O-Level A-Level Higher Education Degree Other
63 63 65 68 64 66
37 37 35 32 36 34
1949 1756 1640 1186 2057 499
NS-SEC Routine Semi-routine Lower supervisory and technical Small employers and own account Intermediate Lower management and professional Higher professional Large employers and higher management
66 61 73 66 66 66 64 68
34 39 27 34 34 34 36 33
471 824 422 444 623 1574 443 273
The relationship of two health characteristics with participation in the nurse visit (Table 6) and provision of a blood sample among nurse visit participants (Table 7) is shown below. Individuals
17
with fair or poor health were more likely to complete a nurse visit, and those with poor health were less likely to provide a blood sample. Having a limiting long standing illness (LLI) was positively associated with having a nurse assessment, but those with an LLI were less likely to provide a blood sample.
Table 6. Nurse Assessment by Individual Health Characteristics Nurse No Nurse Health Characteristics Visit Visit % Self-Rated Health Excellent 71 29 Very good 73 27 Good 74 26 Fair 77 23 Poor 77 23 Limiting Long-standing Illness No 72 28 Yes 79 21
Base
2008 4236 3501 1856 806
9451 2955
Table 7. Blood Sample Provided for those with Nurse Assessment by Individual Characteristics (percent)
Health Characteristics Self-Rated Health Excellent Very good Good Fair Poor Limiting Long-standing Illness No Yes
Blood Sample
No Blood Sample %
67 65 65 63 52
33 34 35 37 48
1420 3110 2582 1430 619
65 61
35 39
6832 2330
18
Base
Table 8 describes participation in each measure. Participation rates for individual procedures ranged from 95% to 99% of eligible persons, with the exception of providing a blood sample. About three quarters of eligible persons consented to give a blood sample or to DNA analysis, and samples were obtained from 71% of eligible persons.
Table 8. Response to each Biomeasure – Wave 2 Year 1 Nurse Visits
N % of eligibles 9,178
% of interviews
Height Eligible Measure obtained
9,178 9,061
100 99
99
Weight Eligible Measure obtained
9,116 8,875
99 97
97
Waist circumference Eligible Measure obtained
9,178 9,038
100 98
98
Blood Pressure Eligible Measure obtained
9,178 8,993
100 98
98
Grip Strength Eligible Measure obtained
8,982 8,896
98 99
97
Lung function Eligible Measure obtained
7,954 7,571
96 95
82
Blood sample Eligible Consent to sample Consent to DNA Blood sample obtained
7,940 6,130 5,994 5,666
86 77 75 71
67 65 62
a
a
Excludes Scotland Many design features can influence participation so it is difficult to find appropriate studies
for comparison. Multiple response outcomes could be examined as well. We are using the Health Survey for England (HSE) for comparisons. While the HSE is a cross-sectional study and limited to England, its measures overlap with those in Understanding Society and it uses a similar model of 19
interview followed by a nurse visit for health assessment. The interval for HSE is two to six weeks, while for Understanding Society it was approximately five months. We have chosen to compare the percentage cooperating in the second stage nurse assessment visit and provision of a blood sample. In 2009, there were 4,645 adults interviewed in the HSE. Cooperation in nurse visits following interview was 70% (n=3,261). The percentage of interviewed adults providing a blood sample was 75% (n= 2,453) (Craig & Hirani, 2010). For Understanding Society, 74% of eligible interviewed adults had a nurse visit and 64% of those with a nurse visit provided a blood sample.
5. Blood Pressure and Hypertension We illustrate the utility of the data with analyses about blood pressure and hypertension. Hypertension (high blood pressure) is a common chronic disease and important risk factor for cardiovascular disease (Krause, Lovibond, Caulfield, McCormack, & Williams, 2011). Table 9 displays the age-sex profile of mean diastolic and systolic blood pressure for Understanding Society and published data from the 2009 HSE (Craig & Hirani, 2010). In both studies the values are the average of the second and third readings. The HSE restricted the analysis to people who had not smoked, drank or eaten shortly before the assessment. The HSE analysis is weighted, and unweighted counts are shown. Systolic blood pressure is the pressure when the heart is contracting. For Understanding Society the mean systolic blood pressure was 129.7 mmHg for men and 122.7 mmHg for women, as compared to 129.9 mmHg for men and 123.5 for women in HSE. Systolic blood pressure increased with age, ranging from 123.4 mmHg for the 16-24 year category to 134.3 mmHg for men aged 75 or older. For women it increased from 112.2 mmHg to 136.7 mmHg across the age categories. Systolic blood pressure was higher in men than women. The pattern and mean levels were similar in the two studies.
20
Table 9. Mean Systolic and Diastolic Blood Pressure Levels by Age Group and Gender Understanding Society Wave 2, Year 1
Males Systolic blood pressure (SBP) Mean Standard error of the mean Diastolic blood pressure (DBP) Mean Standard error of the mean Females Systolic blood pressure (SBP) Mean Standard error of the mean Diastolic blood pressure (DBP) Mean Standard error of the mean Bases (Unweighted) Males Females
Systolic blood pressure (SBP) Mean Standard error of the mean Diastolic blood pressure (DBP) Mean Standard error of the mean
16-24 Years
25-34 Years
35-44 Years
45-54 Years
55-64 Years
65-74 Years
75+ Years
Total
123.4
125.7
127.4
129.4
132.7
133.8
135.3
129.7
0.82
0.65
0.58
0.56
0.54
0.59
0.74
0.24
66.2
71.6
76.6
77.5
76.5
73.2
68.7
72.9
0.58
0.46
0.41
0.40
0.38
0.42
0.52
0.17
112.2
112.9
115.1
121.8
127.7
132.7
136.7
122.7
0.73
0.55
0.49
0.48
0.48
0.56
0.69
0.22
67.1
70.2
72.4
74.9
74.8
71.8
68.4
71.4
0.52
0.39
0.34
0.34
0.34
0.40
0.49
0.15
306 413
475 701
599 605 600 440 255 903 873 784 504 289 Health Survey for England, 2009
3280 4467
16-24 Years
25-34 Years
35-44 Years
45-54 Years
55-64 Years
65-74 Years
75+ Years
Total
125.1
125.5
127.0
130.9
135.8
133.9
135.8
129.9
1.07
1.43
0.90
0.96
1.12
1.36
1.89
0.47
66.3
72.2
75.6
78.8
77.7
73.2
68.2
73.7
0.95
0.99
0.73
0.67
0.82
0.75
1.14
0.37
21
Females Systolic blood pressure (SBP) Mean Standard error of the mean Diastolic blood pressure (DBP) Mean Standard error of the mean Bases (Unweighted) Males Females
111.7
113.7
116.4
124.2
132.4
135.9
137.5
123.5
0.86
0.78
0.75
1.04
1.12
1.30
1.49
0.46
66.3
70.5
72.1
76.4
76.1
73.3
68.2
72.1
0.77
0.65
0.67
0.68
0.65
0.76
0.81
0.28
110 139
131 194
228 311
222 237
208 220
223 214
116 188
1238 1539
Diastolic blood pressure is the pressure when the heart is between contractions. For Understanding Society the mean diastolic blood pressure was 72.9 mmHg for men and 71.4 mmHg for women, as compared to 73.7 mmHg for men and 72.1 mmHg for women in the 2009 HSE. Mean diastolic blood pressures increased with age for both men and women to the category 45-54, and then decreased somewhat after age 65. Diastolic blood pressure is slightly higher for men. The age-sex distribution of diastolic blood pressure is similar in the two studies.
Table 8. Hypertension Categories by Age Group and Gender* Understanding Society, Wave 2, Year 1 16-24 Years Males Normotensive untreated Hypertensive controlled Hypertensive uncontrolled Hypertensive untreated All with hypertension
Females Normotensive untreated Hypertensive controlled
25-34 Years
35-44 Years
45-54 55-64 Years Years
65-74 Years
75+ Years
Total
93
88
79
68
53
39
31
62
0
1
5
12
24
40
47
19
0
0
1
2
3
1
1
1
7 7
11 12
15 21
18 32
21 47
19 61
21 69
17 38
99
95
91
79
60
42
30
71
0
1
3
8
23
39
51
17
22
Hypertensive uncontrolled Hypertensive untreated All with hypertension
Bases (Unweighted) Males Females
0
0
0
1
2
1
1
1
1 1
3 5
6 9
11 21
16 40
18 58
18 70
11 29
260 336
403 579
525 772
578 781
618 798
537 629
367 434
3288 4329
Health Survey for England (2009) Males Normotensive untreated Hypertensive controlled Hypertensive uncontrolled Hypertensive untreated
94
85
83
67
47
42
27
68
-
-
2
7
13
22
31
8
-
1
2
5
11
15
19
6
6 6
13 15
13 17
21 33
29 53
21 58
24 73
18 32
99
95
88
75
59
40
36
73
-
-
3
4
10
19
22
7
-
-
2
4
8
18
26
7
1 1
5 5
7 12
17 25
23 41
23 60
17 64
13 27
Bases (Unweighted) Males Females
110 139
131 194
228 311
222 237
208 223.00 256 214.00
116 188
1238 1539
Bases (Weighted) Males Females
208 194
209 219
255 272
230 230
204 220
110 159
1365 1454
All with hypertension
Females Normotensive untreated Hypertensive controlled Hypertensive uncontrolled Hypertensive untreated All with hypertension
149 161
Normotensive untreated: SBP less than 140mmHg and DBP less than 90mmHg and not taking medication prescribed for high blood pressure Hypertensive controlled: SBP less than 140mmHg and DBP less than 90mmHg and taking medication prescribed for high blood pressure Hypertensive uncontrolled: SBP at least 140mmHg or DBP at least 90mmHg and taking medication prescribed for high blood pressure Hypertensive untreated: SBP at least 140mmHg or DBP at least 90mmHg and not taking medication prescribed for high blood pressure
23
To assess the prevalence of hypertension, we have used ≥ 140 mmHg for systolic blood pressure or 90 mmHg for diastolic measured blood pressure and whether the individual is currently taking blood pressure medication. Thus, there are four categories: normotensive untreated, controlled treated, uncontrolled treated and hypertensive untreated. While this classification takes account of patterns of treatment, it is based on measurement of blood pressure on a single occasion and cannot indicate that elevated blood pressure is sustained. For Understanding Society, the overall prevalence of hypertension was 38% for men and 29% for women in Understanding Society and in the HSE was 32% for men and 27% for women. Hypertension increased with age for both genders. The percentage in Understanding Society with high blood pressure that is not treated increased with age from 7% in men aged 16-24 to 21% in men aged 55-64 and men aged 75 and older. Similar or higher rates of untreated high blood pressure were found with men in HSE. Rates for untreated high blood pressure for women in Understanding Society were somewhat lower than for men, ranging from 1% in the youngest category to 18% in the two oldest categories. Minor differences in the results for the two studies may relate to different definitions of eligibility for the measure.
6. Data release The release of the biomeasures is shaped by their classification for risk of disclosure, consideration of sensitivity to the study, and, in the case of the biological samples, by the need to sensibly allocate the use of this finite resource. This is regulated by the Understanding Society Data Access Committee. Direct measurements, e.g., blood pressure will be released in anonymised form through the Economic and Social Data Service via the End User Licence. Available blood analyte values are also likely to be released in that way. Researchers will apply to the Data Access Committee to make use of reserve blood samples or to conduct genetic analyses.
7. Conclusions and looking ahead The development and timely implementations of biomeasures for Understanding Society expands the scope for multi-disciplinary research spanning the social and medical sciences. Data collection began in May 2010 and the release of Wave 2 biomedical data will take place in early 2013. 24
Participation rates approached those for the Health Survey for England, a well-established population survey using nurses to collect biomeasures. The proportion providing a blood sample was somewhat lower. We should continue to consider methods to improve participation. This may include design factors such as decreasing the time interval between the interview and the nurse visit and making the nurse visit seem more a part of the interview. The HSE also provides results of some blood tests to participants which may be an incentive to participate. We could also improve methods for communicating with sample members about the health contributions of the study. A more comprehensive analysis of factors associated with participation and providing a blood sample should be conducted when a full wave of data is available. However, these initial analyses show their association with several socio-demographic and health variables. For the data release, we will be preparing weights for analysis of direct measures like blood pressure and for the blood samples. It will be important for analysts to use the weights. The distribution of blood pressure by age and sex was similar for Understanding Society and the Health Survey for England. Congruence with the results of this well-established health examination study reinforces confidence in the new biosocial component of Understanding Society. The figures presented are based on approximately three times more cases than in that year of the HSE, and the remaining months of data collection will also augment the sample size available. We have not moved into large scale collection of biomeasures by non-clinical interviewers. A report on the pilot study is being separately produced. We were able to offer nurse visits to all eligible adults from the general population sample component in England, Scotland and Wales for the first year of Wave 2, the BHPS in Wave 3, and about 80% of sampled areas for Wave 2, year 2. The interviewer collection of at least some measures and of biological samples to yield DNA should be considered for future periods of data collection. While providing data of great interest, the biomeasures will be more important if they are not just collected on a single occasion. Additional resources for this purpose must weigh the utility of repeated measures on the same sample components with extension to other groups including members of the ethnic minority boost sample, people from Northern Ireland, children, and young people.
25
8. References Banks, J., Breeze, E., Lessof, C., & Nazroo, J. (2006). Retirement, health and relationships of the older population in England. The 2004 English Longitudinal Study of Ageing (Wave 2). London: Institute for Fiscal Studies. Banks, J., Muriel, A., & Smith, J. P. (2010). Attrition and health in ageing studies: Evidence from ELSA and HRS. Bonn, Germany: Institute for the Study of Labor. Buck, N., & McFall, S. (2012). Understanding Society: Design overview. Longitudinal and Life Course Studies, 3(1), 5-17. Craig, R., & Hirani, V. (2010). Health Survey for England, 2009. Vol 2. Methods and Documentation. London: NHS Information Centre. Craig, R., & Hirani, V. (2010). Health Survey for England, 2009. Vol. 1 Health and Lifestyles. London: NHS Information Centre. Crimmins, E., Guyer, H., Langa, K., Ofstedal, M. B., Wallace, R., & Weir, D. (2008a). Documentation of Biomarkers in the Health and Retirement Study. Ann Arbor: Survey Research Center. Crimmins, E., Guyer, H., Langa, K., Ofstedal, M. B., Wallace, R., & Weir, D. (2008b). Documentation of physical measures, anthropometrics and blood pressure in the Health and Retirement Study (No. dr-011). Ann Arbor: Survey Research Center. de Koning, L., Merchant, A. T., Pogue, J., & Anand, S. S. (2007). Waist circumference and waistto-hip ratio as predictors of cardiovascular events: meta-regression analysis of prospective studies. Eur Heart J, 28(7), 850-856. Fox, K., Borer, J. S., Camm, A. J., Danchin, N., Ferrari, R., Lopez Sendon, J. L., et al. (2007). Resting heart rate in cardiovascular disease. J Am Coll Cardiol, 50(9), 823-830. Hobcraft, J. (2007). Enabling transdisciplinary research in the UKHLS: Incorporatingbiomarkers and pathways into research on the interplays among social, economic,behavioural and health sciences. Hobcraft, J. (2008). Genomics and beyond: Improving understanding of human (social, economic, and demographic) behavior. In M. Weinstein, J. W. Vaupel & K. W. Wachter (Eds.), Biosocial Surveys (pp. 381-400). Washington, D.C.: National Academy Press. Jaszczak, A., Lundeen, K., & Smith, S. (2009). Using nonmedically trained interviewers to collect biomeasures in a national in-home survey. Field Methods, 21(1), 26-48. Kearney, P. M., Cronin, H., O'Regan, C., Kamiya, Y., Savva, G. M., Whelan, B., et al. (2011). Cohort profile: the Irish Longitudinal Study on Ageing. Int J Epidemiol, 40(4), 877-884. Kenny, R. A., Whelan, B. J., Cronin, H., Kamiya, Y., Kearney, P., O'Regan, C., et al. (2010). The design of the Irish Longitudinal Study on Ageing. Dublin: Trinity College. Krause, T., Lovibond, K., Caulfield, M., McCormack, T., & Williams, B. (2011). Management of hypertension: summary of NICE guidance. BMJ, 343, d4891. Kuh, D., Pierce, M., Adams, J., Deanfield, J., Ekelund, U., Friburg, P., et al. (2011). MRC National Survey of Health and Development: a new clinic-based data collection for ageing research International Journal of Epidemiology, 40(1), e1-e9. Kumari, M., Wadsworth, M., Blake, M., Bynner, J., & Wagner, G. G. (2006). Biomarkers in the proposed UK Longitudinal Household Study. Lindau, S. T., & McDade, T. W. (2008). Minimally invasive and innovative methods for biomeasure collection in population-based research. In M. Weinstein, J. W. Vaupel & K. W. Wachter (Eds.), Biosocial Surveys (pp. 251-277). Washington, D. C.: National Academies Press. Lynn, P. (2009). Sample design for Understanding Society (No.2009-01).
26
Marmot, M., & Steptoe, A. (2008). Whitehall II and ELSA: Integrating epidemiological and psychobiological approaches to the assessment of biological indicators. In M. Weinstein, J. W. Vaupel & K. W. Wachter (Eds.), Biosocial Surveys (pp. 42-59). Washington, D.C.: National Academy Press. McDade, T. W., Williams, S., & Snodgrass, J. J. (2007). What a drop can do: dried blood spots as a minimally invasive method for integrating biomarkers into population-based research. Demography, 44(4), 899-925. Mindell, J., Biddulph, J. P., Hirani, V., Stamatakis, E., Craig, R., Nunn, S., et al. (2012). Cohort Profile: The Health Survey for England. Int J Epidemiol. National Clinical Guideline Centre. (2010). Chronic Obstructive Pulmonary Disease: Management of Chronic Obstructive Pulmonary Disease in Adults in Primary and Secondary Care. Puntmann, V. O. (2009). How-to guide on biomarkers: biomarker definitions, validation and applications with examples from cardiovascular disease. Postgrad Med J, 85(1008), 538545. Rantanen, T., Guralnik, J. M., Foley, D., Masaki, K., Leveille, S., Curb, J. D., et al. (1999). Midlife hand grip strength as a predictor of old age disability. JAMA, 281(6), 558-560. Rexrode, K. M., Buring, J. E., & Manson, J. E. (2001). Abdominal and total adiposity and risk of coronary heart disease in men. Int J Obes Relat Metab Disord, 25(7), 1047-1056. Sakshaug, J. W., Couper, M. P., & Ofstedal, M. B. (2010). Characteristics of physical measurement consent in a population-based survey of older adults. Med Care, 48(1), 64-71. Snijder, M. B., van Dam, R. M., Visser, M., & Seidell, J. C. (2006). What aspects of body fat are particularly hazardous and how do we measure them? Int J Epidemiol, 35(1), 83-92. Weir, D. (2008). Elastic powers: The integration of biomarkers into the Health and Retirement Study. In M. Weinstein, J. W. Vaupel & K. W. Wachter (Eds.), Biosocial Surveys (pp. 7895). Washington, DC: National Academy Press.
27
Appendix A Exclusion criteria to in-home biomeasures collection Measurement / sample Height
Weight and body fat
Waist
Grip strength
Blood Pressure Spirometry
Exclusion criteria • • • • • • • • • • • • • • • • • • • • • • •
Non-fasting blood sample (venepuncture)
• • • • •
Pregnancy Too stooped to obtain a reliable measurement Too unsteady on their feet Unable to stand Painful to stand up straight Fitted with a pace-maker Pregnancy Too unsteady on their feet Unable to stand Over 130kg (20 ½ stone) Pregnancy Unable to stand Colostomy / ileostomy Pregnancy Swelling or inflammation, severe pain or a recent injury to the hands Surgery on their hands in the last 6 months Pregnancy Pregnancy Abdominal or chest surgery in the preceding three months Detached retina, eye or ear surgery in the preceding 3 months Heart attack in the preceding three months Admission to hospital with a heart complaint in the preceding month Taking medication for the treatment of tuberculosis Pulse rate over 120 bpm It now looks more like:
Pregnancy HIV positive or Hepatitis B or C Clotting or bleeding disorders Currently taking anticoagulants Fit in the last 5 years
28