May 24, 2011 - To date, 14 high-redshift (z > 1.0) galaxy clusters with mass measurements have .... where S3,M describes the normalized skewness of the.
Implications of multiple high-redshift galaxy clusters. Ben Hoyle1,2 , Raul Jimenez1,3 , Licia Verde1,3 1
3
Institute of Sciences of the Cosmos (ICCUB) and IEEC, Physics Department, University of Barcelona, Barcelona 08024, Spain. 2 CSIC, Consejo Superior de Investigaciones Cienticas, Serrano 117, Madrid, 28006, Spain. ICREA, Instituci´ o Catalana de Recerca i Estudis Avan¸cat, Passeig Lluis Companys 23, Barcelona 08010, Spain˙
arXiv:1009.3884v2 [astro-ph.CO] 24 May 2011
(Dated: May 25, 2011) To date, 14 high-redshift (z > 1.0) galaxy clusters with mass measurements have been observed, spectroscopically confirmed and are reported in the literature. These objects should be exceedingly rare in the standard ΛCDM model. We conservatively approximate the selection functions of these clusters’ parent surveys, and quantify the tension between the abundances of massive clusters as predicted by the standard ΛCDM model and the observed ones. We alleviate the tension considering non-Gaussian primordial perturbations of the local type, characterized by the parameter fNL and derive constraints on fNL arising from the mere existence of these clusters. At the 95% confidence level, fNL > 467 with cosmological parameters fixed to their most likely WMAP5 values, or fNL > ∼ 123 (at 95% confidence) if we marginalize over WMAP5 parameters priors. In combination with fNL constraints from Cosmic Microwave Background and halo bias, this determination implies a scaledependence of fNL at ' 3 σ. Given the assumptions made in the analysis, we expect any future improvements to the modeling of the non-Gaussian mass function, survey volumes, or selection functions to increase the significance of fNL > 0 found here. In order to reconcile these massive, high-z clusters with an fNL = 0, their masses would need to be systematically lowered by 1.5 σ or the σ8 parameter should be ∼ 3 σ higher than CMB (and large-scale structure) constraints. The existence of these objects is a puzzle: it either represents a challenge to the ΛCDM paradigme or it is an indication that the mass estimates of clusters is dramatically more uncertain than we think. PACS numbers: cosmology
INTRODUCTION
potential field Φ, as � Φ = φ + fNL φ2 − hφ2 i .
Recent developments in observational hardware and observing techniques have enabled the detection of many massive, high-redshift clusters [see, e.g. 6, 7, 11, 39], which seem to create some tension with the abundance predictions of the standard ΛCDM paradigm [22, 26]. Previous work [12, 31, 35] have examined how the abundance of high-redshift massive clusters within the ΛCDM model can be enhanced by allowing the primordial fluctuations, a relic of inflation, to deviate from a Gaussian random field. The most basic models of inflation predict a scale invariant power spectrum of density pertabations Φ, described by a Gaussian random field φ. Probes of the very early Universe [e.g., 21] and the Large Scale Structure of the late Universe have shown that this description is a good approximation to first order. However, any deviations from the slow-roll, single field, adiabatic vacuum state inflation (and more complex inflationary models) predict deviations from Gaussianity [see e.g., 3, 8, 27, and refs. therein], which are of interest because they 1) Modify the number of high-redshift clusters, relieving tension between theory and observation, and 2) Allow an observational window into early universe physics. The non-Gaussian corrections may be charaterised by the coefficient fNL [16, 30, 48, 57], which affects the initial
(1)
in the so-called local non-Gaussianity case. Observations of the Cosmic Microwave Background (CMB) WMAP3 by Yadav & Wandelt [60], measured fNL to be within 27 < fNL < 147 (at the 95% confidence level). More recently, Komatsu & other [28] find −10 < fNL < 74 (at 95% C.L.), consistent with the above range but also consistent with zero. The CMB constrains fNL at large scales (< 0.03 h/Mpc), but on smaller scales the Large Scale Structure (LSS) can also constrain fNL through the clustering [see e.g., 49, 56, and refs. therein] and abundances of massive halos [see e.g., 31, 35]. Measurements of fNL using LSS, provides complementary constraints to the CMB and probes any scale dependence of fNL . Considering the scale-dependence on halo bias induced by local non-Gaussianity, [59] obtain fNL ∼ 53 ± 25 at 1 σ, (10 < fNL < 106 at 95% confidence) from the NVSS survey; this signal comes from scales k ∼ 0.03 h/Mpc. The detection of the high-redshift cluster of galaxies XMMUJ2235.3+2557 [40] and a Hubble Space Telescope weak lensing mass measurement [24], allowed [26] to show how the tension between fNL = 0, ΛCDM (which predicts ∼ 2 × 10⁻³ such clusters) and this cluster could
2 be alleviated with values of 150 < fNL < 260. Massive clusters abundance probes fNL on scales corresponding to the Lagrangian radius of the halos; k > 0.1 h/ Mpc. [22] then calculated at which redshift and mass, the most massive cluster in the Universe was expected to be found, and how this changed with survey volume. They also found that XMMUJ2235.3+2557 was more than 2σ away from fNL = 0, ΛCDM predictions. Finally, [10] formally calculated the constraints which could be placed on fNL using XMMUJ2235.3+2557. They computed the probability that the “most massive” cluster expected within the survey volume had a mass, 1) greater than the 68% upper mass estimate of the cluster, 2) within the 68% upper and lower bounds on the mass estimate, and 3) less than the 68% lower bound on the clusters mass. They Poisson sampled from these abundances to obtain a probability that a cluster with the mass of XMMUJ2235.3+2557 was the “most massive” system. By exploring how values of fNL modified cluster abundances [using 35], they placed constraints on fNL to be greater than zero at the 95% significance level. We note that fNL > 0 is only one possible explanation of the existence of high-redshift massive clusters [see, e.g., 2]. The above studies represent the latest results for constraining fNL on (∼ 10Mpc) cluster scales, and have concentrated on the above single cluster at high-redshift. We extend these previous works by exploring the constraints on fNL using 14 high-redshift (z > 1.0) spectroscopically confirmed galaxy clusters with masses measured in the literature. The layout of the paper is thus; we begin by reviewing the theoretical form of the cluster mass function and the non-Gaussian correction to it, and continue by describing the compilation of a high-redshift cluster sample. Here we discuss our conservative assumptions about the selection functions and survey volumes. We then describe our analysis and find the best fitting cosmological parameters, followed by our conclusions and discussions. Throughout the paper, unless otherwise stated, we assume a flat ΛCDM model with WMAP5 [21] cosmological parameters (i.e, Ωm , h, ns , σ8 = 0.28, 0.705, 0.960, 0.812), and quote CM B LSS fNL using the LSS convention, e.g. fNL ' fNL /1.3 [see, e.g., 56].
THE NON-GAUSSIAN CLUSTER MASS FUNCTION
The theoretical cluster mass function was first written down by [44] who assumed spherically collapsed halos, and was later improved e.g., [50]. Subsequently, largevolume, high resolution N-body simulations have been performed and mass functions fitting formulae have been found [see, e.g., 5, 25, 55]. We use the spherical overdensity Gaussian mass function given by [25], which de-
termines the number of haloes as a function of mass as measured within a radius at which the density contrast is 180 times the background matter density ρm , and has the form, n(M, z) =
ρ¯ � d ln σM � , f − M d ln M
(2)
where σM is the rms variation of the density field, smoothed on scales M . For a discussion of the minor differences between 180ρm and 200ρm mass functions see [55]. We use the icosmo[61] package [45] to calculate σM (z), co-moving distances and other cosmologydependent parameters, and use the functional form of f [see Equ. B4 of 25] given by � � � f = 0.301 exp − | log σM (z)−1 + 0.64|3.82 . (3) Non-Gaussian corrections to the mass function have been proposed in the literature [12, 31, 33, 35], and over the mass and redshift ranges considered here, agree to within 10% [see Fig. 5 & 6 of 12]. These corrections are typically written as the ratio of the non-Gaussian to Gaussian mass functions R, and are, for example, found by lineararising the 3-point expansion of the collapse density [as in 31], or by using saddle point approximations to non perturbatively account for higher order corrections [as in 35] (MVJ), [although, see 33]. We adopt the MVJ prescription to describe how the ratio of the non Gaussian to Gaussian mass functions change as a function of fNL R(S3,M , M, z) =
n(M, z, fNL ) , n(M, z, fNL = 0)
(4)
where S3,M describes the normalized skewness of the smoothed density field, and can be used to define a fNL =1 “skewness per fNL unit” as S3,M = fNL S3,M . R is given by � � 3 S3,M RN G (M, z, fN L ) = exp δec 2 × (5) 6σM r 1 δ dS δec S3,M ec 3,M q + 1 − , 6 d ln σM 3 δ S 1 − ec 3,M 3
where δec is the critical density for ellipsoidal gravitational collapse. [58] recently tested these predictions for generic non-Gaussianity, using a suite of N-body simulations, but due to difficulty in computing the initial conditions, they probed relatively low mass (≤ 5 × 10¹⁴ M ) systems. They found that the MVJ mass function may slightly over predict the abundances of massive ≤ 5 × 10¹⁴ M clusters at high-redshift. If this result can be extrapolated to more massive clusters at even higher redshifts, then the over prediction of the MVJ non-Gaussian mass function will only strengthen the conclusions drawn
3 from this work, as a larger value of fNL will be required to fit the observed abundances of massive clusters using a more accurate model, implying this analysis is conservative. After the publication of this work, [13] found that the exponential fall in the [25] mass function is not enough to counter the exponential increase in the non-Gaussian correction [35] for very large values of fNL and large masses 16 (> ∼ 10 M ). They find that the [55] mass function is more well behaved for larger values of fNL and masses, but still breaks down at very large scales. We stopped the mass function integration at 1016 M just before the [25] mass function breaks down. They additionally checked and confirmed the robustness of our method to the choice of the mass function and measure a mean value very close to that measured here, for the same sample of clusters, even after correcting for the mass function approximation. In what follows, we only place a lower constraint on the value of fNL , and thus our approach is robust to the choice of mass function at these lower values of fNL and masses considered.
DATA
We compile a list of 14 high-redshift (z > 1.0) spectroscopically confirmed clusters with masses measured or estimated in the literature, and present them in Table I. We believe this list to represent all known spectroscopically identified clusters with mass measurements. We show the cluster’s name, the spectroscopic redshift, the cluster mass and mass error converted to M200 (in units of 1014 M , assuming an NFW profile [41] if necessary) which is the mass enclosed within a radius at which the density is 200 times that of the background matter density. and the reference to the mass measurement. We distinguish clusters detected by X-ray surveys and those found using the Sunyaev-Zeldovich [53, hereafter SZ] effect. Here for each cluster we adopt the mass estimate that gave the least tension (best agreement) with fNL = 0 ΛCDM. For an illustrative example consider two cases; 1) A cluster mass has a large central value (1×10¹⁵ M ) with a large error (4×10¹⁴ M ) , and 2) a cluster has a slightly lower mass estimate (7.9 × 10¹⁴ M ) with a smaller error bar 9 × 10¹³ M ) [see 7]. In our analysis, we find that case 1 is more likely to exist in an fNL = 0 ΛCDM, than case 2. Thus, we use case 1 to be conservative. We note that mass measurements from different techniques typicaly agree well, e.g. XMMUJ2235.3+2557 had mass measurements using weak lensing of 8.3+2.6 −1.9 × 10¹⁴ M , and 7.3 ± 1.3 × 10¹⁴ M [24], and X-ray mass +4.4 measurements of 6 × 10¹⁴ M [47] and 7.7−3.3 × 10¹⁴ M [52].
We also note that potential high-redshift clusters have been detected, but not followed up spectroscopically [e.g. see 17], so their redshifts, and typically, masses are subject to larger uncertainties, if not unknown. This implies that our analysis can only place a lower limit on fNL as the other clusters may have higher redshifts and/or be more massive than the clusters in our sample, which would further boost the required value of fNL . If any of these potential high-redshift clusters candidates were found to be less massive than those in our sample, or at lower redshifts, (and such smaller systems are expected in all fNL > 0, ΛCDM cosmologies), they would not detract from these results using the present selection of clusters, as as our analysis only consider these “rare events” that have already been confirmed. The ability to detect a cluster, measure its redshift and mass for any survey, can be described by the selection function. For believable upper and lower limits to be placed on cosmological parameters (including fNL ) using galaxy clusters, the selection function must be understood. Our analysis uses heterogeneously selected clusters, so combining the selection functions is non trivial. We now describe how we conservatively model the selection functions for the X-ray and SZ surveys. We note that deviations from the conservative modeling, will only strengthen our conclusions.
Selection function
We split the cluster catalogues into two broad categories, those detected using the X-ray by the ROSAT and XMM satellites, and those found using the SZ effect at South Pole Telescope [9, hereafter SPT].
X-ray
Many of the X-ray surveys have partially overlapping footprints, differing flux limits and exposure times. This means that some clusters were multiply detected by distinct groups, e.g. XMMUJ2235.3+2557 was originally detected by the XMM-Newton Distant Cluster Project [40], but was later redetected by the XMM Cluster Survey [46]. The combination of all of the X-ray surveys, as performed here, makes the construction of the full survey volume and selection function non-trivial. We continue conservatively, by assuming that all Xray surveys had independent footprints (even if they did not) and uniform survey volumes (even if some were shallower than others), which we choose to be between 1.0 < z < 2.2 (2.2 represents our estimate of the deepest survey limit). We find that our conclusions are stable to arbitrary increases of the maximum redshift assumed, but will depend on improvements to the modeling of the survey footprints and volumes. We reiterate that any
4 Cluster Name Redshift M200 1014 M Method Mass reference +2.83 + ’WARPSJ1415.1+3612’ 1.02 3.33−1.80 Velocity dispersion [23] ’SPT-CLJ2341-5119’ ∗ 1.03 7.60+3.94 Richness [20] −3.94 ’XLSSJ022403.9-041328’ + 1.05 1.66+1.15 X-ray [36] −0.38 →’SPT-CLJ0546-5345’ ∗ 1.06 10.0+6.00 Velocity dispersion [7] −4.00 +2.53 ∗ ’SPT-CLJ2342-5411’ 1.08 4.08−2.53 Richness [20] ’RDCSJ0910+5422’ + 1.10 6.28+3.70 X-ray [37] −3.70 ’RXJ1053.7+5735(West)’ + 1.14 2.00+1.00 X-ray [52] −0.70 + ’XLSSJ022303.0043622’ 1.22 1.10+0.60 X-ray [52] −0.40 ’RDCSJ1252.9-2927’ + 1.23 2.00+0.50 X-ray [37] −0.50 +1.90 + ’RXJ0849+4452’ 1.26 3.70−1.90 X-ray [37] ’RXJ0848+4453’ + 1.27 1.80+1.20 X-ray [37] −1.20 →’XMMUJ2235.3+2557’ + 1.39 7.70+4.40 X-ray [52] −3.10 ’XMMXCSJ2215.9-1738’ + 1.46 4.10+3.40 X-ray [52] −1.70 ’SXDF-XCLJ0218-0510’ + 1.62 0.57+0.14 X-ray [54] −0.14 TABLE I: We compile a list of high-redshift clusters with mass estimates or measurements from the literature. We show the cluster name, redshift, the mass (converted to M200 ) and 1 σ errors, and the mass measurement technique and the mass reference. We mark clusters identified from X-ray surveys by + and using the SZ SPT survey by ∗ . The → indicate the “least probable” cluster observed in each of the combined surveys.
improvements to the conservative selection function and footprints adopted here, will make any conclusions drawn from this analysis stronger, as a reduced survey volume (caused by a smaller footprint or exposure time), or a worse selection function (i.e. there are clusters in the volume that have not been found) will modify the number of observable clusters expected, which will, at best not change our results, but at worse, increase tension with fNL = 0 ΛCDM. The conservative X-ray survey footprint is 294.5 sq. degrees and is composed of 168 sq. degrees from the XMM Cluster Survey, 64 sq. deg. from the XMM-Large Scale Survey [43], 11 sq. deg. from the XMM-Newton Distant Cluster Project, 1.3 sq. deg. from the XMM Contiguous survey [14], 17.2 sq. deg. from the Wide Angle ROSAT Pointed Survey [42], and 33 sq. deg. from the ROSAT Deep survey [19].
SZ
The SZ SPT survey has a well understood selection function, and was expected to detect all massive clusters above 2 × 10¹⁴ M [4, 18], at all redshifts. We again assume a survey volume between 1.0 < z < 2.2 and use the footprint of 178 sq. degrees. To measure the redshifts of clusters detected with the SZ, one needs optical spectroscopic follow up. Not all the identified clusters have had their redshifts and masses measured [see 20], but we continue conservatively, by assuming that only clusters with follow-up were detected. This is conservative because future cluster measurements will not relieve the tension with fNL = 0 found using the current collection of clusters.
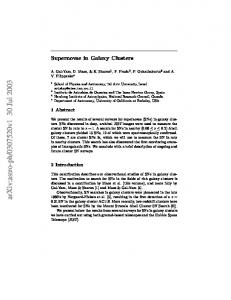
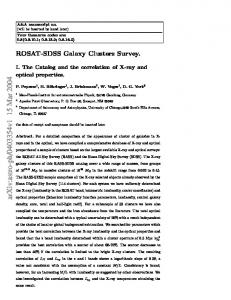
FIG. 1: An Aitoff projection representing the survey footprints of the combined X-ray survey (shown in green) , the SZ SPT survey (yellow), and we also show the SDSS survey footprint (red) for comparison. We note that the X-ray footprints are depicted here as a contiguous region, although the actual footprints consist of pointings across the whole sky. We represent the high-redshift clusters in each survey by crosses and triangles.
Fig 1 is an Aitoff projection representing the survey footprints of the combined X-ray survey (shown as a green contiguous region, although note that the actual X-ray footprint covers many different directions across
5 the full sky), the SZ SPT survey (in yellow), and we also show the Sloan Digital Sky Survey [1, hereafter SDSS] survey footprint for comparison (red). The high-redshift clusters compiled here, are represented by the crosses and triangles. This figure demonstrates how little of the highredshift sky has been observed, and how much volume remains to find other potentially massive, high-redshift clusters, which may increase the tension with fNL = 0 ΛCDM.
METHOD AND RESULTS
Our analysis follows two approaches. First we build on the approach of [and refer the reader to §3 of 10], and define the “least probable” (i.e., a combination of most massive and highest redshift) clusters in each of the combined X-ray surveys and the SZ survey, which due to the high mass, should also be the easiest to find. We then extend the approach of [10], by using the existence of the compiled cluster sample, including the clusters full mass error distributions, to examine the probability that the ensemble of clusters could exist in a ΛCDM universe, and probe how the probability increases with fNL . Initially we keep the cosmological parameters fixed to WMAP5 peak values, and then relax this constraint and marginalize over WMAP5 priors. We used the output of both Gaussian (fNL = 0) and non-Gaussian (with fNL = 250) N-body simulations [obtained from the authors of 58] at a snapshot corresponding to z = 1.0, to successfully blind test the code pipelines. We computed the relative values of fNL needed to explain the existence, abundances, and masses of clusters above > 4×10¹⁴ M , after crudely assuming a survey footprint and a redshift slice i.e., a survey geometry. We found that at a fixed “probability of existing”, the recovered value of fNL for the non-Gaussian simulation data was always > ∼ 225 greater, than that of the Gaussian simulation data. For the assumed survey geometry we found that the probability of the ensemble of clusters to exist was 40% at fNL = 0 in the Gaussian case and < 4% in the non-Gaussian case. In the non-Gaussian case, a value of fNL = 230 is required to obtain a probability of existing to be 40%. We reiterate that the exact recovered probability of existence at fixed fNL values, depends on the crude conversion of the simulated snapshot volume at z = 1.0, to the assumed survey geometry, but the differences between the simulations required a value of fNL similar to that inputted into the non-Gaussian simulations.
The least probable clusters
We begin by asking the question, “What is the least probable object to be found in each survey assuming
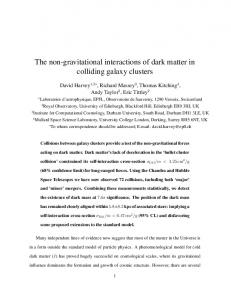
fNL = 0?”. This approach is analogous to determining the most massive system in the survey [e.g. 10], but generalized to include the redshift-dependence of the mass function. Assuming the central value for the clusters mass, we find that the cluster XMMUJ2235.3+2557 is the least probable X-ray detected object, we expect 5.4 over the full sky (and 0.04 in the X-ray survey footprint) at z > 1.39 and M > 7.7 × 10¹⁴ M using our cosmology and theoretical mass function. We also find that SPT-CLJ0546-5345 is the least probable SZ detected cluster; we expect only 12.5 over the full sky (and 0.05 in the survey) with M > 1015 M and z > 1.06. Following [10], we calculate the probability that the mass of the “least probable” cluster in each survey falls within one of the following three mass bins; 1) less than the 1 σ mass range of the cluster, 2) within the 1 σ mass range of the cluster, and 3) greater than the 1 σ mass range of the cluster. This is accomplished by calculating the theoretical cluster abundance within each mass bin, and then Poisson sampling from these three abundances 104 times (using the same random number seed for each of the three bins), and recording the most massive bin which the Poisson samples is ≥ 1. This yields a probability that the “most massive” cluster exists is within the above mass bins, and within the survey volume. We then gradually increase fNL , which boosts the abundances of clusters, and Poisson sample from these new abundances to re-derive the above probabilities. This allows us to place constraints on fNL using the least probable observed cluster in each survey. In Fig. 2 we show the probability that each observed massive cluster is the (theoretically predicted) “least probable” system in the survey as a function of fNL . We note that both clusters provide similar constraints, which, when combined, points to some tension with fNL = 0 ΛCDM. The constraints obtained here, are slightly different to that in [10], due to differences in the assumed survey footprint, mass function and cosmological parameters. Note that for example XMMUJ2235.3+2557 has another (weak lensingbased) mass estimate which has a higher central value and smaller error-bars. This makes our approach conservative.
All clusters
We proceeded by using the existence, masses and full error budgets, of the 14 clusters in the sample. To model uncertainties we adopt the following Monte-Carlo approach. We log Gaussian random sample from each cluster’s mass and error 104 times producing a set of sampled masses MS , and determine how many clusters NS (M > MS , zclus < z < 2.2) one would expect to find above each sampled mass and above the redshift of the
6
FIG. 2: The probability that the “least probable” cluster (in terms of mass and redshift > zclus ) in each survey could exist, and is the “most massive” cluster in the surveyed volume, as a function of fNL . The solid line indicates the probability that a cluster more massive than the identified cluster could exist, the dotted line is the probability for a cluster within the measured 68% mass and error range to be the “most massive system”, and the dashed line shows the probability that a cluster less massive than the cluster is the “most massive” system in the survey volume.
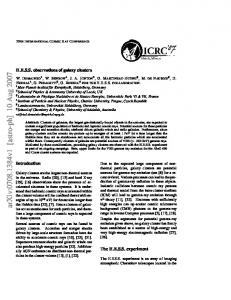
cluster out to edge of survey volume using the mass function expression. For each of the 104 sampled masses MS , we Poisson sample P O from the predicted abundances NS , and noted if the Poisson sample P O (NS ) ≥ 1, i.e. that a cluster more massive than this cluster with a redshift equal to or greater than this cluster could exist. This formed a probability Pi , that each cluster i, could exist (marginalized over its mass uncertainty), rather than forming a probability that the cluster is the “most massive”, as above i.e., the probability a cluster exists is (#P O (NS ) ≥ 1)/104 . We then repeated this analysis for each of the clusters and multiplied the probabilities Pi that each cluster could exist in the surveyed region, to produce a combined probability P (fNL ) = Π Pi , that the ensemble of high-redshift clusters could exist in the modeled universe. We increased the value of fNL and repeated the analysis to produce a probability distribution and stopped the analysis when the P (fNL ) = 1, i.e, that all the clusters were likely to exist in the cosmological model and survey volumes. Fig. 3 shows the probability that each cluster could exist given the survey volumes and selection function. The X-ray and SZ identified clusters are distinguished in the figure, but combined in the analysis. We show how
FIG. 3: The probability that each cluster could exist within the survey volume Pi , assuming ΛCDM with fNL = 0 (black symbols). We show X-ray identified clusters by crosses and SZ identified clusters by triangles. We also show how the probability changes assuming ΛCDM and setting fNL = 580.
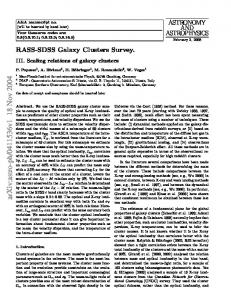
the probability Pi for each cluster, varies if we change fNL from 0 (black symbols) to 580 (red symbols). We see that many clusters are unlikely to exist in a fNL = 0, ΛCDM universe, and by multiplying the probabilities, we find that the probability of the observed Universe being well described by this model is 3 × 10⁻³ . When fNL = 580 we note that each cluster is more likely to exist, and the combined probability = 1 (for our mass function), which suggests that this model is a better description to the observed Universe [although see, 13, for a discussion of the validity of the chosen mass function]. In Fig. 4 we plot the combined probability that all the clusters could exist as a function of fNL . We see that the fNL = 0 model is a poor fit to the observed Universe, and by increasing fNL we alleviate tension. We constrain 467 < fNL at the 95% confidence level using these clusters. We remind the reader that any improvement in the modeling of the survey volumes, footprints or theoretical mass function, or the detection of more massive, highredshift clusters, will only increase this result. Varying cosmological parameters
We next simultaneously Gaussian random sample from the parameters ΩM , ΩΛ , ΩK ≡ (1 − ΩM − ΩΛ ), Ωb , H0 , σ8 , w0 , ns , ∼ 1750 times, using the WMAP5 priors (without imposing spatial flatness) and record the value of fNL evaluated at P = 0.05, denoted
7
FIG. 4: The probability that the ensemble of clusters could exist in a WMAP5 ΛCDM universe, as a function of fNL .
here as fNL |P (0.05) , which describes the probability of observing our 14 clusters P in their surveys P = 0.05 (i.e. the exsistence of these clusters in their surveys is allowed at 95% C.L.). This procedure is totally analogous to the so-called “generalized p-value” for p = 0.05, where the uncertainty in the clusters mass and on cosmological parameters is effectively marginalized over by treating them as “nuisance parameters” with probability distributions given by the mass estimates and WMAP constraints. In Fig. 5 we show the 1d distribution of (generalized) p values (so that P ≥ 0.05) as a function of fNL . In other words Fig. 5 shows the frequency in our Monte Carlo procedure of each value of fNL |P (0.05) . We obtain (123) 330 < fNL |P (0.05) at 68% (95%) confidence. In Fig. 6 we present a selection of two dimensional distributions, showing the values of fNL |P (0.05) for the sampled parameter values, against marginalized distributions of; left) the variance of the density field smoothed on 8 Mpc scales σ8 , and right) the spectral index ns . The filled color contours show the 66% (red) and 95% (blue) significance levels, and we have marked the peaks in each of the distributions by crosses. When viewing these plots, one should keep in mind that they represents p value distributions for p = 0.05; thus these figures should not be interpreted as standard Markov Chain Monte Carlo plots. We find that fNL is degenerate with σ8 , but less degenerate with all the other varied parameters (we have shown only a selection). We can calculate the value of σ8 needed for fNL |P (0.05) = 0 by going to lower p values, or extrapolating down the line of degeneracy using the
FIG. 5: The distribution of fNL , which correspond to P (0.05) for each Gaussian random sampling of the cosmological parameters ΩM , ΩΛ , ΩK , Ωb , H0 , σ8 , w0 , ns using WMAP5 priors.
left panel of Fig. 6, resulting in a value of σ8 ' 0.87. If we only vary σ8 and keep the other parameters fixed to their WMAP5 peaks values, we find fNL |P (0.05) = 0 when σ8 ' 0.89. It is interesting to note that Actacama Cosmology Telescope found σ8 < 0.86 at 95% CL from upper limits on the SZ power spectrum [15], and SPT found σ8 = 0.773 ± 0.025 [32]. The SZ power spectrum signal depends very strongly on σ8 but not as strongly on fNL as, for current observations, it is dominated by massive (> 1014 M ) but lower redshift (z < 1) clusters (see [29]). The latest WMAP results alone (combined with external data sets) give a more direct, cleaner, measurement σ8 = 0.801 ± 0.03 (σ8 = 0.809 ± 0.024) [28]. The high σ8 value necessary to obtain fNL |P (0.05) = 0 is ∼ 3 σ away from these constraints.
CONCLUSIONS AND DISCUSSION
We compiled a list of 14 high-redshift (z > 1.0) galaxy clusters with mass measurements from the literature and used their existence to place constraints on the non Gaussianity parameter fNL . The clusters were identified from X-ray surveys and the SZ SPT survey, and we conservatively assumed a selection function and survey volume. We used the theoretical Gaussian mass function of [25] and the prescription for modifying the cluster abundance for non Gaussianities of [35]. We additionally used the
8
FIG. 6: Two dimensional marginalized plots for the value of fNL above which 95% of the probability distribution lies fNL |P (0.05) , against σ8 and primordial power spectrum spectral index ns . We have represented the peaks in the distributions by thick black crosses and the 66% (95%) confidence levels of these p values by red (blue). Note that these figures represent p value distributions for p = 0.05, and are not normal MCMC plots. Of all the cosmological parameters explored only σ8 shows a degeneracy with fNL .
output of the Gaussian and non Gaussian N-body simulations [obtained from the authors of 58] at z = 1.0, to successfully blind test the code pipelines. We chose to use cluster mass estimates which were performed assuming a cosmology close to WMAP5 ΛCDM, and to remain conservative, if more than one measurement technique had been used, we adopted the cluster mass and error measurement which allowed for the lowest sampled cluster mass. We performed two sets of analysis. First we asked the question, which is the least probable cluster in each survey (this also turns out to be the most massive cluster) and asked how likely this cluster was to be the “most massive” system in each survey. We found that both massive clusters provide some tension with the fNL = 0 WMAP5 ΛCDM model, and that by multiplying the probabilities, we find that these two clusters have a probability of being observed of ∼ 30%. Using the existence of the 14 clusters, their masses and full errors distributions, we then calculated the probability that each cluster could exist in the survey. We sampled from each cluster’s mass and error and calculating the expected (Jenkins mass function-predicted) abundance above each sampled mass and above the redshift of the cluster, and then Poisson sampled from the abundances[62]. We recorded the frequency that the Poisson sampled number was greater than or equal to one, implying that at least one cluster with the sampled
mass could exist above the redshift of the cluster in the survey volume. We used the frequency of existence to construct a probability that each cluster could exist. We then combined all probabilities, to obtain a final probability that the ensemble of clusters could be found in the modeled universe, and we showed how this probability changes with fNL . We note that our method allows for only a lower limit to be placed on fNL . This is because any new clusters, or improvements to the survey volumes, or selection functions, will increase tension with fNL = 0 ΛCDM with WMAP priors on cosmological parameters. We found that the best fitting models bound fNL to be greater than 467 at the 95% confidence level, when keeping the WMAP5 parameters fixed at their peak values. We also Gaussian random sampled from the cosmological parameters ΩM , ΩΛ , ΩK ≡ (1 − ΩM − ΩΛ ), Ωb , H0 , σ8 , w0 , ns using the WMAP5 priors. For each realization, we calculated the value of fNL , above which 95% of the probability distribution lay. We find that the median value of P (0.05) = fNL is 393, and drops below fNL = 123, in only ∼ 5% of realizations. This means that even after marginalizing over cosmological parameters assuming WMAP5 priors, we still find fNL |P (0.05) > ∼ 123 at the 95% confidence level. We have performed several checks: i) the signal is not driven by few objects (e.g., only clusters detected in Xrays or only those detected in SZ, or only clusters which mass estimate is obtained from X-rays etc.) ii) these
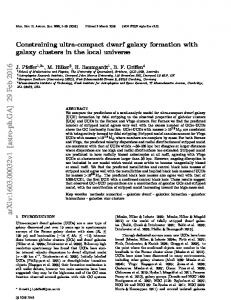
9 result fNL ∼ 53 ± 25 at 1 σ (10 < fNL < 106 at the 95% C.L.) by [59] (dark blue). They also obtained a similar, fully consistent, constraint from the SDSS quasar sample (fNL = 58 ± 24). For our application here we use the NVSS numbers. We used these measurements to constrain the non Gaussian spectral index nN G , defined by [31], ∗ fNL = fNL
FIG. 7: A modification of Fig. 8 of Verde [56], with additional fNL measurements from the literature (see text) and this work. The colored regions show the scale-dependent measurements of fNL using the CMB (green colors), the galaxy halo bias (blue) and the cluster halo abundances (salmon). The enclosed boxes show the 95% confidence levels of each measurement. The small x-axis offsets for different measurements of the same probe is artificial. The lines show the values of scale dependent fNL , see text.
rare events are not evidently clustered in a special patch of the sky iii) cosmological parameters degeneracies: the fNL parameter is degenerate only with the σ8 parameter. To obtain that fNL = 0 is allowed at 95% C. L., the value of σ8 would have to be ∼ 3 σ larger than current cosmological (CMB alone and in combination with LSS) constraints. iv) all the cluster mass estimates would have had to be systematically overestimated by 1.5 σ, regardless of the measurement technique used, to allow the ensemble to clusters to be fully compatible with fNL = 0 ΛCDM. In Fig. 7, we compare the result obtained here with other works, using a modified version of Fig. 8 of [56]. We overplot the result on CMB scales (using the at ∼ 0.04 h/Mpc of 27 < fNL < 147, at the 95% confidence level by [60] (dark green); of fNL = 32 ± 21 at 1 σ by [28] (light green); the LSS results at scales ∼ 0.4 h/Mpc of 449 ± 286 at 1 σ by [10] (light salmon, but note that to apply an upper constraint, they assume that there will be no other clusters found in this footprint as massive LSS or more massive than this cluster); our result of fNL > CM B 123 (so fNL > 95, dark salmon); the result using a measurement of the non Gaussian scale dependent bias at scales ∼ 0.1 h/Mpc of −77 < fNL < 47 at the 95% C.L. and peaked at fNL = 8 by [51] (light blue); and the
� k � nN G , k∗
(6)
where the ∗ indicates the CMB pivot scale, k ∗ = 0.04 h/Mpc. Note that this scale-dependence parameterization does not allow fNL to change sign, so in the following approach only fNL ≥ 0 is sampled by our procedure. This (theoreticaly-imposed) prior is not too important as fNL < 0 for only a small region with relatively low probability (recall that [28] finds fNL > 0 at 1.5 σ). Due to our inability to reliably place an upper constraint on fNL (see the introduction to the data section for justification), we assumed a log normal distribution CM B with a mean of 5.69 and σ = 0.212. for fNL We sampled from the measured values of fNL , while keeping k fixed to the central value, and found the best fitting curve (using MPFIT[63]) and recorded the value of nN G at each pass. The distribution of nN G is described by nN G = 0.50 ± 0.19 at 1σ, which is a 2.6 σ detection of scale dependent bias, using [60], [51] and our result, or nN G = 0.95 ± 0.23 at 1σ, which is a 4.0 σ detection of scale dependent bias, using [28], [59] and our result, or nN G = 0.93 ± 0.23 at 1σ, using [28], [51] and our result. All of these constraints are in agreement with [10]. Since these sets of analysis are not independent, the differing results highlight some possible systematics effects. We show these lines of best fit on Fig. 7.
For a non flat distribution of objects, each with an observed error, we must account for more objects to be scattered into some part of the distribution than are scattered out. This is described by the Eddington bias, and occurs here because the number of expected very massive clusters above a mass M , is exponentially smaller than the expected number of clusters with mass less than M . This could allow lower mass clusters to masquerade as higher mass clusters, and potentially cause us to over estimate fNL . The Eddington bias is estimated to be only a fraction of the full 1σ mass error used in this work, and we have marginalized over the full mass error distribution and have therefore removed any of the Eddington bias effects. As a worked example we present the cluster XMMU J2235.3-2557. To calculate the true Eddington bias, one should adopt the more robust cluster mass estimate not, as we have done here, the more conservative one. Typically, the more conservative mass estimate is the one with the largest mass error. E.g., [38] states
10 the X-ray mass estimate of XMMU J2235.3-2557 to 14 be 7.7+4.4 We find that the statistical −3.1 × 10 M . correction to the mass M , is ∆ ln M = 0.48 with σ 2 ln M = 0.16, and the correction for the Eddington bias is ∆ ln M = 0.56, which is indeed higher than the 1σ statistical correction (although less than 2σ). Now, if we instead use the weak lensing mass estimate M = 8.5 ± 1.7 × 10¹⁴ M , of the same cluster, we obtain a statistical correction of ∆ ln M = 0.2 with σ 2 ln M = 0.04, and the corresponding Eddington bias correction is ∆ ln M = 0.14. The Eddington bias here is therefore 3.5 times smaller than the 1σ statistical error of the X-ray estimate, which is that used in this work. We conclude with the remarks that we have attempted to remain very conservative with our choices of selection functions and volumes, with the cluster mass estimates, and the modeling of the theoretical non Gaussian cluster mass function. Any future improvements in the modeling is expected to strengthen the conclusions of this work; if the survey volume decreases, or more clusters are followed up spectroscopically and found to be massive, or the theoretical non Gaussian mass function modeling is improved, the tension with fNL = 0 WMAP5 ΛCDM will, in all cases, increase. The existence of high-redshift massive clusters is a puzzle: it represent a challenge to the ΛCDM paradigme if the clusters mass estimates reported in the literature (central values and errors) are taken face value. These objects grew too massive too fast compared to the gravitational instability picture in a ΛCDM paradigm. Alternatively this is an indication that mass estimates of high-redshift clusters is dramatically more uncertain than currently believed. Weak lensing clusters mass estimate is an extremely promising approach to test this possibility as [e.g., 34] robust and accurate mass estimates are possible. Such an observational effort would help address this “too big, too early” puzzle.
Acknowledgments
BH would like to thank Christian Wagner for detailed discussions and making the results of his simulations available, and Shaun Hotchkiss for useful discussions and code comparisons, and LV thanks Carlos Penya Garay for discussions. The authors thank a anonymous referees for comments which improved the paper. BH acknowledges grant number FP7-PEOPLE- 2007- 4-3-IRG n 20218, and the Department of Mathematics and Applied Mathematics at the University of Cape Town for hospitality, LV and RJ are supported by MICINN grant AYA20080353. LV is supported by FP7-IDEAS-Phys.LSS 240117, FP7-PEOPLE-2007-4-3-IRGn202182.
[1] Abazajian K. N., Adelman-McCarthy J. K., Ag¨ ueros M. A., Allam S. S., Allende Prieto C., An D., Anderson K. S. J., Anderson S. F., Annis J., Bahcall N. A., et al. 2009, ApJS, 182, 543 [2] Baldi M., Pettorino V., 2011, MNRAS, 412, L1 [3] Bartolo N., Komatsu E., Matarrese S., Riotto A., 2004, Physics Reports, 402, 103 [4] Battye R. A., Weller J., 2003, PRD, 68, 083506 [5] Bhattacharya S., Heitmann K., White M., Luki´c Z., Wagner C., Habib S., 2010, ArXiv e-prints:1005.2239 [6] Bremer M. N., et al., 2006, MNRAS, 371, 1427 [7] Brodwin M., et al., 2010, ApJ, 721, 90 [8] Byrnes C. T., Choi K., 2010, Advances in Astronomy, 2010 [9] Carlstrom J. E., et al., 2009, ArXiv e-prints:0907.4445 [10] Cay´ on L., Gordon C., Silk J., 2010, ArXiv eprints:1006.1950 [11] Chiaberge M., Capetti A., Macchetto F. D., Rosati P., Tozzi P., Tremblay G. R., 2010, ApJL, 710, L107 [12] D’Amico G., Musso M., Nore˜ na J., Paranjape A., 2011, JCAP, 2, 1 [13] Enqvist K., Hotchkiss S., Taanila O., 2010, ArXiv eprints:1012.2732 [14] Finoguenov A., et al., 2010, MNRAS, 403, 2063 [15] Fowler J. W., et al., 2010, ApJ, 722, 1148 [16] Gangui A., Lucchin F., Matarrese S., Mollerach S., 1994, ApJ, 430, 447 [17] Gladders M. D., Yee H. K. C., 2005, ApJS, 157, 1 [18] Haiman Z., Mohr J. J., Holder G. P., 2001, ApJ, 553, 545 [19] Hasinger G., Burg R., Giacconi R., Schmidt M., Trumper J., Zamorani G., 1998, Astron. & Astrophys., 329, 482 [20] High F. W., others. 2010, ApJ, 723, 1736 [21] Hinshaw G., et al., 2009, ApJS, 180, 225 [22] Holz D. E., Perlmutter S., 2010, ArXiv e-prints:1004.5349 [23] Huang X., et al., 2009, ApJL, 707, L12 [24] Jee M. J. a., 2009, ApJ, 704, 672 [25] Jenkins A., et al., 2001, MNRAS, 321, 372 [26] Jimenez R., Verde L., 2009, PRD, 80, 127302 [27] Komatsu E., et al 2009, in astro2010: The Astronomy and Astrophysics Decadal Survey Vol. 2010 of Astronomy, Non-Gaussianity as a Probe of the Physics of the Primordial Universe and the Astrophysics of the Low Redshift Universe. pp 158–+ [28] Komatsu E., other 2011, ApJS, 192, 18 [29] Komatsu E., Seljak U., 2002, MNRAS, 336, 1256 [30] Komatsu E., Spergel D. N., 2001, PRD, 63, 063002 [31] Lo Verde M., Miller A., Shandera S., Verde L., 2008, JCAP, 4, 14 [32] Lueker M., et al., 2010, ApJ, 719, 1045 [33] Maggiore M., Riotto A., 2010, Astrophys. J., 717, 526 [34] Mandelbaum R., Seljak U., Baldauf T., Smith R. E., 2010, MNRAS, 405, 2078 [35] Matarrese S., Verde L., Jimenez R., 2000, ApJ, 541, 10 [36] Maughan B. J., et al., 2008, MNRAS, 387, 998 [37] Mei S., et al., 2009, ApJ, 690, 42 [38] Mortonson M. J., Hu W., Huterer D., 2011, PRD, 83, 023015 [39] Muchovej S., et al., 2007, ApJ, 663, 708 [40] Mullis C. R., Rosati P., Lamer G., B¨ ohringer H., Schwope A., Schuecker P., Fassbender R., 2005, ApJL, 623, L85 [41] Navarro J. F., Frenk C. S., White S. D. M., 1996, ApJ,
11
[42] [43] [44] [45] [46] [47] [48] [49] [50] [51] [52] [53]
462, 563 Perlman E. S., et al., 2002, ApJS, 140, 265 Pierre M., Consortium T., 2001, pp 185–+ Press W. H., Schechter P., 1974, ApJ, 187, 425 Refregier A., Amara A., Kitching T., Rassat A., 2008, ArXiv e-prints:0810.1285 Romer A. K., Viana P. T. P., Liddle A. R., Mann R. G., 1999, ArXiv astro-ph/9911499 Rosati P., et al., 2009, Astron. & Astrophys., 508, 583 Salopek D. S., Bond J. R., 1990, PRD, 42, 3936 Sartoris B., Borgani S., Fedeli C., Matarrese S., Moscardini L., Rosati P., Weller J., 2010, MNRAS, 407, 2339 Sheth R. K., Mo H. J., Tormen G., 2001, MNRAS, 323, 1 Slosar A., Hirata C., Seljak U., Ho S., Padmanabhan N., 2008, JCAP, 8, 31 Stott J. P., et al., 2010, ApJ, 718, 23 Sunyaev R. A., Zeldovich Y. B., 1972, Comments on As-
trophysics and Space Physics, 4, 173 [54] Tanaka M., Finoguenov A., Ueda Y., 2010, ApJL, 716, L152 [55] Tinker J., et al., 2008, ApJ, 688, 709 [56] Verde L., 2010, Advances in Astronomy, 2010 [57] Verde L., Wang L., Heavens A., Kamionkowski M., 2000, MNRAS, 313, 141 [58] Wagner C., Verde L., Boubekeur L., 2010, JCAP, 10, 22 [59] Xia J.-Q., et al., 2010, JCAP, 1008, 013 [60] Yadav A. P. S., Wandelt B. D., 2008, Physical Review Letters, 100, 181301 [61] http://www.icosmo.org/ [62] Subsequently, [13] showed that our results are robust to the choice of mass function for the lower bounds placed on fNL reported here. [63] http://cow.physics.wisc.edu/∼craigm/idl/idl.html