Mar 2, 2005 - March 2005 http://statistik.wu-wien.ac.at/ ... Swinnen, Vanhoof, and Wets, 2004), personalized product recommendations (Lawrence, Almasi,.
Implications of Probabilistic Data Modeling for Rule Mining Michael Hahsler, Kurt Hornik, Thomas Reutterer
Department of Statistics and Mathematics Wirtschaftsuniversität Wien Research Report Series Report 14 March 2005
http://statistik.wu-wien.ac.at/
Implications of Probabilistic Data Modeling for Rule Mining Michael Hahsler
Kurt Hornik Wirtschaftsuniversit¨at Wien
Thomas Reutterer
March 2, 2005 Abstract Mining association rules is an important technique for discovering meaningful patterns in transaction databases. In the current literature, the properties of algorithms to mine associations are discussed in great detail. In this paper we investigate properties of transaction data sets from a probabilistic point of view. We present a simple probabilistic framework for transaction data and its implementation using the R statistical computing environment. The framework can be used to simulate transaction data when no associations are present. We use such data to explore the ability to filter noise of confidence and lift, two popular interest measures used for rule mining. Based on the framework we develop the measure hyperlift and we compare this new measure to lift using simulated data and a real-world grocery database.
Keywords: data mining, transaction data model, association rules, interest measures.
1
Introduction
Mining association rules (Agrawal, Imielinski, and Swami, 1993) is an important technique for discovering meaningful patterns in transaction databases. An association rule is a rule of the form X ⇒ Y , where X and Y are two disjoint sets of items (itemsets). The rule means that if we find all items in X in a transaction it is likely that the transaction also contains the items in Y . A typical application of mining association rules is market basket analysis where point-ofsale data is mined with the goal to discover associations between articles. These associations offer useful and actionable insights to retail managers for product assortment decisions (Brijs, Swinnen, Vanhoof, and Wets, 2004), personalized product recommendations (Lawrence, Almasi, Kotlyar, Viveros, and Duri, 2001), and from adapting promotional activities to shelving. For web-based systems (e.g., e-shops, digital libraries, search engines) associations found between articles/documents/web pages in transaction log files can even be used to automatically and continuously adapt the user interface by presenting associated items together (Lin, Alvarez, and Ruiz, 2002). Association rules are selected from the set of all possible rules using measures of statistical significance and interestingness. Support, the primary measure of significance, is defined as the fraction of transactions in the database which contain all items in the rule. For association rules, a minimum support threshold is used to select the most frequent (and hopefully important) item combinations called frequent itemsets. The process of finding these frequent itemsets in a large database is computationally very expensive since it involves searching a lattice which grows in the worst case exponentially in the number of items. In the last decade research has centered on solving this problem and a variety of algorithms were introduced which render search feasible by exploiting various properties of the lattice (see Goethals and Zaki (2004) as a pointer to the currently fastest algorithms). From the most chosen itemsets rules are generated using measures of interestingness. Numerous measures were suggested in the literature. For association rules, the measure confidence was developed (Agrawal et al., 1993). A practical problem is that often too many association rules are
1
time 0 Tr1 Tr2
Tr2
Tr3Tr4
Trm-2
Trm-1 Trm t
Figure 1: Transactions occurring over time following a Poisson process. produced. In this case, additional interest measures, such as e.g. lift, can be used to further filter or rank found rules. In this paper we will start with modeling transaction data. We will present a simple probabilistic framework for transaction data which is based on independent Bernoulli trials. Using this framework, we will present a small probabilistic data modeling exercise for transaction data and show the implications of this exercise for support, confidence and lift. Based on the findings from the framework we will develop a new interest measure called hyperlift and compare its performance on simulated data and a real-world grocery database. The paper is structures as follows: The next section develops the probabilistic framework. In sections 3 and 4 we investigate the implications of the framework for the interest measures confidence and lift. In section 5 we develop the measure hyperlift. Finally, section 6 compares lift and hyperlift on real-world data.
2
A simple probabilistic framework for transaction data
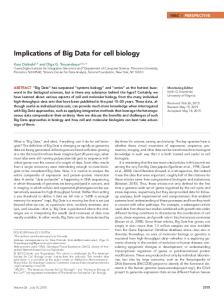
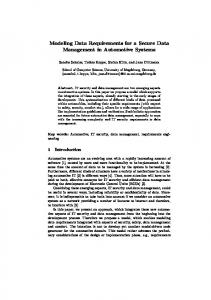
A transaction database consists of a series of transactions where each transaction contains a subset of the available items. We analyze transactions which are recorded in a fixed time interval of length t. In figure 1 an example time interval is shown as an arrow with markings at the points in time when the transactions denoted by T r1 to T rm occur. We assume that transactions occur randomly following a (homogeneous) Poisson process with parameter θ. The number of transactions m in the time interval is then Poisson distributed with parameter θt: e−θt (θt)m (1) m! We denote the items which occur in the database by L = {l1 , l2 , . . . , ln } with n being the number of different items. For the framework we assume that all items occur independently of each other and that for each item li ∈ L there exists a fixed probability pi of being contained in a transaction. Each transaction is then the result of n independent Bernoulli trials, one for each item with success probabilities given by the vector p = (p1 , p2 , . . . , pn ). Figure 2 contains the typical representation of an example database as a binary incidence matrix with one column for each item. Each row labeled Tr 1 to Tr m contains a transaction, where a 1 indicates presence and a 0 indicates absence of the corresponding item in the transaction. Additionally, the success probability for each item is given in an additional row labeled p and the row labeled c contains the number of transactions each items is contained in (sum of the ones per column). Following the model, ci , the observed number of transactions item li is contained in, can be interpreted as a realization of a random variable Ci . Under the condition of a fixed number of transactions m this random variable has a binomial distribution. � � m ci P (Ci = ci |M = m) = p (1 − pi )m−ci (2) ci i P (M = m) =
However, since for a fixed time interval the number of transactions is not fixed, the uncondi-
2
items l1 p
l3
...
ln
0.005 0.01 0.0003 ... 0.025
Tr1 Tr2
0 0
1 1
0 0
... ...
1 1
Tr3
0
1
0
...
0
Tr4 . . . Trm-1 Trm
0 . . . 1 0
0 . . . 0 0
0 . . . 0 1
...
... ...
0 . . . 1 1
c
99
201
7
...
411
.
transactions
l2
. .
Figure 2: Example transaction database with success probabilities p and transaction counts per item c. tional distribution gives:
P (Ci = ci ) = =
∞ X m=ci ∞ X m=ci
=
P (Ci = ci |M = m) · P (M = m) � � m ci e−θt (θt)m pi (1 − pi )m−ci ci m!
∞ e−θt (pi θt)ci X ((1 − p)θt)m−ci ci ! (m − ci )! m=c
(3)
i
−pi θt
=
e
ci
(pi θt) ci !
The sum term in the last but one line in equation 3 is an exponential series with the limiting sum e(1−pi )θt . With this it is easy to show that the unconditional probability distribution of each Ci has a Poisson distribution with parameter pi θt. For short we will use λi = pi θt and introduce the parameter vector λ = (λ1 , λ2 , . . . , λn ) of the Poisson distributions for all items. This parameter vector can be calculated from the success probability vector p and vice versa by the linear relationship λ = pθt where θ is the intensity with which transactions occur and t is the length of the observed time interval. For a given database, the values of the parameter θ and the success vectors p or alternatively λ are unknown but can be estimated from the database. The best estimate for θ from a single database is m/t. The simplest estimate for λ is to use the observed counts for each item. However, this is only a very rough estimate which especially gets unreliable for small counts. There exist more sophisticated estimation approaches. For example, DuMouchel and Pregibon (2001) use the assumption that the parameters of the count processes for items in a database are distributed according to a continuous parametric density function. This additional information can improve estimates over using just the observed counts. DuMouchel and Pregibon use the mixture of two gamma distributions as the distribution for the parameters for their analysis of international calling behavior. For simplicity we assume for the following simulation that the parameters in λ are chosen from a single gamma distribution. The gamma distribution is a very flexible distribution which allows to fit a wide range of empirical data and the resulting Poisson-Gamma mixture model has applications in many fields including related problems in market research (Johnson, Kotz, and Kemp, 1993). We will simulate the counts ci , for n = 200 different items over a t = 30 day period 3
with transaction intensity θ = 300 (theta in the code) transactions per day. For the gamma distribution we use the parameters k = 0.75 and a = 250. First, we choose the number of transactions m in time interval t from a Poisson distribution with parameter θt. > m m [1] 8885 Next, we generate the parameter vector p by drawing values for the n λi from the gamma distribution and transform them into probabilities pi by dividing by the database size m. For better visualization later on, we sort the items by probability so that pi ≥ pi+1 for i = 1, 2, . . . , (n − 1). > p Tr c supp1 summary(supp1) Min. 1st Qu. 0.0000 0.0063
Median 0.0154
Mean 3rd Qu. 0.0243 0.0323
Max. 0.1640
> plot(supp1, type = "h", xlab = "items", ylab = "support") The summary statistics of support over all 1-itemsets show that there is a significant difference between the mean and the median. This indicates a skewed count distribution. The count distribution of the simulated counts ci is presented in the plot in figure 3. As typical for transaction data, only few items have a relatively high support while most items appear rather infrequently. The number of items which appear in the database 0, 1, 2, . . . times in a Poisson-Gamma mixture model follows a Negative Binomial distribution with the parameters determined by the parameters of the gamma mixing distribution. The Negative Binomial distribution can be used to predict the expected number of items which are more frequent than a set minimum support. > h plot(c(0:(length(h$counts) - 1))/m, y = n - cumsum(h$counts), + type = "l", xlab = "minimum support", ylab = "frequent items") > lines(x = c(0:max(c))/m, (1 - cumsum(dnbinom(c(0:max(c)), size = k, + prob = 1/(1 + a)))) * n, col = "red", lty = 2)
4
Figure 3: Simulated item support.
Figure 4: Plot of frequent items by minimum support.
5
Figure 5: Simulated 2-itemset support In figure 4 we show the number of frequent items in the database depending on the used minimum support. The dashed line represents the number of items expected using the Negative Binomial Distribution. Next, we extend the framework to the occurrences of 2-itemsets which corresponds to cooccurrences of two items in transactions in the database. The counts for the 2-itemsets can be represented by a n × n matrix where each cell ci,j contains the co-occurrence count for two items i, j ∈ L. The n × n matrix is symmetric with ci,j = cj,i and the diagonal with i = j contains the counts of the individual items. We can calculate the values ci,j from the database by counting the number of transactions for each item combination in the n × n co-occurrence matrix (denoted by c2 in the code). We discard the counts in the diagonal where i = j since by definition itemsets cannot contain the same item more than once. Using the counts we can calculate the support values of all 2-itemsets. > + + > > >
c2 persp(conf2, expand = 0.5, ticktype = "detailed", border = 0, + shade = 1, zlab = "confidence", xlab = "items", ylab = "items") The summary shows that confidence values are generally very low which reflect the fact that there are no associations in the data. However, the maximum indicates some rules with confidence of one. The plot in figure 6 shows that confidence increases with the item in the right-hand-side 7
of the rule getting more frequent and the item in the left-hand-side getting less frequent. This behavior directly follows the way confidence is calculated. But the fact that confidence clearly favors some rules makes the measure problematic when it comes to ranking rules by their interest.
4
Implications for the interest measure lift
Typically, rules mined using minimum support (and confidence) are filtered or ordered using their lift value. The measure lift (also called interest (Brin, Motwani, Ullman, and Tsur, 1997)) is defined on rules of the form X ⇒ Y as lift(X ⇒ Y ) =
P (Y ∪ X) P (Y |X) = , P (X)P (Y ) P (Y )
(6)
where X and Y are two disjoint itemsets. P (Y ∪ X) is the probability that all items in X and Y appear together in transactions. The product of the individual probabilities P (X)P (Y ) represents the expected probability for finding the items in X and Y together in transactions if they occur independently given their observed individual probabilities. To calculate lift, confidence and support values are normally used as estimates for the probabilities resulting in lift(X ⇒ Y ) =
conf(X ⇒ Y ) supp(Y )
(7)
A lift value of 1 indicates that the items are co-occurring in the database as expected under independence. Values greater than one indicate that the items are associated. For marketing applications it is generally argued that lif t � 1 indicates complementary products and lif t � 1 indicates substitutes. For the rules generated from 2-itemsets, lift can be directly calculated from the already computed confidence and support values. > lift summary(as.vector(lift)) Min. 1st Qu. 0.000 0.000
Median 0.817
Mean 3rd Qu. Max. NA's 0.987 1.240 159.000 994.000
> persp(lift, expand = 0.5, ticktype = "detailed", border = 0, + shade = 1, zlab = "lift", xlab = "items", ylab = "items") > length(which(lift > 2)) [1] 3424 Interestingly, although the data do not contain associations, many zeros and some extremely high lift values are found. For example, 3424 rules are found with a lift greater than 2. For diagnostics we visualize the lift values in figure 7. The plot shows that many zeros and the highest lift values are achieved for rare items (in the plot in the back right-hand corner). These lift values are artifacts which result for items with very low counts. The product of the probabilities for such rare items is close to zero and if such items co-occur together once by chance, an extremely high lift will result. To counter this problem. for most applications a minimum support threshold is used to filter all itemsets and thus also rules which do not appear in the database frequently enough to be of interest. We discard all 2-itemsets which do not satisfy a minimum support of 0.1%. > min_supp length(lift[supp2 >= min_supp]) [1] 7096 8
Figure 7: Lift for 2-itemsets in the simulated data set.
Figure 8: Lift for 2-itemsets using a minimum support of 0.5%. > summary(lift[supp2 >= min_supp]) Min. 1st Qu. 0.462 0.918
Median 1.060
Max. NA's 3.690 200.000
Mean 3rd Qu. 1.120 1.250
> lift[supp2 < min_supp] persp(lift, expand = 0.5, ticktype = "detailed", border = 0, + shade = 1, zlab = "lift", xlab = "items", ylab = "items") > length(which(lift > 2)) [1] 130 Requiring support leaves 7096 rules. The summary statistics show that most supported rules have now a lift value around 1, the value which indicates that no associations are NA but there are still 130 rules with a lift greater than 2. The plot in figure 8 clearly shows lift’s tendency to produce higher values for rules containing one or two less frequent items. This indicates that the lift measure performs poorly to filter random noise in transaction data especially if we are also interested in relatively rare items. Furthermore, if lift is used to rank discovered rules, there is a systematic tendency towards favoring rules with less frequent items.
9
5
Developing the measure hyperlift
In this section we will show how the knowledge that the co-occurrence counts of independent items can be seen as realizations of hypergeometric distributed random variables with known parameters can be used to better filter random noise. The expected value of a random variable C with a hypergeometric distribution is E[C] = kw/(w + b),
(8)
where the parameter k represents the number of tries, w is the number of white balls, and b is the number of black balls. Applied to co-occurrence counts for the two items li and lj in a transaction database this gives E[Ci,j ] = ci cj /m, (9) where m is the number of transactions in the database. With using ci /m as an estimate for P (li ) we can rewrite lift as P (li + lj ) ci,j = (10) lift(li ⇒ lj ) = P (li )P (lj ) E[Ci,j ] For items with a relatively high occurrence frequency using the expected value for lift works well. However, for relatively infrequent items, which are the majority in most transaction databases, using the ratio of the observed count to the expected value is problematic. For example, let us assume that we have the two independent items li and lj , and both items have a support of 1% in the database. Then, E[Ci,j ] is: > c_i c_j c_i * c_j/m [1] 0.8885 However, if we choose randomly there is a P [Ci,j > 1] of > phyper(1, m = c_j, n = m - c_j, k = c_i, lower.tail = FALSE) [1] 0.224 Therefore there is a substantial chance that we will see a lift value of 2, 3 or even higher. Given the huge number of itemsets and rules generated by combining items (especially when also considering itemsets containing more than one item), this is very problematic. Using larger databases with more transactions reduces the problem, however, there are several drawbacks of very large databases. Some drawbacks are: They are more time-consuming to mine which might lead to the need to sample transactions (e.g., Mannila, Toivonen, and Verkamo (1994)). However, using a sampled database suffers again from the problem shown above. They are usually collected over a long period of time and thus may contain outdated information. For example, in a supermarket the articles offered may have changed.
To address the problem, we adapt lift by using instead of the expected value E[CX,Y ], where X and Y are itemsets, a quantile denoted by δ of the hypergeometric distribution. For the quantile Qδ [CX,Y ] we have P r(CX,Y ≤ Qδ [CX,Y ]) = δ. We call the resulting measure hyperlift, which we define as hyperlift(X ⇒ Y ) =
cX,Y . Qδ [CX,Y ]
(11)
In the following we will use δ = 0.99 which results in hyperlift being more conservative compared to lift. The measure can be interpreted as the number of times the observed co-occurrence count 10
Figure 9: Hyperlift for 2-itemsets in the simulated data set. cX,Y is higher than the highest count we expect 99% of the time. This means, that hyperlift for a rule with independent items will exceed 1 only in 1% of the cases, and then only slightly. Next, we calculate hyperlift with δ = 0.99 for the simulated database. > + + > > >
calc_hyperbase persp(supp2, shade = 1, expand = 0.5, ticktype = "detailed", + border = 0, zlab = "support", xlab = "items", ylab = "items") > conf2 summary(as.vector(conf2)) Min. 0.0000
1st Qu. 0.0000
Median 0.0140
Mean 0.0412
3rd Qu. 0.0516
Max. NA's 1.0000 169.0000
> persp(conf2, shade = 1, expand = 0.5, ticktype = "detailed", + border = 0, zlab = "confidence", xlab = "items", ylab = "items") The summary statistics of support and the plot in figure 10 show that the grocery database contains items with a similarly skewed count distribution as the simulated data set used above. Both have an almost identical mean and median. Also the distributions of the 2-itemset support and confidence in figures 11 and 12 exhibit a similar form as the simulated data. However, both measures have a large number of combinations which reach several times higher values than in the simulated data (compare figures 11 and 12 with 5 and 6 above). This indicates that the grocery database contains associated items. Next, we calculate the lift measure. 12
Figure 11: 2-itemset support in the grocery database.
Figure 12: 2-itemset confidence in the grocery database.
13
> lift summary(as.vector(lift)) Min. 1st Qu. 0.00 0.00
Median 1.23
Mean 3rd Qu. 1.78 2.07
Max. 224.00
NA's 169.00
> persp(lift, expand = 0.5, ticktype = "detailed", border = 0, + shade = 1, zlab = "lift", xlab = "items", ylab = "items") > length(which(lift > 2)) [1] 7544 The database contains 7544 rules with a lift greater than 2. Figure 13 shows that, as before, the rules with the least frequent items have the highest lift values. To assess the usefulness of the rules found by lift, we inspect the itemsets with the highest lift values. Since lift is a symmetric measure each line in the list actually represents the 2 rules li ⇒ lj and lj ⇒ li . > > > + > + >
lift.lower summary(lift[supp2 >= min_supp]) Min. 1st Qu. 0.311 1.300 > > > + >
Median 1.620
Mean 3rd Qu. 1.770 2.030
Max. NA's 13.000 169.000
lift.supp > > + > + >
lift.lower >
calc_hyperbase