International Conference on Robotics and Artificial Intelligence (ICRAI2016) April 20-22, 2016 | Los Angeles, USA
Improve Accuracy of Early Detection Sudden Cardiac Deaths (SCD) Using Decision Forest and SVM Seyyed Rohollah Mirhoseini Department of Computer Engineering Iran University of Science &Technology Tehran, Iran
[email protected]
Mohammad Reza JahedMotlagh Department of Computer Engineering Iran University of Science &Technology Tehran, Iran
Mohammad Pooyan Department of Biomedical Engineering Shahed University
Tehran, Iran Abstract— Investigations show that millions of people all around the world die as the result of sudden cardiac death (SCD). There are several methods to early detection sudden cardiac deaths in machine learning. We need to propose suitable ways to improve accuracy of these methods. In this paper used Decision Forest algorithm for improve accuracy. Keywords: Sudden Cardiac Arrest, ECG, QRS, HRV, Machine learning, SVM , Classification and Accuracy
Frequency feature and Non-Linear feature. In this paper used 22 feature of these feature HRV signal. We obtain importance feature with Tree Bagger Classifier algorithm. Importance feature obtain from Tree Bagger Classifier used input for SVM classifier for detection Sudden Cardiac Deaths. First accuracy of SVM is 70.90 and with important features are 83.24. Thus improve accuracy of SVM Classifier with Tree Bagger algorithm. II.
I.
INTRODUCTION
Sudden Cardiac Death is natural death from cardiac causes, heralded by abrupt loss of consciousness within one hour of the onset of acute symptoms [1]. When this occurs, no blood can be pumped to the rest of the body within minutes in a person with known or unknown cardiac disease [2]. Sudden cardiac death affects 236000–325000 people in the USA and 350000–700000 people in Europe each year [3]. Therefore, it is important to identify those at risk of SCD if preventive measures are to be implemented [3]. Analysis of heart rate variability (HRV) has provided a non-invasive method for assessing cardiac autonomic control [1]. HRV is accepted as a strong and independent predictor of mortality after an acute myocardial infarction, such that a reduced HRV is associated with a higher risk for severe ventricular arrhythmia and sudden cardiac death [1]. There are several feature present for HRV signal such Time Domain feature, Frequency Domain feature, Time-
MATERIALS AND METHODS
The proposed method is evaluated on a database containing ECG signals from 19 patients with sudden cardiac death (with a sampling rate of 256 Hz) and 18 normal people (with a sampling rate of 128 Hz). This open access database is prepared by MITBIH database with the title of Sudden Cardiac Death Holter database and Normal Sinus Rhythm database [4]. SCD data recordings were mainly obtained in the 1980s in Boston area hospitals, and were later compiled as part of a study of ventricular arrhythmias. III.
PREPROCESSING
First we split one minute interval (i.e., the first one minute befor SCD) of SCD signal. For normal subjects one minute of the ECG signal was selected at random. Then remove noise of ECG signals. According PanTompkins algorithm is best algorithm for detect QRS complex [5], we extract QRS complex of ECG signal from this algorithm.
International Conference on Robotics and Artificial Intelligence (ICRAI2016) April 20-22, 2016 | Los Angeles, USA
The Pan and Tompkins algorithm was a major breakthrough at the time of its publication. Furthermore it is the most cited paper (more than 850 times) related with QRS detection [5].
IV.
FEATURE OF HRV
In this paper we used Time Domain, Frequency Domain, Time-Frequency and Non-Linear method for extract feature. A. Time Domain Feature Popular feature in Time Domain is MNN (Mean of all NN intervals), SDNN (Standard deviation of all NN intervals), RMSSD (Root Mean square of the difference of successive RR intervals), SDSD (Standard Deviation of differences between adjacent NN intervals) and PNN50 (50 ms by the total Number of NN intervals).
Figure 1. A graphical representation of PT algorithm.
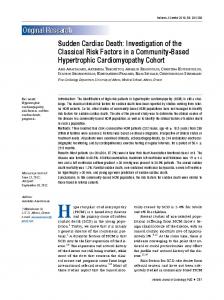
An overview of the algorithm follows. Figure 1 shows a graphical representation of the basic steps of the algorithm. The signal passes through filtering, derivation, squaring, and integration phases before thresholds are set and QRS complexes are detected[6]. Figure 2 and 3 show QRS complex of Normal and SCD. Since R is a point corresponding to the peak of the QRS complex of the ECG and RR is the interval between successive Rs, After implement Pan-Tompkins algorithm determine the RR-intervals and HRV signal.
Figure 2. Extract of QRS complex from Normal signal.
SDNN = RMSSD =
B. Frequency Domain Feature The feature of frequency domain are spectral power in the high and low and VLF (Very Low frequency) frequency band of the RR intervals. The ratio of the LF (0.04–0.15 Hz), and HF (0.15–0.4 Hz) bands power spectral density (LF/HF) are used as the frequency domain features of the RR interval signal. C. Time-Frequency Feature Since Smoothed Pseudo Wigner-Ville distribution (SPWVD) provides better time frequency resolution than nonparametric linear methods, an independent control of time and frequency filtering, and power estimates at lower variance with parametric methods when rapid changes occur[1], we chosen SPWVD for detect TF Feature. Then obtained signal in TF domain is also divided into three frequency segments and achieve these feature:
Figure 3. Extract of QRS complex from SCD.
EVLF : the total energy of signal in very low frequency band. ELF : the total energy of signal in low frequency band . EHF : the total energy of signal in high frequency band . FVLF : the average of energy signal in very low frequency band.
International Conference on Robotics and Artificial Intelligence (ICRAI2016) April 20-22, 2016 | Los Angeles, USA
FLV : the average of energy signal in low frequency band. FHF : the average of energy signal in high frequency band .
Also divided TF to 5 segments of equal length and average energy of each segment was computed. Another feature: MAXw: maximum amount of energy in each window. MINw: minimum amount of energy in each window. DIFw: difference between maximum and minimum amount of energy between windows. STDw: standard deviation between energy of time windows.
D. Non_Linear Feature We used Poincare´ plot for extract non-linear feature. Poincare´ plot is a graphical representation of the correlation between the successive RR intervals (each interval RR(n+1) is plotted as a function of previous interval RR(n)). This plot can be quantitatively analyzed by calculating the standard deviations of the distances of the points RR(i) from the lines y=x and y =2x +2RRm, where RRm is the mean of all RR(i) values[1]. Figure 4 show Poincare' Plot that represent Non-Linear Feature. These standard deviations are denoted by SD1 and SD2, respectively. The ratio SD1/SD2 is usually used to describe the relation between the two components. Then SD1,SD2 and SD1/SD2 are three feature in non-linear.
Number Feature Accuracy
Of
With 22 70.90
With 12 (important) 83.24
Figure 5. Compare accuracy of classification.
Accuracy of SVM classification with important features is 83.24 while accuracy of classification with 22 features is 70.90. We used Radial Basis Function (RBF) Kernel, 10-Fold cross validation and Least squares for SVM. Figure 5 show compare accuracy of classification with and without important feature.
VI.
RESULTS AND DISCUSSION
For evaluation of method we obtain accuracy, sensitivity, specificity, Positive Predicative and Negative Predicative that TP refers to true positives (correctly predicted SCD), TN refers to true negatives (correctly predicted non-SCD), FN refers to false negatives (incorrectly predicted non-SCD) and FP refers to false positives (incorrectly predicted SCD). Accuracy: proportion of correct predictions to the total Predictions. The value is defined as:
Specificity: proportion of true negatives to the total negatives. The value is defined as:
Positive Predicative (Precision): proportion of predicted positive cases that were correct. The value is defined as:
Negative Predicative: This value is defined as:
Figure 4. Poincare' Plot that represent Non-Linear Feature.
V.
IMPORTANT FEATURE AND CLASSIFICATION
Using the obtained features from Time, Frequency, Time-Frequency and Nonlinear Processing, brings a good separability between two classes (i.e., Healthy people and People at risk of SCD).
After obtained features we should reduction feature for improve accuracy. In this paper used Tree Bagger for find best feature. Tree Bagger ensembles have more functionality that give out important feature. Therefor Tree Bagger Offer 12 feature of 22 feature presented. MNN, PNN50, spectral power in HF and LF and VLF, ratio of LF/HF, SD1,SD2, MAXw, MINw, STDw and FVLF are achieved.
Figure 6 show other output of classification. Accuracy
Specificity
83.24
89.5
Positive Predicative 87.5
Negative Predicative 81
Figure 6. Result of classification.
As can be seen, accuracy of classification after obtaining the best features are improved. May be other ways to calculate better Features or other machine learning method provide better accuracy.
International Conference on Robotics and Artificial Intelligence (ICRAI2016) April 20-22, 2016 | Los Angeles, USA
In our method we can detection Sudden Cardiac Deaths by important feature. The accuracy of classification is 83.24.
[4]
REFERENCES [1]
[2]
[3]
Elias Ebrahimzadeh, Mohammad Pooyan and Ahmad Bijar, “A Novel Approach to Predict Sudden Cardiac Death (SCD) Using Nonlinear and Time-Frequency Analyses from HRV Signals,” PLoS ONE 9(2): e81896. doi:10.1371/journal. pone.0081896, Published February , 2014. Tsu-Wang. Shen1, Hsiao-Ping Shen, Ching-Heng Lin, and YiLing Ou, “Detection and Prediction of Sudden Cardiac Death (SCD) For Personal Healthcare,” Proceedings of the 29th Annual International Conference of the IEEE EMBS Cité Internationale, Lyon, France August 23-26, 2007. Elsayed Z Soliman1, Ronald J Prineas, L Douglas Case,
Gregory Russell, Wayne Rosamond, Thomas Rea, Nona Sotoodehnia, Wendy S Post, David Siscovick, Bruce M Psaty, and Gregory L Burke,“Electrocardiographic and clinical
[5]
[6]
predictors separating atherosclerotic sudden cardiac death from incident coronary heart disease,” NIH Public Access, Heart. Author manuscript; available in PMC 2013 April 29 . Goldberger AL, Amaral LA, Glass L, Hausdorff JM, Ivanov PC, et al. (2000) PhysioBank, PhysioToolkit, and PhysioNet: Components of a New Research Resource for Complex Physiologic Signals. Circulation 101(23):e215–e220 [Circulation Electronic Pages. Available: http://circ.ahajournals.org/cgi/content/full/101/23/e215; 2000 June 13. Ra'ul Alonso Alvarez, “A comparison of three QRS detection algorithms over a public database,” Preprint submitted to Elsevier May 13, 2013.
C.Pavlatos, A.Dimopoulos, G. Manis and G.Papakonstantinou, “HARDWARE IMPLEMENTATION OF PAN & TOMPKINS QRS DETECTION ALGORITHM1,” This work is co - funded by the European Social Fund and particularly the Program “Pened 2003”.
South Asia Institute of Science and Engineering
Acceptance Notification and Invitation Letter 2016 2nd International Conference on Robotics and Artificial Intelligence (ICRAI 2016) Los Angeles, USA, April 20-22, 2016 www.icrai.org
Seyyed Rohollah Mirhoseini, Mohammad Reza Jahed Motlagh, Mohammad Pooyan Iran University of Science &Technology, Iran Email:
[email protected] Dear Seyyed Rohollah Mirhoseini, Mohammad Reza Jahed Motlagh, Mohammad Pooyan, We are pleased to inform you that, after our double-blind peer review (please refer to the attached files), your manuscript identified below has been accepted for publication and oral presentation by 2016 2nd International Conference on Robotics and Artificial Intelligence (ICRAI2016) to be held in Los Angeles, USA during April 20-22, 2016. Paper ID:
RAI2016-3032
Paper Title:
Improve Accuracy of Early Detection Sudden Cardiac Deaths (SCD) Using Decision Forest and SVM
After a careful reviewing process, your accepted papers that are registered and presented will be published in International Journal of Electronics and Electrical Engineering (IJEEE ISSN: 2301-380X). Abstracting/Indexing: Ulrich's Periodicals Directory, Google Scholar, Crossref, Engineering & Technology Digital Library, etc. More information can be found through: http://ijeee.net/
Yours sincerely, ICRAI 2016 Organizing Committees March 2, 2016
1/2