part is a sound of âsurfâ, describes a gradually approaching ocean wave ..... (8) is the in harmonicity modification factor [10], and is set as. 0.0005 in experiments.
IMPROVE AUDIO REPRESENTATION BY USING FEATURE STRUCTURE PATTERNS* Rui Cai†, Lie Lu‡, Hong-Jiang Zhang‡, and Lian-Hong Cai† Department of Computer Science and Technology, Tsinghua University, Beijing, 100084, China ‡ Microsoft Research Asia, 5/F Sigma Center, 49 Zhichun Road, Beijing, 100080, China
Although statistical characteristics of audio features are widely used for audio representation in most of current audio analysis systems and have been proved to be effective, they only utilized the average feature variations over time, and thus lead to ambiguities in some cases. Structure patterns, which describe the representative structure characteristics of both temporal and spectral features, are proposed to improve audio representation. In this paper, three kind structure patterns, including energy envelope pattern, sub-band spectral shape pattern and harmonicity prominence pattern, are proposed or refined, as successive development of our previous work [1]. Evaluations on a content-based audio retrieval system with more than 1500 clips showed very encouraging results.
statistical features of them are not as similar as expected. For example, the right one has higher spectrum energy, especially in high-frequency band; and its energy is uniformed distributed in temporal domain, which makes the derivative much smaller. It results in evident difference of them under current audio representation system. 11000 10000 9000
11000 10000 9000
8000
8000
7000
7000
6000
6000
5000
5000
4000
Frequ ency (Hz)
ABSTRACT
F requ ency (Hz)
†
4000
3000
3000
2000
2000 Time (s)
1000
0.5
1
1.5
2
2.5
Time (s) 3
1000
1
2
3
4
5
6
7
10000
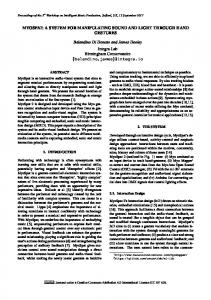
Precise and effective representation of sound object is the essential basis for content-based audio analysis, such as audio classification [2], audio retrieval [3] and audio scene analysis [4]. In most of current audio analysis systems, audio representation is mainly based on statistical characteristics of the temporal and spectral features of each frame; and the statistics, including mean, standard deviation or covariance, are used to describe the properties of an audio clip. Although statistical features have proved their effectivity in many previous works, they only utilized the averaged feature variations over time, but ignored the detail status in each time slot or frequency band and the variation pattern of each feature, and thus lead to ambiguities in some cases. For instance, Fig. 1 (a) illustrates two different sounds which have a similar representation based on their statistical characteristics only. The left part is spectrogram and energy envelope of a sound of “car crash”, it is a sudden bang followed by a series of decrescendo effects of things broken. The right part is a sound of “surf”, describes a gradually approaching ocean wave which finally impacts the coast. Although these two sounds are absolutely different from human perception, they have very similar statistical characteristics of both temporal and spectral features, such as short time energy, zero crossing rate, and spectral centroid. On the other side, only using statistical features in audio representation may also make two audio clips of the same sound different. Fig. 1(b) shows such an example, where both the left and right are sounds of “motor engine”, which describe the engine ignition process of motorcars. The
9000
11000 10000 9000
8000
8000
7000
7000
6000
6000
5000
5000
4000
4000
3000
Frequ ency (Hz)
11000
F requency (Hz)
(a) car crash (left) and surf (right)
1. INTRODUCTION
3000
2000
2000 Time (s)
1000
0.2
0.4
0.6
0.8
1
1.2
1.4
1.6
1.8
Time (s) 1000
1
2
3
4
5
6
(b) two samples of sound “motor engine”
Fig. 1. Illustration of some sound effects (a) different sounds with similar statistical features; (b) similar sounds with different statistical features To complement the disadvantages that statistical-based representation only describes the average information, feature structure patterns are proposed to improve audio representation. Feature structure pattern means the representative pattern which describes structure characteristics of both temporal and spectral features, such as the energy envelope and harmonicity pattern. Psychophysical researches [5] have indicated that these patterns act an important role in human perception of sound objects. For instance, the pattern of energy envelope can help to distinguish sounds illustrated in Fig. 1(a), where the envelope of “car crash” has a rapid attack and gradual drop, while that of the “surf” rise slowly but decay rapidly; for the sounds in Fig. 1(b), the dominant spectral shapes, shown at right side of corresponding spectrograms, are highly similar with each other. These figures clearly indicate that audio representation can be improved by using such structure patterns. Following our previous work [1], some improvements on structure pattern extraction are presented in this paper. Besides refinements of energy envelope and
*
This work was performed when the first author was a visiting student in Media Computing Group, Microsoft Research Asia
�����������������������������,(((
,9������
,&$663�����
harmonicity patterns, a new sub-band spectral shape pattern is also introduced to give more detail description of spectral characteristics. The rest of this paper is organized as follows. The improvement on energy envelope pattern is presented in Section 2. The new sub-band spectral shape pattern and current harmonicity description are introduced in Section 3. In Section 4, experiments and evaluations are given.
each representative pattern, instead of just using a pattern label as the previous method did. (3) E S = [ D w ( S , a ), D w ( S , b), D w ( S , c ), D w ( S , d ), D w ( S , e)] where Es is the energy envelope pattern vector of audio segment S, Dw is the L2 distance between two energy envelopes in wavelet coefficient space. Experiment in section 4 will show the efficiency of the new wavelet-based algorithm.
3. SPECTRAL STRUCTURE PATTERN
2. ENERGY ENVELOPE PATTERN
where Și is the intra-cluster distance of cluster i, while ȟij is the inter-class distance of cluster i and j. The optimal number of cluster K is selected as (2) K = arg min ( ρ (k )) 1< k ≤10
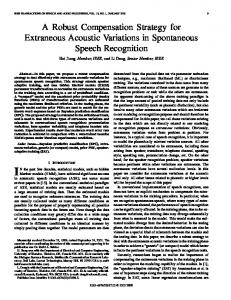
and is equal to five in experiments. The five energy envelope patterns obtained from the database are illustrated in Fig. 2. 1
E
1
E
1
Time-Frequency Representations (TFRs) of audio signal, such as the spectrogram, contain the most information for content analysis. In order to solve the issue of noise sensitivity introduced by previous method of spectral structure pattern extraction, Time-Frequency Principal Component Analysis (TFPCA) [9] is utilized to detect the most prominent structure in spectrogram, which is more crucial to human perception [5]. TF-PCA not only reduces the effect of noise, but still keeps enough information of original spectral representations. The spectral structure pattern is then extracted from the principle spectral components.
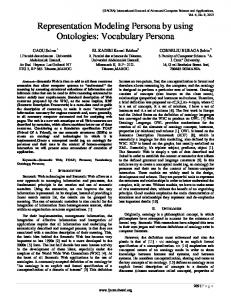
3.1. Time-Frequency Principal Component Analysis Suppose an audio spectrogram is represented by X of an N×M matrix, where N is the number of frequency channels, and M is the number of time slices, as Fig. 3 shows. Each column of X, denoted as xj, contains a vector which represents the spectrum at corresponding time j, while each row can be seen as the spectral evolution of a corresponding channel over time. One practical method of carrying out TF-PCA on spectrogram is singular value decomposition (SVD) [9], which decomposes X into X = USV T (4) where U is an N×N orthogonal matrix, containing the spectral principle components; V is an M×M orthogonal matrix, presenting temporal principle components; and S is an N×M diagonal matrix of singular values. The larger the singular value is, the more salient the corresponding principle components are. Fig. 3 shows an example of SVD decomposition and illustrates the first three spectral and temporal principle components. VSHFWURJUDP
E
11000 10000 9000
1
Frequency (Hz)
Human’s auditory system is sensitive to evolution phases of a sound, including attack, sustain and decay, which can be approximated by using energy envelope [5]. In our previous work [1], a polynomial curve fitting based clustering method is proposed to extract representative energy envelope patterns. However, such an approach often suffers from the numerical instability in solving the least-squares problem. It is also not proved the Euclidean distance is preserved in the polynomial coefficient space. To solve these issues, wavelet-based approach is utilized to discover more solid envelope patterns. In our current work, an iterative clustering algorithm proposed by Vlachos et al. [6] is utilized in Haar wavelet space, where Euclidean distance is preserved [7]. The method solves the dilemma of initial centers choice existed in k-means clustering algorithm. Furthermore, the iterative process can be stopped at any level to get representative envelope patterns under different resolution. In order to find an optimal cluster number, we employ the cluster validity analysis [8]. The principle is to find clusters that minimize intra-cluster distance while maximize inter-cluster distance. The cluster separation measure ȡ(k) is defined as ηi + η j 1 ρ (k ) = ¦ik=1 max{ } (1) 1 ≤ ≤ j k k ξ ij
0 0 1
8000
0.5
0.5
0.5
VSHFWUDO�SULQFLSOH�FRPSRQHQWV
0.5
2000
4000
6000
8000
10000 Hz
2000
4000
6000
8000
10000 Hz
2000
4000
6000
8000
10000
7000
0.5 6000 5000
t
0
1
20
40
60
0
a
E
t
1
20
40
60
b
E
0
t
20
40
60
3000
c
0.5
2000 Time (s) 1000
0.5
0 0 1
4000
0.5
1
1.5
2
2.5
;
3
3.5
4
4.5
5
VLQJXODU�YDOXHV
0.5
5.5
0 0
1
8
Hz
WHPSRUDO�SULQFLSOH�FRPSRQHQWV
20
0
t
20
40
d
60
0
18
t
20
40
0.5
16
60
0 0 1
14
e
1
2
3
4
5 sec
1
2
3
4
5 sec
1
2
3
4
5
12
Fig. 2. Five representative energy envelope patterns
0.5
10 8
The clustering results are similar to those presented in our previous work, in which each pattern characterizes a typical process of sound attack, sustains and decay. However, the wavelet-based method is more robust and faster. To give more description of an audio segment S, its energy envelope pattern is characterized as a vector which consists of the distance from it to
0 0 1
6 4
0.5
2 0 1
2
6
3
0 0
sec
9
Fig. 3. TF-PCA of a sound effect of “wolf” (only the first three principle components are illustrated)
,9������
xj =
10 log 10 ( x j )
¦
N k =1 (10 log 10
(5)
x j ( k )) 2
3.2. Spectral Structure Patterns In experiments, it is found that the singular value of the first principle component is usually greatly higher than others in TFPCA process. For the purpose of general feature extraction, we just keep the first spectral principle component u, i.e. the first column of matrix U, for subsequential structure pattern analysis. The spectral structure pattern descriptor is also designed as a vector, which consists of the spectral shape pattern in each subband and harmonicity prominence.
f n = nf 0 1 + β (n 2 − 1) (8) ȕ is the in harmonicity modification factor [10], and is set as 0.0005 in experiments. E(n) is the energy of the detected nth harmonic contour in the range of [fn-f0/2, fn+f0/2] and the (n) denominator E is the total spectrum energy. B (n) r and B w are th brightness and bandwidth [4] of n harmonic contour respectively. Brightness B(n) r is used here, instead of the detected harmonic peak, in order to get a more accurate frequency center. Bandwidth B(n) w gives a description about the concentrated degree of nth harmonic. It is normalized by a constant B, which is defined as the bandwidth of the instance that the energy is uniformly distributed in the search range. A clear illustration on the definition of harmonicity prominence is shown in Fig.4. Energy
In current work, we mainly focus on the spectral principle components. In order to get rid of the impact induced by energy variation in different time slice, and give a clean description of spectral shape, before SVD decomposition, the spectrogram is first converted to a decibel scale and each column is constrained to unit L2-norm, as suggested in [9]:
1
VHDUFK�UDQJH
f0 2
0.9
f0 2
SHDN SHDN�ERXQGDU\
0.8
0.7 0.6
3.2.1 Sub-band Spectral Shape Pattern Two characteristics are taken into account to describe the subband spectral shape. One is the variation flux, corresponding to whether there are salient frequency components. The other is the average magnitude, describing bandpass or not in the sub-band. In practice, u is divided into 8 sub-bands equally in Mel-scale, with 50% overlap between adjacent sub-bands. Two descriptors, flux measure Sf and bandpass measure Sb, are defined as 1 S f (i ) = ¦ H i −1| u ( j + 1) − u ( j ) | H i − Li j = Li (6) 1 2 S b (i ) = ¦ Hj =i Li u ( j ) H i − Li + 1 where Li and Hi are the low and high boundaries of the ith subband respectively. The value of Sf(i) indicates the existence probability of salient frequency components, and Sb(i) gives a coarse description to the bandpass characteristics in the ith subband. 3.2.2 Harmonicity Prominence Pattern This pattern is designed to describe how “harmonic” the object sounds like. Unlike our previous harmonicity descriptor [1], which assigns the harmonic status in each sub-band to a predefined pattern, harmonicity prominence gives an exact measurement to present the harmonic level of the whole band. Considering the characteristic of an ideally harmonic sound, that is, its full spectrum energy is highly concentrated and precisely located at those predicted harmonic positions which are multiple of the fundamental frequency f0, the harmonicity measurement can be designed according to the following three factors: i) the energy ratio between the detected harmonics and the whole spectrum; ii) the deviation between the detected harmonics and predicted positions; iii) the concentration degree of the harmonic energy. Based on the above factors, Harmonicity Prominence Pattern consists of three components and is defined as Hp =
¦ nN=1 E
( n)
(1− | B r( n ) − f n | / 0.5 f 0 )(1 − B w( n ) / B )
E where fn is the predicted n harmonic position and defined by th
(7)
0.5
0.4 0.3 0.2
3HDN�HQHUJ\��GHVFULEHG�E\�(�Q (QHUJ\�FHQWURLG��GHVFULEHG�E\�%U�Q &RQFHQWUDWHG�GHJUHH��GHVFULEHG�E\�%Z�Q
0.1 0
0
200
400
I�
600
800
I�
1000
1200
1400
I�
1600
1800
2000
Hz
I�
Fig. 4. Definition of Harmonicity Prominence Pattern In the implementation, only the first N (which is set as 4) harmonic partials are considered in Hp calculation, since only these harmonic partials are prominent in most conditions. Furthermore, in case that the fundamental frequency can not be precisely predicted, f0 is varied in a pre-defined range and each corresponding Hp is calculated, in which the maximum is chosen as the value of Harmonicity Prominence Pattern for the sound object.
4. EXPERIMENTS To evaluate how these structure characteristics can improve the audio representation, a content-based audio retrieval system is built in our experiments. A better representation should improve both recall and precision of the retrieval system. The baseline retrieval system is established based on the framework of Muscle Fish [3], using only the statistics (mean, variance or covariance) of the following frame-based features: short-time energy, average zero-crossing rate, sub-band energies, brightness, bandwidth, spectrum centroid, spectrum rolloff and 8-order MFCC. The structure patterns are then integrated into the baseline system, by using weighted sum, following the work [1]. Our testing database contains around 1500 audio clips, including the database of Muscle Fish. These sounds vary in duration from less than one second to about 30 seconds; and include kinds of sounds, such as animals, instruments, vehicles, human, weapons and so on. About 450 sound effect clips are used as queries in current experiments.
,9������
is also proposed to give more detail description of spectral characteristics. Evaluations on a content-based audio retrieval system showed that the proposed structure patterns are effective supplements to conventional audio representation, which only uses statistical characteristics. 80 75 70 65
R e c a ll (% )
Firstly, we compare the performance of three systems: the baseline, the system integrating baseline with previous structure patterns proposed in [1], and the system with current structure patterns proposed in this paper. Fig. 5 illustrates the detail results of recall and precision curve. It is noted that remarkable improvements are obtained after integration with current structure patterns. For example, in the results of top 20, more than 45% targets are recalled with current patterns, while only about 35% and 25% are obtained with previous methods and baseline respectively; the precision is also increased by around 25% using current structure patterns, comparing to previous patterns. It clearly indicates that much improvement is achieved for the sound objects representation in our current system.
60 55 50 45
75 70 65
Recall (% )
40 80
55
15
50
10
40 35
w ith current spectral pattern
Top 20
30
40
50
60
70
80
90
100
Fig. 6. Improvement on recall ratios with current methods
using statistical features only
30
with previous structure patterns
25
6. REFERENCES
with current structure patterns
20 15
Top
10 20
30
40
50
60
Precision (%)
10
55
w ith previous spectral pattern
10
45
60
w ith current energy envelope pattern
25
60
65
w ith previous energy envelope pattern
30 20
70
using statistical features only
35
70
80
90
100
using statistical features only with previous structure patterns with current structure patterns
50 45 40 35 30 25 20 15
Top 10 10
20
30
40
50
60
70
80
90
100
Fig. 5. Comparisons of recall and precision ratios between the retrieval results Investigating more detail, the efficiencies of individual structure patterns are also examined, comparing among the baseline, previous and current temporal patterns and spectral patterns. Fig. 6 illustrates the detail comparison results of recall. The improvement given by current spectral patterns is highly notable, which mainly increases by 50% based on the baseline system. In comparison with previous methods, the recall ratios increase by around 11% and 18% with current envelope and spectral patterns respectively. The results further indicate the distinct improvements of current temporal and spectral feature structure patterns.
5. CONCLUSION This paper presented some improvements on temporal and spectral structure patterns, in order to get a better audio representation. Besides refinements of energy envelope pattern and harmonicity pattern, a new sub-band spectral shape pattern
[1] R. Cai, L. Lu, H.-J. Zhang, and L.-H. Cai, “Using Structure Patterns of Temporal and Spectral Feature in Audio Similarity Measure”, Proc. of the 11th ACM International Conference on Multimedia, pp.219-222, Berkeley, CA, Nov. 2-8, 2003. [2] L. Lu, H.-J. Zhang, and H. Jiang, “Content Analysis for Audio Classification and Segmentation”, IEEE Trans. on Speech and Audio Processing, Vol.10, No.7, pp.504-516, Oct. 2002. [3] E. Wold, T. Blum, D. Keislar, and J. Wheaton, “ContentBased Classification, Search, and Retrieval of Audio”, IEEE Multimedia, Vol.3, No.3, pp.27-36, 1996. [4] Z. Liu, Y. Wang, and T. Chen, “Audio Feature Extraction and Analysis for Scene Segmentation and Classification”, Journal of VLSI Signal Processing-Systems for Signal, Image, and Video Technology, Vol.20, No.1-2, pp.61-79, Oct., 1998. [5] B. Gygi, Factors in the Identification of Environmental Sounds, Ph.D. Thesis, Indiana University, June, 2001. [6] M. Vlachos, J. Lin, E. Keogh, and D. Gunopulos. “A Wavelet-Based Anytime Algorithm for K-Means Clustering of Time Series”, Proc. of Workshop on Clustering High Dimensionality Data and Its Applications, at the 3rd SIAM International Conference on Data Mining, San Francisco, CA, May 1-3, 2003. [7] K.-P. Chan and A.W.-C. Fu, “Efficient Time Series Matching by Wavelets”, Proc. of the 15th International Conference on Data Engineering, pp.126-133, Sydney, Australia, Mar. 23-26, 1999. [8] A.K. Jain and R.C. Dubes, Algorithms for Clustering Data. Prentice Hall, Englewood Cliffs, New Jersey, 1988. [9] M.A. Casey, “MPEG-7 Sound-Recognition Tools”, IEEE Trans. on Circuits and Systems for Video Technology, Vol.11, No.6, pp.737-747, Jun. 2001. [10] N.H. Fletcher and T.D. Rossing, The Physics of Musical Instruments, Springer-Verlag New York, Inc., 1998.
,9������