Improved Algorithms for Combining Satellite Imagery and Geographic ...
Recommend Documents
5 North Coast Consulting, Mount Pleasant Eco Park, Chapel Hill, Porthtowan, Cornwall, UK. 6 Satellite Applications Catapult, Harwell, UK. The âLithium Projectâ ...
Jun 28, 2018 - would overcome the problems of choosing either large scale or .... value lower than 30 cm, and an outer subplot of 1000 m2 for trees ... After delineating the perimeter of the fire on a Landsat 8 scene, ... Blue parallelograms.
Aug 19, 2016 - comings have prompted calls for a âdata rev- olutionâ to .... S4). This high overall predictive power is achieved despite a lack of temporal labels for the daytime ..... mapping,â AAAI Conference on Artificial Intelligence (2016)
Jun 28, 2018 - plots with partial cover UAV imagery and Sentinel-2 data on a ...... Scott, C.T.; Gove, J.H. Encyclopedia of Environmetrics; El-Shaarawi, A.H., Walter, W., Eds.; ... Bortz, J-4; Springer: Berlin/Heilderberg, Germany; New York, NY,.
1Information Technology and Systems Center, University of Alabama in Huntsville, Huntsville, AL. 2Florida Institute of Technology, Melbourne, FL.
severity following a major blowdown event in northern Minnesota, USA. MARK D. NELSON*â , SEAN P. HEALEYâ¡, W. KEITH MOSERâ and MARK H. HANSENâ .
the reconstruction of Neolithic Thessaly landscape. ALEXAKIS D.,. 1 ... goules were established from Early Neolithic period until Bronze Age. In this study filed ...
The IKONOS satellite simultaneously collects 1-m panchromatic and 4-m
multispectral images, ... the Commercial Remote Sensing Satellite (CRSS) now.
Sep 1, 2014 - portation and Mixed Integer Linear Programming in Facility ... location studies require new information technologies, which permit systems to be.
Keywords: Landsat 5 TM, forest inventory and monitoring, two phase sampling,
ancillary .... programming and calculating for Landsat 5 TM mate— rial. Thus, he
...
This paper discusses the metric exploitation of 1m satellite imagery, and specifically looks at the options available for multi-image restitution in situations where ...
and of sensitive, dual-use technologies, or to increase security and build ... of the International Atomic Energy Agency (IAEA) in order to verify compliance with.
Satellite remote sensing is a recent addition to the range of disciplines that can
assist ... Archaeology is a recent application area of satellite remote sensing and
...
Mar 21, 2013 - Keywords: Refugees camp, monitoring, object-based classification, ..... [8] Weston, P., "Inside Zaatari refugee camp: the fourth largest city in ...
sites throughout Mrica (Rogers and Randolph, 1991; Rogers, 1991; Rogers and. Williams, 1993) ...... Tucker at NASA; and the many people associated with the PATHFINDER programme .... John Wiley & Sons: New York, USA. White, E 1983.
South Sudan: Wau PoC AA Satellite Imagery - 12 April 2017. April 2017. Map Production Date: 20 April 2017. Satellite ima
Apr 20, 2017 - South Sudan: Wau PoC AA Satellite Imagery - 12 April 2017 ... Satellite imagery copyright DigitalGlobe In
Library and the Doric Fountain House, whereas a newly (re)arranged street connected this zone to the Roman. Theatre and another ..... Ein Blick von der Ferne.
and IR satellite imagery collected over the Gulf of California (Mexico) in November 1981 are ..... Mathewson, W.D. Jones, J. Kogelschatz and R.T. Barber, 1986.
The data is available for download from the Landmap website for ... National Grid (UK data) or Irish National Grid (Republic of Ireland data) and can be ... Part of the work conducted by the SIDS is to acquire, create, maintain and disseminate.
Oct 18, 2016 - Intelsat S.A.; Iridium Communications Inc.; Kratos Defense & Security Solutions; Ligado. Networks; Lo
Oct 18, 2016 - satellites play in providing communications and other important services .... infrastructure management,
(bahaa.alhaddad, josep.roca, malcolm.burns)@upc.edu b GRAHI, Dept. of Civil ... greatly in how the land is used (Ann Forsyth, 2003). Areas of built form ...
Improved Algorithms for Combining Satellite Imagery and Geographic ...
transparency is assigned to the satellite data, where colder clouds ... http://www.ssec.wisc.edu/~rickk/temp_diff.html ... The first equation defines the opacity of the.
14.4
Improved Algorithms for Combining Satellite Imagery and Geographic Basemaps Richard A. Kohrs* University of Wisconsin, Madison, Wisconsin
1. Introduction Traditional algorithms for combining satellite imagery with topographic or vegetation basemaps have been limited to using infrared data. Here, an infrared brightness temperature (Tir) is chosen to determine a cloud/no cloud threshold. The product created displays a basemap where Tir is greater than the threshold and infrared satellite data where Tir is less than the threshold. Additionally, a temperature-based transparency is assigned to the satellite data, where colder clouds are more opaque. This method exaggerates cloud coverage over polar regions and underestimates stratiform cloud coverage over lower latitudes. More recently, we have begun to see visible imagery combined with basemaps using an albedobased transparency. This method greatly improves overall cloud cover estimation, but is limited to daylight hours. The Datacenter at the University of WisconsinMadison generates global real-time weather graphics from its databases of satellite imagery, conventional data and numerical model output. Our first attempts at combining satellite images with basemaps on a global scale accentuated the problems of the traditional algorithm, making our products unacceptable to some of our clients. We have now implemented an algorithm that utilizes surface temperature (Tsfc). The value Tsfc-Tir determines cloud transparency. Additionally, a second algorithm is described which uses day/time weighting functions to blend visible and infrared data imagery. Examples of both algorithms can be viewed at the following web locations:
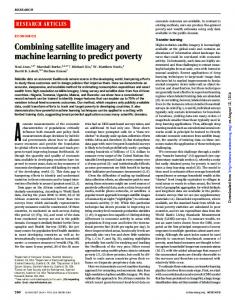
assumption were completed over the continental U.S. and adjacent coastal regions. Using Man computer Interactive Data Access System (McIDAS) software (Lazzara et al. 1999), we created 8-bit calibrated images of Tir (derived from GOES-12 11 µm data), Tsfc (analysis derived from surface, ship and buoy observations) and temperature difference, Tsfc-Tir. Finally, cloud/no cloud masks, using various values of Tsfc-Tir were applied to GOES-12 11 µm data and the results were compared to corresponding GOES-12 visible images. The process is illustrated in Figures 1-9 using 18 UTC data from 29 November 2004. This test case was chosen due to the extreme temperature contrast across the geographical domain.
Figure 1. GOES-12 11 µm 1745 UTC 29 November 2004
http://www.ssec.wisc.edu/~rickk/temp_diff.html http://www.ssec.wisc.edu/~rickk/vis_ir.html 2. Utilizing Surface Temperatures The traditional Tir based cloud/no cloud algorithm raised two major concerns with our global satellite products. First, and most important, was the exaggeration of cloud coverage in higher latitudes and second, the loss of warmer stratiform clouds. To address the first issue, we chose to draw upon the simple assumption that Tir