Improved Cycle Detection for Accelerometer Based Gait Authentication Mohammad O. Derawi Norwegian Information Security Lab. Gjøvik University College, Norway Email:
[email protected]
Patrick Bours Norwegian Information Security Lab. Gjøvik University College, Norway Email:
[email protected]
Abstract—Over the last years, there has been an increasing research interest in the application of accelerometry data for many kinds of automated gait analysis algorithms. The need for more security on mobile devices is increasing with new functionalities and features made available. To improve the device security we propose an improved biometric gait recognition approach with a stable cycle detection mechanism and comparison algorithm. Unlike previous work on wearable gait recognition, which was based from simple average cycling methods to more complicated methods, this paper reports new techniques for which can improve the performance, by using simple approaches. Preprocessing, cycle detection and recognition-analysis were applied to the acceleration signal. The performance of the system was evaluated having 60 volunteers and 12 sessions each volunteer and resulted in an equal error rate (EER) of 5.7%.
I. I NTRODUCTION Mobility is in the future and the future is currently in the present. Today’s personal devices, whether we are dealing with mobile phones, PDAs, iPads, etc. are being held or put into the pocket of the user. What we don’t have time to do on computers or laptops, we do on these devices and this makes the everyday much easier. They are not only used for mere communication such as calling or sending text messages; these devices are also used in applications such as m-banking, m-commerce and e-mails which result in financial and private information being stored on the device. Thus the data on the device represents by far the more valuable asset than the pure hardware [1]. Therefore, the security risks related to ever-present mobile devices are becoming critical since a mobile device ending up in the wrong hands presents a serious threat to information security and user privacy. Most common, the protection on portable devices against unauthorized usage is based on a PIN, which is not always effective considering security and memorability aspects [2]. An additional difficulty with PINauthentication is that it requires explicit action from the user who has to enter it before using the phone. In consequence many users deactivate the PIN-authentication. This unattractive situation can be improved by exploiting the intrinsic sensors of a mobile device and applying an unobtrusive method for user authentication, which does not require explicit attention nor action of the user. Biometric
Kjetil Holien Norwegian Information Security Lab. Gjøvik University College, Norway
gait recognition based on accelerometer data such an authentication method and will be further explained and analyzed in this paper. Today, mobile devices implements other biometric equipments such as fingerprint sensors [3] to improve the security. And by using biometric characteristics instead of passwords, PINs, tokens etc., makes authentication more efficient since these characteristics are not to be stolen or forgotten. In addition, biometric authentication establishes an explicit link to the subject’s identity because biometrics use human physiological and behavioral characteristics. Usually, most biometric characteristics require an explicit (obtrusive) user action for authentication, e.g. swiping the finger on a fingerprint sensor. However, the proposed method here in this paper does not require an obtrusive action. Instead, we introduce an unobtrusive gait recognition mechanism, where data is continuously recorded while the subject is walking. Previous studies from different aspects, psychology [4], medicine [5] and biometrics [6] [7] [8], already give proof for that human gait contains very distinctive patterns that can be used for identification and verification purposes. All of the published studies on gait recognition using acceleration data were mainly based on dedicated sensor and in the same time slightly aware of fulfilling these issues at the very same time: 1) Automated gait recognition 2) Stable cycle detection mechanism 3) A rich and fast comparison algorithm (distance metric) In [7], we see several different, but very simple cycle detection mechanisms that are not fully automated. This means a lot of fixed parameters are used for the dataset. However, [9] introduces an extended version of [7], making the cycle detection more automated, but a lot of complicated methods were performed. In contrast to these, we describe a new possible method to gain improved results using simple cycle detection with a simpler distance metric. The particular type of device which was used in our research was the MR100 sensor [10]. The rest of the paper is structured as follows: Section II gives an overview over different existing gait recognition techniques. Section III describes the collection of gait data. In section IV the methods applied for feature extraction are described and the results are given in section VI. Section
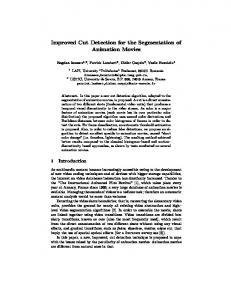
Figure 1. Background segmentation for extracting the silhouette picture (subtraction).
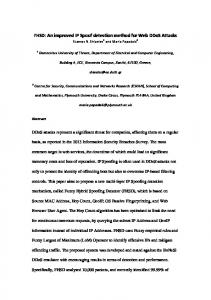
VII concludes the paper and, finally, section VIII describes future work. II. G AIT R ECOGNITION There are three different approaches in gait recognition: Machine Vision Based, Floor Sensor Based and Wearable Sensor Based Gait Recognition. These will be explained in the next paragraphs. Machine Vision Based (MV): In the machine vision approaches, the system will typically consist of several digital or analog cameras with suitable optics for acquiring the gait data. Techniques such as thresholding to convert images into black and white; pixel counting to count the number of light or dark pixels; or background segmentation are used to extract features to identify a person. Figure 1 shows an example of the MV-based approach with processed background segmentation. Earlier gait recognition studies have shown promising results. Sarkar et al. [11] did an experiment with 1870 gait datasets from 122 subjects and reported an recognition rate of 78% in an identification scenario. This was further improved to a rate of 90% by other research [12] [13]. Most of the current gait recognition approaches are MVbased. The main advantage for this type of recognition compared to other biometric systems is that persons are captured unobtrusively from a distance. Even though MVbased gait analysis is not that precise as other biometrics, e.g. fingerprints, it is still useful for surveillance scenarios. Floor Sensor based (FS): In the floor sensor approach the sensors are placed on a mat along the floor which makes these methods suitable for controlling access to buildings. When people walk across the mat, the force to the ground is measured, this is also known as the GRF (Ground Reaction Force). In a research from the University of Southampton [14], such a floor sensor for gait recognition was prototyped and is illustrated in Figure 2. Their experiment had 15 subjects and three different features were extracted, namely the stride length (the distance traveled by the heel of one foot to the next time the same foot strikes down), stride cadence (the rhythm of a person’s walk) and TOH ratio (the time on toe to the time on heel ratio). Using the TOH ratio an recognition rate of 80% could be achieved [15]. Different studies with small number of test persons (10 - 15) exist which report recognition rates up to
Figure 2. Gait collection by floor sensors. a) shows footsteps recognized, b) shows the time spent at each location in a), c) shows footstep profiles for heel and toe strikes, and finally d) is a picture of a prototype floor sensor carpet.
98.2%. Jenkins and Ellis [16] had 62 test persons and only reported a recognition rate of 39%. Wearable Sensor based (WS): The wearable sensor recognition methodology is the newest gait recognition among the other mentioned earlier and that it provides an unobtrusive authentication method for mobile devices. This is based on wearing motion recording sensors on the body of the person in different places; on the waist, pockets, shoes and so forth. The most common wearable sensors which are built-in into mobile devices are listed below: • • •
Accelerometer Sensor: Measures the acceleration . Gyro Sensor: Measures the rotation and number of degrees per second of rotation. Force Sensor: Measure the force when walking
Table I overviews the latest WS-based gait recognition research from years 2004 to 2010. The last column, #TP, represents the number of test-persons.
Study Gafurov et al. [7] Gafurov et al [7]. Gafurov et al. [7] Gafurov et al. [17] Holien [9] Ailisto et al.[18] M¨antyj¨arvi et al. [19] Rong et al. [20] Rong et al. [21] Vildjiounaite et al. [22] Vildjiounaite et al. [22] Vildjiounaite et al. [22]
Sensor Location trousers pocket hip arm ankle hip waist waist waist waist hand hip pocket breast pocket
EER 7.3 % 13 % 10 % 1.6 % 5.9 % 6.4 % 7.0 % , 19.0 % 6.7 % 5.6, 21.1 % 17.2, 14.3 % 14.1, 16.8 % 14.8, 13.7 %
#TP 50 100 30 30 60 36 36 35 21 31 31 31
Table I P ERFORMANCE OF CURRENT WEARABLE SENSOR - BASED GAIT RECOGNITION SYSTEMS .
III. DATA COLLECTION The experiment was carried out on a solid surface. The 60 subjects who participated wore an accelerometer attached to a belt. The accelerometer was placed on the left leg, by the hip. By attaching the accelerometer to a belt it ensured that the accelerometer more or less had the same orientation for all subjects. The subjects made the experiment over two days and were asked to walk as normal as possible in all 12 sessions, and to walk in a fixed length (20 meters). The subject walked the distance, and then stopped for three seconds, turn and wait, and then walk the same distance back. The accelerometer used was a Motion Recording 100 (MR100) sensor, with a sampling frequency of 100 samples per second and its dynamic range was between -6g and +6g (g = 9.8 m/s2 ) for each of the three directions x,y and z. IV. F EATURE E XTRACTION The raw data retrieved from the MR100 sensor needs to be processed in order to create robust templates for each subject. The program for the gait data analysis has been developed in C#. Preprocessing: The preprocessing is based on work from [7]. At first we apply linear time interpolation on the three axis data (x,y,z) retrieved from the sensor to obtain a obser1 second since the time intervals between two vation every 100 observation points are not always equal. Another weakness from the sensor is the fact that the acceleration data will be outputted with some noise. This noise is removed by using a weighted moving average. Thereafter, the data values are converted to g-forces by using properties of the sensor. And finally we calculate the resultant vector or the so-called magnitude vector by applying the following formula, q rt = x2t + yt2 + zt2 , t = 1, ..., N where rt , xt , yt and zt are the magnitudes of resulting, vertical, horizontal and lateral acceleration at time t, respectively and N is the number of recorded oberservations in the signal. Cycle Detection: From the data it is known that one cyclelength varies between 80 − 140 samples depending on the speed of the person. Therefore we need to get an estimation of how long one cycle is for each subject. This is done by extracting a small subset of the data and then compare the subset with other subsets of similar length. Based on the distance scores between the subsets, the average cycle length is computed, as can be seen in Figure 3. The cycle detection starts from a minimum point, Pstart , around the center of the walk. From this point, cycles are detected in both directions. By adding the average length, denoted γ to Pstart , the estimated ending point E = Pstart +γ is retrieved (in opposite direction: E = Pstart − γ ). The cycle end is defined to be the minimum in the interval Neighbour Search from the estimated end point. This is illustrated in Figure 4. This process is repeated from the
Figure 3. The yellow baseline area indicate the subset with 70 samples that are extracted, the green area is the search area where the baseline is compared against a subset of the search area. The 4 black subgraphs are the baseline at those points it has the lowest distance with the search area subsets, and the difference between them (blue area) indicate the cyclelength
Figure 4. Cycle detection showing how each cycle (i.e the steps) in the resultant vector is automatically detected.
new end point, until all cycles are detected. The end point in the Neighbour Search is found by starting from point E. From this point we begin searching 10% of the estimated cycle length, both before and after E for the lowest point. Now three things can happen 1) The lowest point was found in the first 31 of the search area, in this case we might have skipped too many samples γ more samples backwards. If and will therefore search 10∗2 a new lowest point was found we will continue to search additional samples backwards until no new lowest point is found, see Figure 5(a). 2) The lowest point was found in the last 31 of the search area, in this case we might have skipped too few samples
γ more samples forwards. Like and will therefore search 10∗2 with the previous step, if a new lowest point was found we will continue to search forward until no new lowest point is found, see 5(b). 3) The lowest point was found in the middle 31 of the search area, in this case we assume to have found the correct minimum point, see Figure 5. When the minimum point
calculate its distance to every other cycle by using dynamic time warping (DTW), dtwi,j = dtw(cyclei , cyclej ) where i = 1..N and j = 1..N, which means that we will get a symmetric N × N matrix. From this point, we calculate all the averages of one specific cycle to all others. 1 X di = dtwi,j n−1 j6=i
Thereafter we calculate the average of the calculated averages, 1X µ= di n i which therefore will be the total average. Now we will have the opportunity to see how much deviation one cycle differs from another. Thus, the standard deviation, µ, is calculated and to put a realistic border we will accept cycles that are within 2σ of difference from the total average di = [µ − 2σ; µ + 2σ] Figure 5. The Neighbour Search is illustrated for the three options that can happen when we are searching for steps, (a) we have jumped too far and since the lowest point in the search area (blue circle) is in the first third we search additional samples back and find the correct minimum point (green). (b) same as with the backward search only that we search forward this time since we have jumped too short. (c) we have jumped satisfactory and the correct minimum is in the middle third of our search area.
is found we store it into an array and we begin searching for the next minimum point by adding the length of one estimated cycle. When forward searching is complete we repeat this phase by searching backwards so all steps in the data are identified. We will therefore end up with having an array containing each steps start/end index. These points will therefore be used for the extraction of cycles, as illustrated in Figure 6.
Figure 6. The cycles have been extracted by taking each steps starting and ending point. Both these points are minimum points from the resultantvector data set.
Template Creation: Before we create the feature vector template, we ensure to skip cycles that are very different from the others. This is done by taking each cycle and
The 2σ is used to process trial and error. If a lower limit was chosen, we might had ended up skipping too many cycles, while a higher limit would lead to not skipping cycles we want to skip. When all odd cycles are removed, we want to create the feature vector. In previous work, researchers used an average cycle as a feature vector. That was computed by combining all cycles (which were normalized) into one average median cycle [7]. In this paper we propose a method where all of the extracted cycles are stored as a template for one subject, S } where each cycle i = 1..N is denoted C S = {C1S , ..., CN normalized to a length of k observations; in our case k = 100. Eight to fifteen cycles were stored per session. V. F EATURE V ECTOR C OMPARISON A new distance metric, named the cyclic rotation metric (CRM), is proposed. This metric cross-compares two sets of cycles with a cyclic-rotation mechanism to find the best matching pair: Cross Comparison: is used to find the most optimal and best distance score when cross-comparing two set of cycles, S T denoted C S = {C1S , ..., CN } and C T = {C1T , ..., CM }. This S simply mean that each cycle in set C is compared to every cycle in set C T . The comparison distances are calculated by the cyclic rotation metric (CRM). From the total number of N × M similarity distance scores gained, the minimum distance score is selected, dmin = min{CRM (CiS , CjT )} where i=1..N and j=1..M. The pair of cycles with the most minimum similarity score is considered the best matching
pair. Thus, this best (i.e. minimum) similarity score, dmin , is used as the similarity score between set C S and C T . Cyclic Rotation Metric (CRM): is a metric that compares a reference cycle and an input cycle with each other. The reference cycle, i.e. CiS , which is compared against the input cycle, i.e. CjT , is stepwise cyclical rotated. After each rotation the new distance is calculated using the manhattan distance. This is repeated until the input template has done a full rotation, then the lowest dissimilarity is kept: T )} d(CiS , CjT ) = minw=1..k {M anh(CiS , Cj(w)
, where k = 100. When having the two cycles with lowest manhattan distance, we then finally apply dynamic time warping on these cycles which then will be the final distance score CRM (CiS , CjT ) = DT W (d(CiS , CjT )) The reason why we calculate the manhattan distance when rotating and thereafter applying DTW when the minimal manhattan distance is found, is due to the fact that manhattan runs fast and linear, O(n) while DTW is O(n2 ). And furthermore the cyclic rotation is done to minimize the problem when local extremes among the cycles we create for each input are located at different locations.
Euclidean DTW CRM
Ours 8.2 % 5.7 %
Gafurov [7] 13% 11.75% -
Holien [9] 8.4 % 5.9 % -
Table II C OMPARISON OF VARIOUS METHODS - E QUAL ERROR RATES (EER) ARE PRESENTED
Furthermore, Table III shows a more detailed overview that compares Gafurov et al. and Vildjiounaite et al. [22] who applied different approaches. However, there are still several similarities with our experiment and Gafurov et al.’s experiment such as the use of same sensor and that the experiment was carried out in the exact same location. Holien uses the same settings as we do; therefore, it is not described in the table. Sensor Sensor Placement Participants Sessions Algorithm Ditance Metric EER
Ours MR100 Left hip 60 12 Cross CRM 5.7 %
Gafurov MR100 Right Hip 100 4 Average Cycle Euclidean 13%
Vildjiounaite ADXL202JQ Hip Pocket 31 2 Step Method Correlation 14.1 %
VI. R ESULTS
Table III A TABLE SHOWING THE MAIN DIFFERENCES BETWEEN OUR EXPERIMENT AND OTHERS .
Having 12 sessions for each person; that would give = 3960 genuine attempts and 720·(720−12) = 2 254880 impostor attempts. With these high numbers compared to trials presented in the papers from Table I we gain an increased performance with an EER = 5.7 %, see Figure 7.
VII. C ONCLUSION
12·(12−1)·60 2
Figure 7. DET-curve: Perfomance of Gait Recognition with an EER of 5.7 %. The x-axis indicates the false acceptance rate (FAR) and y-axis indicitas the false rejection rate (FRR).
From Table II, we display the performances for three cycle detection methods. The performance of our method is slightly more improved than Holien’s and more than twice as good as Gafurov’s.
This paper looks at interesting aspects of the biometric feature gait. A new, simple and rich gait recognition approach has been proposed. The proposed feature extraction method is adapted and applied to data from 60 volunteers. We can clearly say that we have achieved improved result with an EER of 5.7%, especially when we look at the number of participants and the genuine/imposter attempts. Even though that we had fewer participants than some of the other databases described in Table I, we did have more recordings per participant, almost up to twice the number of gait sequences. Our achieved EER is at first, much lower than the EERs for accelerometer based gait recognition that was placed on the hip as seen in Table I and in section VI. Secondly, our algorithm is more rich and stable, meaning that we have developed and automated cycle-detection (Neighbour Search algorithm), and finally the comparison that finds the best and most optimal distance score from two feature vectors with the use of cross comparison and Cyclic Rotation Metric (CRM) as a distance metric. VIII. F UTURE W ORK To make biometric gait recognition a technology suitable for practical use, using embedded accelerometers, further research on feature extraction and comparison is required.
However the achieved result is promising and the proposed approach contains potential for enhancement. Different walking conditions like walking speed or ground might have an influence of the walk of a person and therefore might also influence the biometric recognition. Therefore, accelerometer data of the subjects will be recorded at several settings like different walking speeds and different grounds (carpet, grass, gravel). In addition, data will be collected using phones at different positions (front and back trouser pocket and pocket attached to belt) for further analysis. In addition to improving the recognition rates for normal walk on different setting, we will in future work include analysis of the different settings mentioned before to create a gait recognition method which provides robust verification under different circumstances and especially begin analyzing acceleration data from a mobile phone.
[9] K. Holien, “Gait Recognition under non-standard circumstances, Master thesis, Gjøvik Univeristy College,” 2008. [10] T. Søndrol and E. Snekkenes, “Motion recording 100 sensor,” http://www.motion-recording.com/pages/products/mr100.php, 2007, [Online; accessed 19-June-2010]. [11] S. Sarkar, P. Phillips, Z. Liu, I. Vega, P. Grother, and K. Bowyer, “The humanid gait challenge problem: Data sets, performance, and analysis,” PAMI, vol. 27, no. 2, pp. 162– 177, February 2005. [12] Z. Liu and S. Sarkar, “Improved gait recognition by gait dynamics normalization,” IEEE Transactions on Pattern Analysis and Machine Intelligence, vol. 28, no. 6, pp. 863–876, 2006. [13] J. Han and B. Bhanu, “Individual recognition using gait energy image,” IEEE Transactions on Pattern Analysis and Machine Intelligence, vol. 28, pp. 316–322, 2006.
IX. ACKNOWLEDGMENTS We would like to thank all of our volunteers participating in the data collection and supporters. R EFERENCES [1] “Biometrics for secure mobile connections,” http://www.21stcentury.co.uk/technology/biometrics-formobiles.asp, [Online; accessed 19-June-2010]. [2] J. Tang, V. Terziyan, and J. Veijalainen, “Distributed pin verification scheme for improving security of mobile devices,” Mob. Netw. Appl., vol. 8, no. 2, pp. 159–175, 2003. [3] “Fingerprint solution to secure mobile phones,” http://pagespersoorange.fr/fingerchip/biometrics/types/fingerprint products pdaphones.htm, [Online; accessed 19-June-2010]. [4] H. W. Reese and D. Rodeheaver, “Age-related declinces in motor control,” in Handbook of the Psychology of Aging, 5th ed., C. J. Ketcharn and G. E. Stelmach, Eds. USA: Academic Press, 2001, pp. 333–335. [5] A. A. Kale, “Algorithms for gait-based human identification from a monocular video sequence,” Ph.D. dissertation, University of Maryland at College Park, College Park, MD, USA, 2003, chair-Chellappa, Rama. [6] M. S. Nixon, T. N. Tan, and R. Chellappa, Human Identification based on Gait, ser. International Series on Biometrics. Springer, 2005. [Online]. Available: http: //eprints.ecs.soton.ac.uk/11573/ [7] D. Gafurov, “Performance and security analysis of gait-based user authentication,” Ph.D. dissertation, University of Oslo, Faculty of Mathematics and Natural Sciences, 2008. [8] J. Mantyjarvi, M. Lindholm, E. Vildjiounaite, S.-M. Makela, and H. Ailisto, “Identifying users of portable devices from gait pattern with accelerometers,” Acoustics, Speech, and Signal Processing, 2005. Proceedings. (ICASSP ’05). IEEE International Conference on, vol. 2, pp. ii/973–ii/976 Vol. 2, March 2005.
[14] U. of Southampton, “England,” http://www.soton.ac.uk/, [Online; accessed 19-June-2010]. [15] K. Nakajima, Y. Mizukami, K. Tanaka, and T. Tamura, “Footprint-based personal recognition,” IEEE Transactions on Biomedical Engineeing, vol. 47(11), 2000. [16] J. Jenkins and C. S. Ellis, “Using ground reaction forces from gait analysis: Body mass as a weak biometric,” in Pervasive, 2007, pp. 251–267. [17] E. S. Davrondzhon Gafurov and P. Bours, “Improved gait recognition performance using cycle matching,” in International Conference on Advanced Information Networking and Applications, 2010. [18] J. M. E. V. S.-M. M. Heikki J. Ailisto, Mikko Lindholm, “Identifying people from gait pattern with accelerometers,” Biometric Technology for Human Identification II. In Proceedings of the SPIE, vol. 5779, pp. 7–14, 2005. [19] E. V. S.-M. M. H. A. J. Mantyjarvi, M. Lindholm, “Identifying users of portable devices from gait pattern with accelerometers,” IEEE International Conference on Acoustics, Speech, and Signal Processing (ICASSP ’05), vol. 2, pp. ii/973 – ii/976, 2005. [20] L. M. H. X. Liu Rong, Zhou Jianzhong, “Identification of individual walking patterns using gait accelleration,” In 1st International Conference in Bioinformatics and Biomedical Engineering, pp. 543–546, 2005. [21] Z. J. L. M. Liu Rong, Duan Zhiguo, “A wearable acceleration sensor system for gait recognition,” In 2nd IEEE Conference on Industrial Electronics and Applications, pp. 2654–2659, 2007. [22] E. Vildjiounaite, S.-M. M¨akel¨a, M. Lindholm, R. Riihim¨aki, V. Kyll¨onen, J. M¨antyj¨arvi, and H. Ailisto, “Unobtrusive multimodal biometrics for ensuring privacy and information security with personal devices,” in Pervasive, 2006, pp. 187– 201.