dicator from a black-box software component. We introduce Clarify, a system that improves error reporting by classifying application behavior. Clarify uses ...
Improved Error Reporting for Software that Uses Black-Box Components Jungwoo Ha Christopher J. Rossbach Jason V. Davis Indrajit Roy Hany E. Ramadan Donald E. Porter David L. Chen Emmett Witchel Department of Computer Sciences The University of Texas at Austin {habals,rossbach,jdavis,indrajit,ramadan,porterde,dlcc,witchel}@cs.utexas.edu
Abstract
1. Introduction
An error occurs when software cannot complete a requested action as a result of some problem with its input, configuration, or environment. A high-quality error report allows a user to understand and correct the problem. Unfortunately, the quality of error reports has been decreasing as software becomes more complex and layered. End-users take the cryptic error messages given to them by programs and struggle to fix their problems using search engines and support websites. Developers cannot improve their error messages when they receive an ambiguous or otherwise insufficient error indicator from a black-box software component. We introduce Clarify, a system that improves error reporting by classifying application behavior. Clarify uses minimally invasive monitoring to generate a behavior profile, which is a summary of the program’s execution history. A machine learning classifier uses the behavior profile to classify the application’s behavior, thereby enabling a more precise error report than the output of the application itself. We evaluate a prototype Clarify system on ambiguous error messages generated by large, modern applications like gcc, LaTeX, and the Linux kernel. For a performance cost of less than 1% on user applications and 4.7% on the Linux kernel, the prototype correctly disambiguates at least 85% of application behaviors that result in ambiguous error reports. This accuracy does not degrade significantly with more behaviors: a Clarify classifier for 81 LaTeX error messages is at most 2.5% less accurate than a classifier for 27 LaTeX error messages. Finally, we show that without any human effort to build a classifier, Clarify can provide nearest-neighbor software support, where users who experience a problem are told about 5 other users who might have had the same problem. On average 2.3 of the 5 users that Clarify identifies have experienced the same problem.
Bad error reporting is more than an inconvenience for most users. A large part of modern software support cost comes from time wasted with bad error messages, which we define as any message that does not provide sufficient information for a user to fix the problem in a timely fashion. One recent study concluded that up to 25 percent of a system administrator’s time may be spent following blind alleys suggested by poorly constructed and unclear messages [6]. The time and expertise required to administer modern computing systems is causing the cost of administrating, configuring and updating a machine to surpass the cost of the hardware [22]. Improving error reporting will keep down computer ownership costs and improve end-user satisfaction. An error or error behavior is any program behavior that is not a successful completion of a task specified by a user. Errors include bugs, which are program behaviors that do not match a program’s specification. It is also an error when a program fails a consistency check on its inputs—possibly because the user entered bad input, or mis-configured the system. Errors cause programs to produce error reports, which are usually text messages or dialog boxes that inform the user that the requested action will not complete. Crashes and hangs cause the program to output the null error message. The user must interpret an error report to figure out how to get the program to complete her request, often resorting to search engines and support websites (like support.microsoft.com) for more information. Consider the following model of error reporting. A given application has a set E of errors, and a set R of error reports. Unfortunately, one element r ∈ R can correspond to multiple elements e ∈ E because an error report is often ambiguous across multiple causes. For example, the Linux operating system uses the return code EEXIST to signal diverse error conditions, such as an attempt to create a file whose name already exists in a directory, or an attempt to put a rule in a routing table that conflicts with the routing table’s current state. Define S as a set of vectors of runtime statistics about an application. Then the tuple (r, s)|r ∈ R, s ∈ S could uniquely determine the proper e ∈ E, even though r alone fails. In fact, r might not be needed at all, s alone might suffice. We introduce Clarify, a system to improve error reporting. Clarify consists of two parts: a runtime to monitor a black-box software component, and a classifier to interpret the output of the runtime. Clarify monitors the program using minimally invasive techniques like reading the program’s memory or counting function calls. The Clarify runtime outputs a behavior profile (the s ∈ S). Clarify’s users collect the behavior profiles generated when the program experiences a particular error, and train a machine learning classifier that recognizes the application’s error behaviors. These users also
Categories and Subject Descriptors D.2.7 [Distribution, Maintenance, and Enhancement]: Enhancement General Terms
Documentation, Management, Reliability
Keywords Software support, Error report, Profiling, Classification, Machine learning Permission to make digital or hard copies of all or part of this work for personal or classroom use is granted without fee provided that copies are not made or distributed for profit or commercial advantage and that copies bear this notice and the full citation on the first page. To copy otherwise, to republish, to post on servers or to redistribute to lists, requires prior specific permission and/or a fee. c ACM, (2007). This is the author’s version of the work. It is posted here Copyright by permission of ACM for your personal use. Not for redistribution. The definitive version will appear in the ACM SIGPLAN 2007 Conference on Programming Language Design and Implementation (PLDI’07 ). June 11–13, 2007, San Diego, California, USA.
Clarify monitors application
• Evaluation of a Clarify prototype on large, mature programs (A) machine-learning model construction
Black box component
training behavior profiles
Clarify runtime deployed
machine learning algorithm + human labeled profiles
behavior profiles
(B) behavior classification machine learning classifier better error report
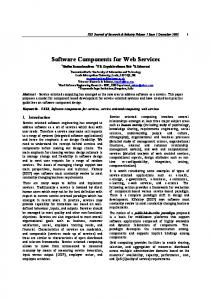
Figure 1. Clarify consists of a runtime monitor and a machinelearning classifier. The rectangles represent processes consuming and producing data. The Clarify runtime monitors a black-box component to generate a behavior profile that summarizes the execution history of the component. Section (A) shows a machine learning classifier, trained offline from behavior profiles. Section (B) shows the trained classifier classifying behavior profiles to produce improved error reports.
write an improved error report that describes the error behavior and how to fix or work around it (the e ∈ E). Classifier training is done by a small minority of technically-savvy Clarify users such as support engineers who reproduce user problems in-house. Endusers get the improved error reports by classifying their behavior profile. Clarify reduces the problem of improving error reports to the problem of classifying error behaviors. Figure 1 shows the major components of Clarify: the runtime and the machine-learning classifier. Each time the black-box component executes, the Clarify runtime generates a behavior profile. The behavior profile includes information about the control flow or data values of the program execution. Simple examples of a behavior profile would include counts of each function execution, or counts of how often each function returned zero. Training the machine learning classifier happens in section (A) of Figure 1. A machine learning algorithm takes labeled behavior profiles as input and produces a classifier. The classifier takes a behavior profile as input and outputs a label. A label could be a non-ambiguous error code, or a lengthy description of the problem and how to resolve it. The classifier improves error reports because users can train the classifier to recognize very specific errors that have a generic error report. In settings where labeled data is not available, Clarify employs a nearest-neighbor software support method. Here, users are paired with others who have experienced similar errors. Non-technical end-users get improved error reports from Clarify in section (B) of Figure 1. Clarify classifies an end-user’s behavior profile, giving them more precise information about their error and how to resolve it. The machine learning classifier uses features from the behavior profile to determine the error classification. A feature is the value of a particular statistic, like the number of times the function decode audio frame was called in an execution of an mp3 player application. A value of zero can indicate an error where no audio frames were ever played. The contributions of this paper are: • A system that combines runtime monitoring and machine learn-
ing in a novel way to improve error reports of black-box software components. • A new profiling technique called call-tree profiling, that rep-
resents software behaviors more accurately, on average, than existing profiling techniques such as function profiling, or path profiling.
that currently produce unclear error messages and confusing error behavior, such as the gcc compiler, and the Linux operating system. Our evaluation includes an in-lab deployment of Clarify. • Introduction of nearest-neighbor software support, where users
are paired with other users who have experienced the same problem. The next section provides an example use of Clarify that motivates the design presented in Sections 3–5. Section 6 describes our benchmarks and the ambiguous errors they report and Section 7 contains the evaluation of the Clarify prototype. Section 8 reviews related work and Section 9 concludes.
2. Improving error reports with Clarify: an example This section provides an example to elucidate the motivation for Clarify and the benefit to its users. The example also provides motivation for the sections that discuss Clarify’s design (Sections 3–5). 2.1 Clarify scenario mpg321 is a popular command-line mp3 player written by Joe Drew that is included in many Linux distributions. Software support options for mpg321 are limited. There is a support forum on SourceForge, and a mailing list for notification of new releases. Additionally, users are invited to email Joe Drew directly. The support forum has many requests for help with zero replies. Recent requests include some with titles, “Problem playing mp3’s” and “no sound.” mpg321 tends to fail without printing diagnostic messages. Imagine two users, SmartyP and Grandpa, who will use Clarify to improve the error reports of mpg321. We will assume that SmartyP posted the message about problems playing mp3s and that Grandpa posted the no sound problem (Note, user names have been changed, but posting subject lines have not). SmartyP has figured out his problem, and wants to donate his solution to the mpg321 support community using Clarify. SmartyP found that his mp3 audio data was corrupt, which does indeed cause mpg321 to run without producing audible output. Such a problem could occur if SmartyP were storing his files on a flash drive that was failing. Clarify enables Grandpa, a non-technical user, to benefit from the diagnosis of a technical user—SmartyP. Step 1: The Clarify runtime. We assume that SmartyP and Grandpa have Clarify-enabled versions of mpg321, i.e., the binaries are already linked with the Clarify runtime. Modifying an application to make it produce a behavior profile does not require source code, so it is reasonable to assume that Clarify-enabled binaries can be distributed along standard software distribution channels. Step 2: Collect behavior profiles. With the Clarify runtime, SmartyP runs mpg321 on a few corrupt mp3 files. The interface is simple: when the software fails it queries the user about what went wrong. SmartyP can enter, “mpg321 produces no sound output due to corrupted audio frame data in the source mp3 files. Check your mp3 files because their contents are probably corrupt.” The Clarifyenabled binary then uploads the problem description and behavior profiles generated by the executions that fail to the SourceForge support site. Step 3: Train a classifier. A moderator for the SourceForge support site would read SmartyP’s error description and group SmartyP’s behavior profiles with the profiles of other users who experienced the same problem. Having a human in the loop ensures that the language in the error report is clear and understandable and
guards against malicious or inept users. If less central authority is desired, a peer reputation system can replace a human moderator. The support site software (or moderator) will build a new classifier from the behavior profiles submitted by users. Users only need upload their profiles, they do not build classifiers. There are many policies for managing the classifier build such as doing it for every new error report, or building it once a day. Step 4: Use the classifier. Instead of posting “no sound” to the SourceForge support forum, Grandpa runs his Clarify-enabled binary. When Grandpa fails to hear any sound from mpg321, he hits a special help key which uploads his behavior profile to the SourceForge support website. The site classifies Grandpa’s behavior profile and provides him with SmartyP’s detailed error description, telling him that his mp3 file has corrupt data. 2.2 Discussion By classifying program behavior, Clarify enables a user community to improve software support. It also enables software vendors to improve software support. Microsoft has built distributed labeling of problem reports into Windows Vista. In the documentation for the new “Problem reports and solutions” control panel item, Microsoft says it can ask end-users to provide additional details about their problem to create a solution that can be provided to other users [18]. The Clarify scenario presented has most computation occurring on the server, but classification can happen on a client, if the client has the latest classifier definition from the server. Clients might periodically connect to the server to download classifier updates, like modern virus checkers update virus definition files. Once the information is cached locally, a client can diagnose errors without connecting to the network. SmartyP treats mpg321 like a black box. He does not change the error reports generated by the source code. Maybe such changes would be accepted by Joe Drew in a timely fashion, but maybe not. Programs developed by more people or commercial organizations are difficult or impossible for an end-user to change. The example motivates the following questions, which we address in succeeding sections. Feature collection (Section 3). What information does the Clarify runtime collect? This section describes alternatives for the contents of behavior profiles. Deployment and security (Section 4). Can Grandpa run a minimally instrumented executable that is fast enough for daily use, but produces behavior profiles of sufficient detail to disambiguate currently known errors? Does SmartyP’s contribution to the support site mean that Grandpa can figure out what kind of mp3s SmartyP listens to? Minimizing human effort (Section 5). Clarify can give SmartyP’s email address to Grandpa, even before SmartyP contributed his labeled examples (or even figured out what his problem is), because it can detect similarity between user executions even without a trained machine learning classifier. SmartyP only uploads a few behavior profiles, because he assumes that other will also upload profiles. A classifier trained on diverse examples usually generalizes better than one trained on homogeneous examples. Section 7.4 measures how many labeled profiles are necessary to train an accurate classifier (in our experiments, mpg321 requires 38 profiles per error type).
3. Behavior profiles The Clarify runtime should collect the most expressive runtime features at the lowest cost. Expressive features are those that a machine learning algorithm can use to discriminate different error behaviors robustly. Intuitively, expressive features capture details of control flow or important data values that are caused by a particular er-
Behavior Profile FP CSP PP CTP CSRV SS
Key
Value # of times called # of times invoked # of times occurred # of times executed # of times executed # of counts
Table 1. Summary of the type of feature that is collected by the Clarify runtime.
ror behavior. For instance, an incorrectly formatted URL passed to a web browser can be correlated with the execution of functions that attempt every possible interpretation of the input URL before declaring the error. Programs often have error-reporting routines, so one might think that the execution of such routines is a surefire indication of an error behavior. However, highly mature and factored programs, like gcc, reuse error-reporting code for other purposes, such as producing warnings during correct compilation. In every non-trivial program we have examined, simple correlations between an error condition and the execution of a given function or the presence of a given return code do not hold. Clarify collects feature counts from black-box components using code instrumentation that does not require source code. Recent binary-to-binary translators like Traceback [3] (static) and Dynamo(RIO) [4, 11] (dynamic), and fine-grained instrumentation systems like the OS-level instrumentation tool KernInst [37], Sun’s DTrace [13], or Linux’s kprobes [24] (all dynamic) provide the opportunity to insert a small amount of instrumentation code to userlevel applications or the operating system with very low executiontime cost. Clarify must limit the number of features it collects. Error behavior is usually correlated with a small number of features, so collecting large numbers of features requires the machine learning algorithm winnow the large set of features down to the relevant few. Having more than about 70,000 features pushes the limits of many machine learning algorithms often causing address space exhaustion and unreasonable runtimes. This section discusses Clarify’s strategy for collecting information about control flow and data values. 3.1 Control flow Clarify counts features that are related to control flow because control flow is a good indicator of program behavior. In general, the more information Clarify collects about control flow, the more accurate its model of program behavior, but this accuracy comes at the price of greater CPU and memory overhead. One form of behavior profiling counts the execution of function call sites. Another counts intra-procedural paths using path profiling [5]. Paths encode more information about control flow, but they are more expensive to collect than function counts. Clarify also introduces a new profiling method called call-tree profiling that summarizes the calling behavior of a function and its caller. The calling behavior contains some of the intraprocedural control flow that program paths represent, but it is less computationally intensive to gather. Clarify uses counts because counts preserve rare events. Often a program will make a unique sequence of function calls before outputting a cryptic error report or crashing. Clarify uses those unique calls as the signature of the behavior. Some systems use
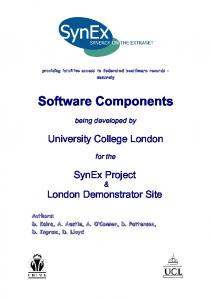
Figure 2. An example of call-tree profiling. The left side of the diagram is the rightmost subtree of the dynamic call tree with arrows pointing in the direction of function calls. The right side is the CTP feature that is collected when function C returns. The CTP feature is combination of call sequences of function C and its caller A. event probabilities [8], which penalize the importance of rare code paths, especially for programs that run for long periods of time. We evaluate a number of approaches to behavior profiles that have different tradeoffs for performance overhead and level of execution detail. 3.1.1 Function and call-site profiling The first method uses function profiling (FP) (sometimes called function call profiling [31]). Each function has a counter that is incremented when the function is executed. The order in which the functions are called is not retained. Function profiling is efficient and tends to be accurate when each behavior has a set of unique functions associated with it. The second method is call-site profiling (CSP). This is similar to FP but the counter is associated with each call site, rather than with the call target. For direct calls, CSP differentiates among call sites, while FP does not. 3.1.2 Path profiling The third control-flow based behavior profiling method is path profiling (PP) as described by Ball and Larus [5]. Each program path within a procedure (unique sequence of basic blocks) has a counter that is incremented when the path is executed. Path profiling distinguishes amongst program behaviors that result in different control flow within a function (intra-procedural control flow), something that function profiling cannot do. 3.1.3 Call-tree profiling The fourth control-flow based profiling technique is call-tree profiling (CTP). Since each function in a program is one processing step, the dynamic call tree is a good representation of the program behavior. However, the size of the whole dynamic call tree is enormous, it is impractical to use it for the classification directly. CTP counts the number of times a particular calling sequence occurs in the current function and its caller. It counts the sequence at every function return or loop backedge. CTP is an approximation to the subtree of depth 2 in the call tree. Figure 2 shows an example of a dynamic call tree and the CTP pattern that is counted. Each arrow indicates the call direction and the left sibling is called before the right sibling. The tree shown is where A calls B (B may call other functions but that behavior is ignored by CTP) and then calls C, and C calls D and then E. When function C returns the call pattern for C is (C (D E)), and the call pattern for C’s caller A is (A (B C)). Therefore, CTP increments by one a counter for the entire pattern of C and its caller, “(C (D E)),(A (B C)).” To implement CTP efficiently, each function gets a CTP bitvector, where each corresponds to a call site in the function. To reduce the number of bits used, a bit is assigned only once per basic block because calls in a basic block happens in the same order. Some bits
are shared for basic blocks that cannot be called together in a single path. When a function returns, CTP increments a counter for the concatenation of the function’s and its caller’s bitvector. CTP also increments the counter on loop backedges, clearing the current function’s bitvector. In this way, CTP bitvectors remain compact. Path profiling is able to preserve more fine-grained information about paths within the function than CTP’s bitvector, but CTP preserves more information about calling context by concatenating the caller’s bitvector. Because the order of the function calls can be decoded offline with the control-flow graph and the bitvector, CTP is distinct from calling context trees [2, 42] which are lossy with respect to calling sequence. Experimental results in section 7 show that CTP supports high classification accuracy. 3.2 Data Data values can provide robust characterization of error behavior, though a na¨ıve implementation can greatly increase the number of features thereby canceling any benefit. For instance, to associate return values with their call sites, Clarify can count call site, return value pairs. A function that has 100 distinct return values will increase the number of features by 100. Such encodings increase the complexity of the classification task considerably as machine learning algorithms have performance and accuracy problems when confronted with large numbers of features. Predication is a standard technique to reduce the feature space of data values [27]. We define nine predicates which are applied to Clarify data and return values; the predicates map raw values to feature values. The predicates indicate whether the raw value is equal to zero, equal to 1 or -1, is a small or large positive or negative integer, or is a pointer to the stack or heap. The thresholds for small and large positive and negative integers are arbitrary: any value with absolute value less than 100 is small, any value with absolute value greater than 100 that is neither a stack or heap pointer is “large”. 3.2.1 Call-site profiling with predicated return values Call-site profiling with predicated return values (CSRV) counts pairs of call sites and predicated return values. If call-site A returns 255 one hundred times and returns -1 once, then the feature has a count of 100 and the feature has a count of 1. 3.2.2 Stack scraping Stack scraping (SS) is a behavior profile that relies only on the dynamic data values from an execution instance, rather than on control flow. The insight behind stack scraping is that the stack contains control flow history in the form of return addresses (some of them residual in memory below the current stack pointer) and status information like function return codes. At the moment the program returns an error code, its execution is paused, the range of memory allocated to the program stack is traversed, and a feature vector representing that instance of execution is created by applying predication to each word in the stack range. The representation trades some fidelity for convenience and compactness, compared to instrumentation-based control flow histories. The scraper obtains the stack and heap bounds dynamically (from /proc/pid/maps on Linux) so it can differentiate pointers to the stack and pointers to the heap. Stack scraping is unique in Clarify feature sources in that it does not require instrumentation of the source program. It imposes very little runtime overhead, but it is also the least accurate feature source.
4. Deployment issues This section discusses the different deployment scenarios for Clarify, and addresses security issues of a Clarify deployment.
4.1 Forensic vs. live deployments Clarify can be deployed in two ways: to improve any error report a program can give (live deployment), or to improve a fixed set of error reports (forensic deployment). A live deployment will instrument an entire executable, sacrificing some performance to collect data about the entire application’s behavior. A forensic deployment only collects data that is known to help disambiguate a fixed set of error reports. 4.2 Security Clarify improves software support, but raises security issues for users and software vendors. Users would like to keep their data and the way they use software private. Vendors do not want to divulge information about the structure, control flow, and support history of their product to users or competitors. Current software support systems suffer from this problem. In Windows Vista, there is a new control panel item called, “Problem reports and solutions,” [17] which is a refinement of the current Windows support dialog. When a program malfunctions, it can send a partial memory dump to Microsoft and Microsoft can send the user a better error report. However the dump sent to Microsoft can contain arbitrarily sensitive data (e.g., passwords, credit card information, etc.). Microsoft’s privacy statement currently discourages users who are concerned about privacy from using their service [16]. Clarify decision trees can be evaluated on Clarify behavior profiles in such a way that the end-user learns only the information related to his error (and nothing about the software support history or control flow of the application). The software vendor who provides the decision tree learns nothing about the user’s execution. The security details are in a separate paper [9], but the system allows trees with 255 nodes and 1,000 attributes to be securely evaluated for 28 seconds of online computation and 4.5 MB of bandwidth for the vendor, and 48 seconds of online computation time and 1.5 MB of bandwidth for the user.
5. Minimizing human effort Clarify requires humans to label or generate examples of faulty error reports in order to train a machine learning classifier. Even without a classifier, Clarify should help users. We describe nearestneighbor software support, an execution mode Clarify uses when it has no classifier. The section next describes distributing the work of labeling profiles among a software support community. 5.1 Nearest neighbor software support Clarify needs a certain number of labeled examples to build an accurate machine learning classifier (exact numbers are problemdependent and quantified in Section 7.4). Before it has trained a classifier, Clarify uses nearest-neighbor search to match similar behavior profiles. For instance, users of mpg321 can give their email addresses to a a support website. If a user has a problem that she does not understand, she sends her behavior profile to the site which runs Clarify. The site returns the emails of 5 other users who opted in to the system and who likely experienced the same application behavior. (The system might give out a particular email address only 3 times and take other steps to make sure participants are not overwhelmed with email or put on spam lists.) As the results in Section 7.6 show, nearest-neighbor search is sometimes highly effective, but it is not as accurate in general as building a classifier. 5.2 Labeling behavior profiles The Clarify classifier must be built from labeled behavior profiles. There are three ways this labeling can be done.
• Members of a support organization can do all labeling. This
approach is human resource intensive, but provides high-quality labeling. • End-users can label their profiles, distributing the work across
many more people, but enabling malicious or inept users to add noise in the form of incorrect labels. End-user contributions can be graded by support staff or by peer reputation (like what is done on current support websites). • Support engineers can write scripts to generate many variant
inputs for each problem. All inputs exercise the same problem, so they all share the same label. We use this method to evaluate Clarify. It requires the most expertise, and the inputs are not guaranteed to accurately model real-life inputs.
6. Benchmarks Clarify is intended to improve the error reporting of complex, black-box software components. To evaluate Clarify, we choose benchmarks that are common, heavily-used programs for which non-exotic error conditions lead to misleading or non-existent error messages. That common utilities provide shoddy error reporting makes clear the motivation for Clarify. We also use Clarify on programs that span the kernel/user boundary, containing user-level code that interacts with kernel modules. Interaction across a protection boundary creates challenges for error reporting due to fixed interfaces and the difficulty of passing memory objects across the boundary. This section summarizes the benchmarks and the kinds of problematic errors they report. We explain the behavior underlying the error reports—it is this underlying behavior that Clarify is intended to discover. 6.1 User-level programs gcc. The GNU C compiler is a popular compiler, containing both hand-written and automatically generated source code. Our experiments use version 3.1, executing only the compiler (the cc1 phase), using the “.i” file output of the pre-processor, drawn from a pool of 4,070 files pre-processed from the Linux kernel 2.6.13 distribution. A corruptor script randomly modifies correct source code to exhibit mistakes from four error classes: adding a semicolon after an if() that has an else clause, causing the compiler to fail on the else; omitting the closing curly bracket of a switch block causing an “end of file” error; deletion of a semicolon, yielding a generic syntax error, often on a very different line from the removed semicolon; misspelling a keyword which also generates a generic syntax error. All error classes result in confusing and imprecise error messages. mpg321. mpg321 is an mp3 player for Linux. This benchmark has three failure modes: file format error (e.g. trying to play a wav file as if it were an mp3), corrupted tag (mp3 metadata is stored in ID3 format tags, e.g., artist name), corrupted frames (mp3 frame data is corrupt). The Clarify classifier distinguishes between these three failure modes and normal execution. The application itself does not give any consistent error message for any of these error cases. LaTeX. Latex is a typesetting program widely used by the research community. Its error reporting is known to be obscure. Rubber [34] is a tool that filters LaTeX’s output to make it more comprehensible to the user. However, many of LaTeX’s error messages are generic and many have varied root causes, making it difficult for users to understand what went wrong and fix it. Our LaTeX benchmark has 26 ambiguous error cases, too many to summarize here, so we describe one illustrative example. A website [15] contains an explanation of all the classes.
If a table, array or eqnarray has more separator characters (ampersands) than columns, LaTeX prints the obscure error message, “!Extra alignment tab has been changed to \cr”. Most LaTeX books and most LaTeX support websites recommend checking the number of ampersands if a user receives this error. Some websites and books are helpful enough to suggest a missing end of row symbol \\ on the previous line. While forgetting the double backslash will cause the error report, the error report is not unique: misuse of the \cline command (a directive that draws a horizontal line in the table) will result in the same message if one of the arguments to \cline refers to a non-existent column in the table. Users who make the \cline mistake get an error message that almost all support options say are due to one of two possible causes, even though there is a third possible cause. Error reports are biased to their most likely cause, leaving a user who executes a less likely scenario scratching her head, potentially for a long time.
App. latex81 latex27 mpg321 gcc iptables iproute2 mount
inst.
Er
FP
CSP
CSRV
34,677 11,528 263 1,582 131 146 1,920
81 27 4 5 5 4 5
395 395 128 2,920 56 146 292
6,802 2,191 1,162 57,221 70 475 292
61,202 21,425 11,495 514,973 N/A N/A N/A
PP
CTP
1,504 23,296 1,504 20,761 21,954 1,318 40,513 93,246 N/A N/A N/A N/A N/A N/A
Table 2. Sizes of the Clarify behavior profiles for each benchmark. The second and third columns show the number of instances (program executions) and the number of error classes for each benchmark. The remaining columns show the number of features for each behavior representation. SS is not shown in the table since it always has 9 features. Kernel utilities only generate the first two behavior profiles due to limitations in how the kernel can be instrumented.
6.2 Kernel benchmarks To evaluate the applicability of Clarify across the user/kernel boundary, we chose three benchmarks that depend on both userspace applications and kernel modules: iptables, iproute, and mount. iptables. iptables is a popular open source Linux application that does packet filtering, network address translation, and other packet mangling. The policies for these operations are in kernel-space data structures, while the user application is an interface for the end-user. The error reporting interface between the kernel and the user is netlink. netlink simplifies the interaction between the kernel and userspace, allowing anyone to create a kernel module and use the error reporting infrastructure. But netlink makes the error reporting interface rigid, forcing the kernel to reuse error codes like EEXIST. The EEXIST code means both that a file the user tried to create already exists, and that a new packet handling rule creates a conflict with the current rules. This ambiguity is especially confusing when an attempt to add a new packet handling rule returns the string, “File exists” because that is the default string for the EEXIST error code in the C runtime library. The first behavior class for this benchmark includes the misuse of table SNAT, DNAT, and SAME, all of which produce the generic “Invalid arguments” error. The second class is the misuse of MARK as a jump target, the third class is absence of the kernel module that is necessary to handle the user’s request, and the fourth error class is using a forwarding chain name that does not exist. The kernel returns the same error code for the last three classes, which causes the application to print, “No chain/target/match by that name”. iproute. iproute controls the contents of the kernel routing tables. It has similar problems reporting errors as does iptables because it also uses the netlink error reporting standard. The first error class is adding routing rules that conflict with existing rules; the second is adding an IP address that conflicts with existing IP address; the third is entry of a conflicting routing table entry that should produce an error, but does not due to a bug in the kernel module. The error message for both the first and the second error classes are “RTNETLINK answers: File exists” due to the use of the overloaded return code EEXIST. nfs mount. Mounting a remote NFS server is a complicated operation involving different kernel subsystems and cross-machine communication. It is no wonder that the error reports generated from mount can be cryptic. The first error class is specifying the wrong port number, which produces the unrelated error messages “NFSv3 not supported!” or “Can’t read superblock”. The second error class is a TCP/UDP mismatch between the server and the client, and the third error class is when the server is down. In both cases, the mount program prints “RPC: Program not registered”.
This error message makes some sense because the remote procedure call daemon cannot find the proper program to handle the user’s request, but this might not be obvious to normal end-users. The fourth error class is NFS version configuration mismatch between the server and the client. We tested with NFSv2 and NFSv3. The error message is “RPC: Program/version mismatch; low version = 1, high version = 2”. While the problem detected the NFS version mismatch, the error message reports the wrong version numbers which is likely to confuse a user diagnosing the problem. 6.3 Complexity of Clarify benchmark dataset Table 2 summarizes the complexity of the Clarify benchmark dataset. Each program has at least three ambiguous or misleading error classes and one normal class. Latex27 has 26 ambiguous error classes and 1 normal class. In general, more accurate profiles have more features. For instance, there are 533 functions in latex, but 6,802 call sites, and call-site profiling is more accurate than function profiling. Our benchmarks all have approximately equal number of instances per error type. This distribution is not intended to model the frequency of bugs occurring in the field, but rather trains the classifier to distinguish among the given cases.
7. Evaluation We evaluate Clarify according to four criteria: accuracy, performance, training cost, and scalability. First, Clarify must correctly classify program behaviors that share ambiguous error messages. Accuracy is summarized by the ratio of behavior profiles correctly classified to the total number of profiles (Section 7.1). A perfect classifier would correctly identify each error scenario from the behavior profile for each benchmark. As further validation of our classification models, we examine the decision trees generated by Clarify in Section 7.3. We show that the tree tests program features that intuitively correlate with the observed behavior. The accuracy of Clarify must come at an acceptable performance cost, which is measured in Section 7.2. A successful deployment of the Clarify system should incur minimal overhead costs. Labeled examples can be expensive to collect, as determining the error type of a given instance can require considerable human effort. Section 7.4 shows how many labeled behavior profiles are required to generate a Clarify classifier. In the absence of any labeled data, Clarify employs a nearest-neighbor algorithm, where users are paired with other users who have experienced the same problem (Section 7.6). Section 7.7 shows data about the use of Clarify as deployed in our lab.
App. latex mpg321 gcc iptables iproute2 mount
CSP Forensic 0.6% 0.3% 1.0% 1.1% 4.7% 1.1%
Live 5.3% 1.2% 7.0% 3.2% 7.6% 3.1%
CTP Forensic Live 1.1% 97% 1.3% 67% 9.9% 110% N/A N/A N/A N/A N/A N/A
Table 3. Slowdown of programs running under the Clarify runtime using CSP and CTP for a forensic deployment (which can only classify errors known during training), and a live deployment (which can classify new errors found after deployment).
Finally, section 7.5 examines how the accuracy of Clarify’s classifiers scale with the number of error classes. The robustness of the Clarify classifiers is demonstrated by the relatively high accuracy obtained for the latex benchmark with 81 classes. 7.1 Classification accuracy Clarify uses decision trees to classify. Decision trees are nested ifthen-else statements where each leaf corresponds to a single class prediction. An advantage of decision trees (over more continuous methods like support vector machines) is their ease of interpretation. It is possible for a software engineer to validate the classifier based on knowledge of program structure. Further, in the context of our experiments with Clarify, decision trees are as accurate as other machine-learning methods. Although Clarify’s instrumentation computes thousands of features that describe each program execution, the task of classifying error messages can be accomplished by analyzing only a few features. This can be seen through the relatively small size and high accuracy of Clarify’s decision trees. In contrast, methods that optimize over the entire feature set—e.g. logistic regression or support vector machines—tend to yield overfitted models with lower accuracy. Other algorithms that optimize over only a subset of features, such as rule learning and boosted decision stumps, yield classifiers we found to be competitive with decision trees. Figure 3 shows the accuracy of user and kernel benchmarks, for several different behavior representations. These tables report accuracy using 5-fold cross validation, a standard technique for evaluating classifiers. The dataset is partitioned into five sections, the classifier is trained and tested five times; it is trained on four sections of the data and its accuracy tested on the remaining fifth. The average of these five tests is the reported accuracy of the classifier. The decision trees are built using an implementation of the C4.5 algorithm [32] found in the WEKA machine learning package [39]. Call-tree profiling (CTP) demonstrates the best overall accuracy. Call-site profiling (CSP), path profiling (PP) and CTP have an accuracy of over 85% on every user-level benchmark, and callsite profiling has over 85% accuracy for kernel benchmarks. 85% accuracy is a significant help for improving error reports. To evaluate sampling, we present results for sampling FP and CSP, with a sampling rate of 10% (which is generous for systems that use sampling [27]). For example, the sampled function counts record one of every ten function calls, uniformly at random. The sampled results are the stippled part of each bar, achieving lower classification accuracy than non-sampled data for almost every benchmarks. The poor accuracy of sampling confirms our intuition that sampling is the wrong approach for classifying program behavior, because Clarify must be sensitive to rare events.
7.2 Performance Table 3 shows the performance of live and forensic deployments of call-site profiling. All timing runs are on a dual-processor Intel Xeon 3.0GHz with 2GB of RAM. Because there is no freely available static binary translator for the x86 architecture, the experiment modifies the assembly code of the programs to count call sites in exactly the way a binary modification tool would do it. On the x86 a count with a known address can be incremented with a single instruction. The counters reside in a memory mapped file, so the results can be collected after program termination. Each benchmark runs several inputs to obtain a running time that is long enough to measure accurately: gcc compiles the 23 largest .i files from the Linux 2.6.16 distribution, mpg321 decodes 256 frames of 200 mp3 files, and LaTeX processes 5 files with a total of 27,587 lines. We average the user time of three executions. The remaining rows in Table 3 show benchmarks run on the 2.6.17 version of the Linux kernel. The kernel behavior profile is built using the kprobes [24], a dynamic instrumentation package that is standard in Linux. Kprobes uses breakpoints so it is a more expensive form of instrumentation. We use it to collect only function profiling and call-site profiling. Performance overhead is low for call-site profiling, both for forensic and live deployments. The live deployment overhead for call-site profiling is modest, less than 7.6%. The live deployment overhead for CTP is much higher. Live deployment requires instrumenting the entire binary, while forensic deployment chooses features that training runs indicate are necessary to disambiguate a known set of problems and that are cheap to collect, e.g., they reside in functions that are called infrequently. We use a published machine learning algorithm [19] that uses training data to find the minimum cost tree whose accuracy is within 1% with our costoblivious tree. The increase in performance from live to forensic for CTP is dramatic. The overhead of CSP is smaller to begin with, so the reduction is smaller, but the forensic overhead of CSP for user-level programs is less than 1%. The high cost of breakpoints in the kernel accounts for the higher overhead relative to user-level programs. Forensic deployment is an effective means of deploying richer behavior profiles like CTP at reasonable levels of performance cost. 7.3 Verifying the machine learning model Machine learning algorithms train classifiers without any domain knowledge regarding the underlying semantics of the program’s behavior. It is possible for a classifier to fail miserably on unseen data because the classifier examines features that are semantically unrelated to the behavior it classifies. To make sure that Clarify classifiers use program features that intuitively relate to the behaviors they classify, we examined several classifiers by hand. Classifiers trained using function profiling and call-tree profiling for the mp3 player mpg321 are shown in Figure 4. The trees show how each behavior profile provides different clues to the classifier about the same underlying behavior. The function profiling tree is composed of a simpler set of rules that depict differences in control flow across the four error classes. At the root of the tree, the function mad layer III provides near perfect discriminative information for the ’wav’ error class: the mad layer III routine is part of the libmad library and is called when the audio frame decoder runs. Since the wav format is among the formats not supported by mpg321, it will not successfully decode any audio frames, and the libmad library will never call mad layer III. The id3 tag delete routine differentiates between the corrupted tag and and other classes. The ID3 tag parser in the libid3tag library dynamically allocates memory to represent tags and frees them with id3 tag delete. If tag parsing fails, the memory for a tag is not allocated. Since no tag parsing
100 95 90 85 80 75 70 65 60 55 50 45
100 95 90 85 80 75 70 65 60 55 50 45 40 35
CSP PP CTP CSRV SS latex81
latex26
gcc
FP
Accuracy (%)
Accuracy (%)
FP
CSP
iptables iproute2 mount
mpg321
Figure 3. The figure shows the accuracy of the classifier used to distinguish the error cases, based on behavior profiles, for each benchmark. For each benchmark a classifier is built using different behavior profiles: function profiling (FP), call-site profiling (CSP), path profiling (PP), call-tree profiling (CTP), call-site profiling with predicated return values (CSRV), and stack scraping (SS). The figure also presents sampled versions of function profiling and call site profiling with a sampling rate of 10% (in the stippled, lower bar in the stacked FP or CSP entry). succeeds in the corrupted frames case, id3 tag delete is never called to free the tag memory, making its absence discriminative for that class. The libmad audio library’s default error handler error default is used if the application does not specify one. mpg321 does not specify its own error handler, so the presence of the function indicates corrupted audio frames, and its absence indicates the corrupted id3 tags case. Finally, III freqinver, which performs subband frequency inversion for odd sample lines, is called very frequently as part of the normal process of decoding audio frame data. When there are corrupted frames, this function is called less frequently, and the decision tree algorithm finds an appropriate threshold value to separate the normal from the corrupted case. The decision tree built on call-tree profiling data has a richer combination of data sources than function profiling. Call-tree profiling uses the presence of the libmad library function III sideinfo (which decodes frame side information from a bitstream) calling the utility function mad bit read as an indicator of successful audio frame decoding. The lack of that calling pattern reliably indicates a file format error. The corrupted frames class is once again differentiated from the normal class by a threshold value on a subtree of libmad functions that will only be called during successful decoding of audio frame data, such as III scalefactors, the discrete cosine transform function fastsdct, III huffdecode, and so on. The libmad function scan encapsulates the process of reading mp3 files. A CTP rule (decoded bitvector) wherein scan calls a function that calls a number of low-level stream manipulation routines such as madbit read, and mad timer set, and so on, provides discriminative power in combination with a similarly complex control flow pattern in main for the corrupted tags error class. The decision tree node whose CTP rule involves main, id3 get tag, and so on differentiates between normal and error conditions for the handling of ID3 tags, while the decision tree node whose CTP rule involves scan discriminates between successful and unsuccessful audio decoding. The high level pattern exposed by these rules is the combination of failed ID3 tag parsing with successful audio decoding, which precisely describes the corrupted tag error class. 7.4 How many labeled behavior profiles are needed? The classifiers used by Clarify are trained with labeled behavior profiles. Labeling profiles generally requires human effort, so it should be minimized. In general, classifiers trained with fewer labeled training instances will result in less accurate models. In this
# Classes 10 20 35 50 65 81
Accuracy 97.8 % 97.5 % 94.9 % 94.3 % 93.9 % 93.6 %
Creation Time 25min 1hr 37min 6hr 2min 10hr 26min 11hr 50min 18hr 28min
Table 4. The accuracy and time to create the classifier as the number of behaviors is increased in the LaTeX benchmark. section, we investigate the tradeoff between classification accuracy and the amount of training data used in building the classifier. Figure 5 plots the classification accuracy of the latex benchmark as a function of the number of instances used in training (the benchmark includes 75 of the 81 distinct error classes) . The C4.5 algorithm used to build the decision tree is surprisingly robust: with as few as 15 examples per class, the algorithm achieves an accuracy of 86%. Looking at the legend in Figure 5, we can see that to achieve accuracy within 1% of the maximum, only a small subset of the training data is required. For example, gcc needs only 105 instances to attain the accuracy level of 88.9% which is within 1% of the accuracy reached when we use all of the 300 available examples per class. A human does not need to label each behavior profile individually. For our training sets we use a script to induce errors in the program input, producing large numbers of training examples with little human involvement. However, inducing errors by a script is not necessarily an accurate model for the errors that Clarify would see in deployment. 7.5 Scalability In this section we analyze how Clarify scales as the number of error classes increases. LaTeX has 247 unique error messages, and we evaluate the scalability on 81 behavior classes—about one third of all possible LaTeX errors. Table 4 shows how model creation time and classification accuracy scale as the number of error classes increases. We consider subsets of error classes with varying sizes. For each size, we picked 10 random subsets of error classes and ran our experiments. The curves shown in the graph are the average of the results for each size. We can see that as the number of error classes increases the accuracy drops from 97.8% to 93.6%. This decrease is acceptable
Function profiling 100 90
Percentage Accuracy
80
Call-tree profiling
70 60 50 latex81 gcc mpg321 nfs iproute iptables
: 110 : 105 : 38 : 35 : 30 : 10
20 30 40 50 60 70 80 Number of Instances Per Latex Error Class
90
40 30 20 10 0 0
10
100
Figure 5. The curve shows how the accuracy increases as the number of training instances per error class is increased. The dataset is the latex benchmark with 75 classes. The text on the graph gives the minimum number of training instances needed for a benchmark to achieve accuracy within 1% of accuracy obtained using all the training data.
Figure 4. Decision trees produced for the mpg321 benchmark. Dotted lines are taken when the normalized count of the feature value is less than or equal to a threshold, while the solid line is taken when it is greater than the threshold. The threshold is determined automatically for each benchmark by the decision tree algorithm, and can be different for each node in the tree. Clear boxes are features. FP features are normalized function counts, and call-tree profiling features are normalized counts of CTP subtrees (represented by the symbolic tree names in brackets, with function names for nodes in each call tree). Shaded boxes are error classes.
considering that the number of behaviors has increased by a factor of 8. The training time of the model increases from under 30 minutes to more than 18 hours as the number of error classes increases from 10 to 81. This increase does not hinder scalability since the model is trained offline. Of greater practical concern is the execution time needed to evaluate the decision tree, as this largely determines the amount of processing done at the client end. Our experiments show that the time to execute the models averaged 10ns, with a maximum of 21ns, which is imperceptible for almost any application. Clarify scales to nearly one hundred error behaviors without much loss in accuracy or substantial increase in processing time. 7.6 Nearest neighbor software support In contrast to the decision trees used by Clarify’s classifiers which rely on only a small subset of all features, nearest-neighbor algorithms rely on averages over all features. For example, the Euclidean distance between two instances, a popular metric used for nearest-neighbor searches, is a function of the average of the squares of the difference between each pair of feature values. Such
App.
FP
CSP
CTP
CSRV
latex26 mpg321 gcc iptables iproute2 mount
0.75 2.22 2.73 1.12 3.10 2.71
1.01 4.21 2.67 1.03 2.77 2.40
0.52 1.52 2.19 N/A N/A N/A
0.93 1.40 0.97 N/A N/A N/A
Table 5. In the absence of labeled training data, Clarify uses a nearest-neighbor algorithm with linear-regression based feature scaling. This table shows the expected number of correctly classified neighbors for a five-nearest-neighbor search.
distance functions are particularly susceptible to differences of scale among the various features. In Clarify, features take on vastly different scales: some features may have a count under ten, while others may have upwards of one million occurrences. Furthermore, for some features, the count is a function of the length of the program execution, and for others it is independent of program execution. For example, a parsing-related feature for gcc will be called many more times for a longer file that contains many repetitions of particular construct, than a shorter file. Some sections of code—e.g. initialization functions—will be called a (roughly) constant number of times and thus will take on values independent of the program execution length. To overcome such scaling challenges, Clarify employs a linear regression-based feature scaling method. For each feature y, a least-squares line is fitted to correlate each feature value with its corresponding program execution length x (defined as the sum of all feature values of a given execution instance). The feature value is normalized to be the scaled difference between the feature value y and the fitted feature value f (x). The scaling factor is determined such that the variance of each resulting feature is one. We note that for features that have no correlation with program length, the linear regression step will have no effect on the final normalized feature values. Table 5 gives the expected number of correctly classified neighbors for a nearest neighbor search returning five neighbors. Eu-
clidean distance is used. For some benchmarks with many classes (the LaTeX benchmark in table 5 has 27 classes), accuracy of the nearest-neighbor search is somewhat lower. In such cases, a larger number of neighbors should be returned. 7.7 Deployment To begin understanding the performance of Clarify in a deployed environment, we created a version of LaTeX that includes static instrumentation and a small runtime to generate call-site information. We deployed the version of LaTeX to a user base of 6 users over a period of 3 weeks. Our deployed version of LaTeX encountered 57 distinct error inputs ranging over 17 error classes and was able to classify 46% (26/57) of them correctly. LaTeX has 247 error messages—the experiment was not limited to unclear or ambiguous messages. Classifying nearly 50% of a program’s behavior correctly is much more difficult than disambiguating a small number of error behaviors.
8. Related work We first contrast Clarify to several systems that appear similar. Clarify improves error reporting by classifying program behavior, it does not find program bugs [20, 27, 1, 14]. An ambiguous error message or return code might meet the specification for a program (e.g., the netlink standard for error reporting). Clarify does not attempt to find the root cause of program faults [12, 31], misconfigurations [38, 25], or program crashes [10, 29, 30, 7]. Its aim is to classify the application behavior to help the developer or end-user get better error reports when these events happen. The remainder of this section compares Clarify with problem diagnosis systems, and systems that classify program behavior. Clarify does help software problem diagnosis and it classifies program behavior. 8.1 Problem diagnosis systems A group at Microsoft Research correlates low-level system events with error reports to automate problem diagnosis [40, 41], just as Clarify does. They currently focus only on forensic deployments (in our terminology), and on building models from sequences of system calls. Clarify uses control-flow and data from the program, which allows it to deal with errors that involve only user code. Ph [36] also uses sequences of system calls to build a model, though their model detects host intrusions. While system calls are a good representation of certain types of program behavior, many programs make few systems calls (e.g., SPEC). Because every named system call has wrapper functions from user-space libraries, Clarify can detect system calls by detecting function calls to the wrapper functions, giving it a richer input source to determine program behavior. Statistical bug isolation [27, 26] correlates low-level application behavior with application behavior (bugs) and builds a model, as Clarify does. Statistical bug isolation requires a special compiler to insert invariant checks into the program, while Clarify records a small amount of control-flow and data continuously. Statistical bug isolation samples the invariants it inserts to get good performance. Section 7.1 demonstrates a sharp loss of accuracy if Clarify uses sampling. Statistical bug isolation must eliminate sub-bug and super-bug predictors; Clarify has an analogous struggle to gain enough training instances to isolate the program behavior created by the error condition. The systems could be used together to gather statistical data on crashes and provide better error messages for crashes and other misbehaviors. DIDUCE [20] uses dynamic program invariants to detect program behavioral anomalies. The anomalies can indicate program bugs, but at a performance slowdown of 6–20×. Clarify is much faster and can classify program behavior that is not anomalous.
Stack backtraces are used by many remote diagnostic systems like Dr. Watson [29], Microsoft’s online crash analysis [30] and GNOME’s bug-buddy [7]. IBM has a system to classify stack backtraces harvested on a crash [10], and the technology has been deployed in their TrapFinder tool. Their motivation is similar to Clarify’s—reduce the human effort needed to match problems from different program executions. Clarify diagnoses a wider range of problems than crashes, and it operates on behavior profiles, which are a richer source of data than stack backtraces. 8.2 Classifying program behavior Classifying program behavior has received attention in the software engineering literature. Podgurski et al. [31] identify a similar motivation to Clarify and they also investigate gcc behavior. Clarify is more accurate (over 85–100% accurate, as compared to 24– 96%), and is more of a complete system, designed to address the problem of improving error reporting. Bowring et al. [8] models software behavior as Markov models using control flow between basic blocks and then uses active learning to cluster the models. Markov models use probabilities which make them insensitive to rare events. Clarify needs sensitivity to rare events because rare events often characterize an error behavior—see the sampling results in Section 7.1. Bowring et. al. evaluate their method on 33 versions of SPACE, which is a very small 6,200 line program. Liu et al. [28] use program behavior graphs as features for a machine-learning model just as Clarify uses data related to program control flow. The number of program behavior graphs grows quickly with program size, and can become computationally intractable even for the small Siemens programs [23] used to evaluate their method. SimPoint [35] characterizes the phase behavior of applications using basic block execution counts to maintain the accuracy of architectural simulation while executing fewer instructions. The types of program behavior it detects are coarse-grained and occurs over much longer time windows than the errors that Clarify detects. SimPoint can reduce its dataset to 15 dimensions and maintain phase-detection accuracy. Clarify’s classifiers must be sensitive to small, localized changes in behavior that form the signature of an error behavior. As seen in Table 2, Clarify’s representations have tens of thousands of features. We verified that using random projection to reduce the feature count, like SimPoint does, dramatically reduces Clarify’s accuracy. Program paths [5] have been used to analyze runtime program behavior. Path Spectra [33] approximate an execution’s behavior with the occurrence (or frequency) of the individual paths. Spectral differences have been used to identify the portions of a program’s execution that differ with different inputs, notably, during Y2K testing [21]. Path Spectra focused on identifying path differences between several program runs, whereas Clarify’s novel use of path profiling uses machine learning to identify which paths are common to each error class. Clarify’s call-site profiling is much more efficient and nearly as accurate as path profiling.
9. Conclusion We present Clarify, a system that improves the error reporting of black-box systems, e.g., third-party libraries, the operating system, and external programs. Our Clarify prototype accurately and efficiently classifies the behavior of all of these systems, enabling improved error reporting.
Acknowledgments Thanks to William Cook for help with writing. Thanks to Peter Stone, Raymond Mooney and Kathryn McKinley for feedback on earlier drafts of the paper. This research has been supported
by a gift from Microsoft’s Phoenix compiler group, a DARPA grant from the architectures for cognitive information processing program, and by NSF grant CNS-0615104.
[22] J. Humphreys and V. Turner. On-demand enterprises and utility computing: A current market assessment and outlook. Technical report, IDC, Jul 2004.
References
[23] M. Hutchins, H. Foster, T. Goradia, and T. Ostrand. Experiments on the effectiveness of dataflow- and controlflow-based test adequacy criteria. In ICSE, 1994.
[1] M. K. Aguilera, J. C. Mogul, J. L. Wiener, P. Reynolds, and A. Muthitacharoen. Performance debugging for distributed systems of black boxes. In SOSP, Bolton Landing, NY, Oct. 2003.
[24] Jim Keniston and Prasanna S Panchamukhi. Kernel Probes (Kprobes), 2006. Documentation/kprobes.txt.
[2] G. Ammons, T. Ball, and J. R. Larus. Exploiting hardware performacne counters with flow and context sensitive profiling. In PLDI ’97, pages 4–16, June 1997.
[25] N. Lao, J. Wen, W. Ma, and Y. Wang. Combining high level symptom descriptions and low level state information for configuration fault diagnosis. In LISA, 2004.
[3] Andrew Ayers, Christopher Metcalf, Junghwan Rhee, Richard Schooler, Anant Agarwal, and Emmett Witchel. Traceback: First fault diagnosis by reconstruction of distributed control flow. In PLDI, June 2005.
[26] B. Liblit, A. Aiken, A.X. Zheng, and M. I. Jordan. Bug isolation via remote program sampling. In PLDI, 2003.
[4] V. Bala, E. Duesterwald, and S. Banerjia. Dynamo: a transparent dynamic optimization system. In PLDI, pages 1–12, 2000. [5] T. Ball and J. R. Larus. Efficient path profiling. In MICRO, 1996. [6] R. Barrett, E. Haber, E. Kandogan, P. P. Maglio, M. Prabaker, and L. A. Takayama. Field studies of computer system administrators: Analysis of system management tools and practices. In ACM CSCW (Computer-supported Cooperative Work), 2004. [7] J. Berkman. Bug-buddy — GNOME bug-reporting utility, 2004. http://directory.fsf.org/ All_Packages_in_Directory/bugbuddy.html. [8] J. F. Bowring, J. M. Rehg, and M. J. Harrold. Active learning for automatic classification of software behavior. In ISSTA, Jul 2004. [9] Justin Brickell, Donald E. Porter, Vitaly Shmatikov, and Emmett Witchel. Secure remote software diagnostics, Under review. [10] M. Brodie, Sheng Ma, G. Lohman, L. Mignet, N. Modani, M. Wilding, J. Champlin, and P. Sohn. Quickly finding known software problems via automated symptom matching. In ICAC’05, pages 101–110, 2005. [11] Derek Bruening, Timothy Garnett, and Saman Amarasinghe. An infrastructure for adaptive dynamic optimization. In CGO-03, 2003.
[27] B. Liblit, M. Naik, A. X. Zheng, A. Aiken, and M. I. Jordan. Scalable statistical bug isolation. In PLDI, 2005. [28] C. Liu, X. Yang, H.Yu, J. Han, and P. S. Yu. Mining behavior graphs for ”backtrace” of noncrashing bugs. In Proc. of 2005 SIAM Int. Conf. on Data Mining (SDM05), 2005. [29] Microsoft Corporation. Dr. Watson Overview, 2002. http://www. microsoft.com/TechNet/prodtechnol/winxppro/ proddocs/drwatson_overview.asp. [30] Microsoft Corporation. Online Crash Analysis, 2004. http:// oca.microsoft.com/. [31] A. Podgurski, D. Leon, P. Francis, W. Masri, M. Minch, J. Sun, and B. Wang. Automated support for classifying software failure reports. In ICSE, 2003. [32] R. Quinlan. C4.5: programs for machine learning. Morgan Kaufmann Publishers, 1992. [33] T. Reps, T. Ball, M. Das, and J. Larus. The use of program profiling for software maintenance with applications to the year 2000 problem. In M. Jazayeri and H. Schauer, editors, ESEC/FSE 97, pages 432–449. Springer–Verlag, 1997. [34] Rubber. http://www.pps.jussieu.fr/˜beffara/soft/ rubber, 2007.
[12] Y. Brun and M. D. Ernst. Finding latent code errors via machine learning over program executions. In ICSE, 2004.
[35] Timothy Sherwood, Erez Perelman, Greg Hamerly, and Brad Calder. Automatically characterizing large scale program behavior. In ASPLOS, Oct 2002.
[13] Bryan Cantrill and Mike Shapiro and Adam Leventhal. Dtrace, 2006. http://www.genunix.org/wiki/index.php/ DTrace_FAQ.
[36] A. Somayaji and S. Forrest. Automated response using system-call delays. In Proceedings of 9th Usenix Security Symposium, August 2000.
[14] Trishul M. Chilimbi and Vinod Ganapathy. Heapmd: Identifying heap-based bugs using anomaly detection. In ASPLOS ’06, 2006.
[37] Ariel Tamches and Barton P. Miller. Fine-grained dynamic instrumentation of commodity operating system kernels. In OSDI, pages 117–130, 1999.
[15] Latex Error Classes. http://www.cs.utexas.edu/users/ habals/clarify/latex_errors.html, 2006. [16] Microsoft corporation. Privacy statement for the microsoft error reporting service, 2006. [17] Microsoft corporation. Reporting and solving computer problems, 2006.
[38] H. J. Wang, J. C. Platt, Y. Chen, R. Zhang, and Y. Wang. Automatic misconfiguration troubleshooting with PeerPressure. In OSDI, 2004. [39] I. Witten and E. Frank. Data Mining: Practical machine learning tools with Java implementations. Morgan Kaufmann, San Francisco, 2000.
[18] Microsoft Corporation. What information is sent to Microsoft when I report a problem?, 2006.
[40] C. Yuan, N. Lao, J. Wen, J. Li, Z. Zhang, Y. Wang, and W. Ma. Automated known problem diagnosis with event traces. MSR-TR2005-81, 2005.
[19] Jason V. Davis, Jungwoo Ha, Christopher J. Rossbach, Hany E. Ramadan, and Emmett Witchel. Cost-sensitive decision tree learning for forensic classification. In ECML, 2006.
[41] C. Yuan, N. Lao, J. Wen, J. Li, Z. Zhang, Y. Wang, and W. Ma. Automated known problem diagnosis with event traces. In EuroSys, 2006.
[20] S. Hangal and M. S. Lam. Tracking down software bugs using automatic anomaly detection. In ICSE, 2002.
[42] Xiaotong Zhuang, Mauricio J. Serrano, Harold W. Cain, and JongDeok Choi. Accurate, efficient, and adaptive calling context profiling. In PLDI, 2006.
[21] M. J. Harrold, G. Rothermel, K. Sayre, R. Wu, and L. Yi. An empirical investigation of the relationship between fault-revealing test behavior and differences in program spectra. In Journal of Software Testing, Verification and Reliability, vol 10, no 3, 2000.