1248
MONTHLY WEATHER REVIEW
VOLUME 126
Improved Hurricane Track Forecasting from the Continuous Assimilation of High Quality Satellite Wind Data L. M. LESLIE,* J. F. LEMARSHALL,1 R. P. MORISON,* C. SPINOSO,# R. J. PURSER,@ N. PESCOD,1 AND R. SEECAMP1 *School of Mathematics, University of New South Wales, Sydney, New South Wales, Australia 1Bureau of Meteorology Research Centre, Melbourne, Victoria, Australia #Royal Melbourne Institute of Technology, Melbourne, Victoria, Australia @National Centers for Environmental Prediction, Washington, D.C. (Manuscript received 12 September 1996, in final form 28 May 1997) ABSTRACT Despite recent improvements in the accuracy of hurricane track forecasts, mean position errors still remain unacceptably large. For example, recurvature is captured poorly by forecast models and can produce excessively large position errors. This study addresses the problem of hurricane track forecasting in three ways. First, the initial conditions for the forecast model are augmented by a dense coverage of high spatial and temporal resolution satellite-derived wind vectors. Second, to gauge the extent to which this additional four-dimensional detail of the atmospheric structure can be exploited, three distinct types of data assimilation methods are examined. These are 1) conventional (intermittent, cycled) 6-h assimilation, 2) nudging over a 12- or 24-h period up to the initial time, and 3) recently developed barotropic and four-dimensional variational assimilation schemes, also over a 12- or 24-h period. The nudging and variational methods are continuous assimilation procedures and incorporate satellite-derived winds, typically at 6-h frequencies, but up to hourly frequencies in trials over the Australian region. Over the Atlantic basin, only a 6-h frequency of high-density satellite-derived wind vectors was available for the 1995 season. Third, a very high-resolution (15 km) semi-implicit, semi-Lagrangian model provided forecasts out to 72 h. The present study describes the direct application to the Atlantic basin, for the specific case of Hurricane Opal, of data assimilation and prediction procedures developed for tropical cyclones over the Australian Pacific basin. A series of forecasts was made, from the two initial times 0000 and 1200 UTC 2 October 1995, respectively. In these cases, where CLIPER (climatology and persistence) and other conventional forecast guidance was poor, the nudging and variational assimilation procedures, which were those that best utilized the high spatial and temporal resolution satellite-derived winds, produced greatly improved forecasts.
1. Introduction As numerical weather prediction and tropical cyclone track forecasting are largely initial value problems, much emphasis over the years has been placed on improving the initial conditions for forecast models in a number of ways. These include using enhanced observational databases such as satellite-derived wind fields from GOES-8 and GMS-5, development and testing of a range of assimilation methods, and improving the numerical weather prediction (NWP) model used for forecasting hurricane tracks, in terms of both the NWP model numerical formulation and the representation of physical processes in the model. In this study, most of the emphasis will be placed on the impact of high quality satellite-derived wind data and effective assimilation methods for the data. Since
Corresponding author address: L. M. Leslie, School of Mathematics, University of New South Wales, Sydney 2052, Australia. E-mail:
[email protected]
q 1998 American Meteorological Society
the early 1980s, enhanced cloud and water vapor drift winds have been used to improve numerical forecasts of tropical cyclones in the Australian region (Le Marshall et al. 1985; Mills et al. 1986). Improvements in tropical cyclone track forecasting, using these winds, has also been demonstrated for the Atlantic basin by, for example, Velden et al. (1992). Higher spatial density cloud drift winds, generated by the TCM-90 experiment (Elsberry 1990) have been shown to improve the accuracy of numerical cyclone track forecasting in the northwest Pacific, when used with both nudging and barotropic variational assimilation schemes (Bennett et al. 1993). In very recent experiments over the Australian region, it has been shown that the use of hourly GMS5 winds with the variational assimilation technique of Bennett et al. (1993) led to improvement in the accuracy of tropical cyclone track forecasting in a case study of Tropical Cyclone Rewa in the Coral Sea (Le Marshall et al. 1996a). The work of Bennett et al. (1993) has now been extended from barotropic to full baroclinic models in the context of a 4D variational assimilation
MAY 1998
LESLIE ET AL.
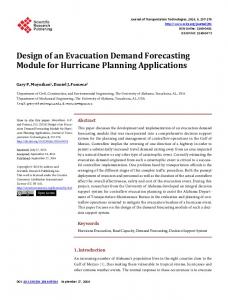
FIG. 1. Schematic depiction of the data assimilation and forecast procedures used in this study. The assimilation period is shown as 24 h in this case.
procedure (Bennett et al. 1996). They showed that higher spatial density winds can improve hurricane track forecasts with 4D variational assimilation. The data assimilation procedure is shown schematically in Fig. 1. Here, the aim has been to apply the techniques used in the above studies to the Atlantic hurricane season of 1995, to one very significant storm, Hurricane Opal, in a period for which forecast guidance was not good and CLIPER (climatology and persistence, Morison 1993) was very poor. Both 6-h intermittent and continuous data assimilation techniques were used, with the continuous data assimilation procedures including the widely used nudging scheme and also the new 4D variational assimilation approach. One of the novel features of this recent work has been the use over the Atlantic hurricane basin of very high spatial density data, namely 6-h data generated in real time using GOES-8 imagery. The results from a total of 23 tropical cyclone forecasts, using a variety of databases and data assimilation techniques, are reported here. They provide very strong evidence of the benefits that assimilating high spatial and temporal resolution cloud drift wind data can have on tropical cyclone track forecasting. Some of the forecasts come from three different and acknowledged ‘‘difficult to predict’’ tropical cyclones in the Australian region, where the work was initiated, but the main emphasis here is on the application of this work to Hurricane Opal from the 1995 Atlantic hurricane season. 2. The satellite wind observations In the Australian region, GMS stretched VISSR (Visible and Infrared Spin Scan Radiometer) images from GMS-5 are received hourly (and four times per day, halfhourly) at the Bureau of Meteorology and are calibrated, navigated, and stored on cyclic datasets in the Australian region McIDAS system (Le Marshall et al. 1987). Images are automatically scanned to determine suitable cloud fields for automatic tracking using forecast winds from the operational limited-area prediction scheme (Puri et al. 1992) to provide a first guess displacement. Selected targets are tracked automatically, then a lagged correlation technique is used to estimate vector displacement.
1249
Winds are generated six hourly for operational use (Le Marshall et al. 1992, 1994) and produced hourly, in real time, using both infrared and visible imagery (Le Marshall et al. 1996a). The infrared images are used to produce hourly winds throughout the day, and the visible images are used to produce hourly and 6-h wind sets during daylight hours, based on images of 1.25-km resolution and subsampled 5-km resolution. The 24 1h wind datasets typically provided more than 2000 lowest error category wind vectors over the 24-h data assimilation periods for both the nudging and variational assimilation schemes used in recent Australian tropical cyclone motion studies. In the North American region, GOES-8 IR and (6.7 mm and 7.3 mm) water vapor imagery has been used to produce 6-h datasets of about 2000 wind vectors at times centered on 0000, 1200, and 1800 UTC. This high spatial density data forms the basis of the data impact experiments carried out in the present study of the predictability of Hurricane Opal. 3. The Australian experience In a recent Australian region (AR) study of tropical cyclone track forecasting, we have improved the initial conditions for such forecasts by using enhanced hourly wind fields and a range of data assimilation methods (Le Marshall et al. 1996b). We also used a high-resolution forecast model (Leslie and Purser 1995). In this AR study, track forecasts for Tropical Cyclones Beti, Olivia, and Ethel, which occurred during the 1995–96 season were examined. All of these tropical cyclones were recurving cyclones and the recurvature was poorly predicted by the operational models. Using 1-h and 6h cloud drift wind data and the operational tropical analysis, a range of data assimilation methods was examined. Forecasts based on the operational tropical analysis (Puri et al. 1992), the control, 6-h and 1-h nudging, 1-h barotropic variational assimilation, and 1-h 4D variational assimilation have been compared. The assimilation and forecasts were performed at 15-km resolution. The grid used for Tropical Cyclone Beti, for example, covered the domain 58–358S, 1458–1758E, approximately. a. The experiments For Tropical Cyclone Beti, the experimental methodology was as follows. The control forecast was generated from the 0000 UTC 26 March 1996 Australian Bureau of Meteorology (BoM) tropical analysis (Davidson and McAvaney 1981) using the forecast model developed by Leslie and Purser (1995) and described in detail there. There were four assimilation experiments. Six-hourly nudging was performed using the BoM’s 6-h tropical analyses for the period 0000 UTC 25 March 1996 to 0000 UTC 26 March 1996. The 6-h cloud drift winds were assimilated at 0000, 0600, 1200,
1250
MONTHLY WEATHER REVIEW
1800 UTC 25 March and at 0000 UTC 26 March 1996. The forecasts were nested in the BoM’s tropical analysis and prediction scheme (TAPS) (Puri et al. 1992). The barotropic variational assimilation system was run using the BoM’s tropical analyses to provide an 850–200-hPa deep-layer mean field, with the variational assimilation being used to incorporate the deep-layer mean winds into the system. The model and its inverse were used to find the appropriate starting point for the barotropic forecast, commencing at 0000 UTC 26 March 1996. Details of this forecast system are in Bennett et al. (1993). Hourly nudging was performed by first using 6-h nudging from 0000 UTC 25 March to 0000 UTC 26 March and then analyzing the hourly winds into the hourly baroclinic model output fields generated during this process. The model again was started at 0000 UTC 25 March and the forecast nudged toward these hourly analyses as it progressed through the 24-h time period. Divergence damping (Haltiner and Williams 1980) was used to great effect during this process to suppress the spurious generation of gravity waves in the nudging and the other data assimilation schemes, before producing a 48-h forecast based on the evolved model state at 0000 UTC 26 March 1996. The choice of the coefficient in the divergence damping approach is largely empirical but here two guidelines were used: the diffusive length scale should be about 1000 km in 24 h as was the case in Bennett et al. (1996), and the final value of the coefficient was chosen by testing a range of values until the gravity waves were sufficiently damped and simultaneously there was little change in other indicators such as the global root-mean-square divergence and the total precipitation. The final forecast generated in this experiment was a 4D variational assimilation forecast, as referenced in section 1 above. It used tropical analyses from 0000 UTC 25 March 1996 to 0000 UTC 26 March 1996. Forecast boundary conditions were derived from the TAPS, which provides operational forecasts out to 48 h each day. Twenty-four hours of hourly visible and infrared cloud drift winds were incorporated asynoptically during the 4D model initialization. The model configuration (except for the barotropic forecasts) used in these studies was 25 levels, 180 3 180 grid points over the domain previously noted. Similar methodologies were used for the Tropical Cyclone Olivia and Ethel cases, with forecasts being commenced at 0000 UTC 9 April and 0000 UTC 10 March 1996, respectively. b. Results For Tropical Cyclone Beti, which developed to the north of New Caledonia, the operational guidance material was, in general, poor, moving the cyclone too far to the west. In this study, the forecasts from the control model run and the 6-h nudging technique, using the BoM’s tropical analyses and 6-h winds, also show poor agreement with the operational best track data (B) (Fig. 2a). It is clear that the control and the 6-h nudging
VOLUME 126
forecasts only partially reflect the cyclone’s recurvature in the 24-h period to 2300 UTC 25 March. The three forecasts using hourly observations namely, the 1-hourly nudging, the 1-hourly barotropic variational assimilation, and the 1-hourly 4D variational assimilation show greater recurvature and are in far better agreement with observed storm track. All tracked south during the first 24 h, and, in the case of 1-h nudging and 4D variational assimilation, passed over the western tip of New Caledonia. Position errors in Table 1 are compared to the related CLIPER forecast. The CLIPER forecasts were generated using the Australian tropical cyclone workstation with the characteristics of the CLIPER forecast model being described in Morison (1993). In the case of Tropical Cyclone Olivia, which had its genesis on the northwest coast of Australia, the operational guidance material was again poor, recurving the cyclone toward the coast but with poor timing of landfall. It is clear that both the control and the 6-h nudging forecasts (Fig. 2b) fail to capture accurately the cyclone’s movement (O) in the 48-h period to 0000 UTC 11 April. The three forecasts using the hourly observations and the BoM’s tropical analyses, namely, the hourly nudging, the hourly barotropic variational assimilation, and the hourly 4D variational assimilation show better agreement with the observed storm track, with forecasts from the hourly nudging and hourly 4D variational assimilation again performing best. Forecast position errors are summarized in Table 2 and again compared to the pertinent CLIPER forecasts. In the case of Tropical Cyclone Ethel, which developed close to the north Queensland coast and moved out to sea and subsequently returned ashore, once again, the operational guidance material again provided disparate outcomes ranging from generally moving the cyclone offshore and southeast to returning it to landfall in the 48-h forecast period. The hourly winds for Ethel accumulated over the period 0000–0600 UTC 9 March 1996 are shown in Fig. 2c, illustrating coverage available both near the storm and downstream. Here, the forecasts from the control run and the 6-h nudging technique show improving agreement with the operational track data (E) but only partially capture the cyclone’s recurvature in the 48-h period to 0000 UTC 12 March (Fig. 2d). The three forecasts using the hourly observations and the BoM tropical analyses—namely, the hourly nudging, the hourly barotropic variational, and the hourly 4D variational assimilation—show significant improvement with recurvature and the storm returning onshore during the forecast period. Again, in this case, the hourly nudging and hourly 4D assimilation performed best and this is summarized in Table 3 with the related CLIPER forecast. 4. The Hurricane Opal forecasts In experiments in the Atlantic region, we have examined the use of enhanced cloud drift wind datasets
MAY 1998
LESLIE ET AL.
1251
FIG. 2. (a) Tropical Cyclone Beti (B) with forecast tracks from 0000 UTC 26 March to 0000 UTC 28 March 1996. [Labeled tracks for the control (M), 6-h nudging (N6), 1-h nudging (N1), 3D and 4D variational assimilation runs (3 and 4) are shown.] (b) As in (a) but showing Tropical Cyclone Olivia (O) forecasts from 0000 UTC 9 April to 0000 UTC 11 April 1996. (c) The hourly winds for Tropical Cyclone Ethel from 0000 to 0600 UTC 9 March 1996. (d) As in (a) but showing Tropical Cyclone Ethel (E) forecasts from 0000 UTC 10 March to 0000 UTC 12 March 1996.
from the GOES-8 satellite to provide improved initial conditions for hurricane track forecasting. We note in passing that Hurricane Opal, during the period in which we predicted its track, was in fact a Gulf of Mexico storm. The procedure adopted was the same as for the Australian region, namely, comparing track forecasts derived using a range of data assimilation methods. Here, we have studied track forecasts for Hurricane Opal, both from the NCEP (National Centers for Environmental Prediction) Aviation Run operational analyses and forecasts initialized over a 12-h period, using 6-h high-resolution cloud and water vapor drift wind datasets. Forecasts based on the NCEP Aviation Run operational analyses (the control), 6-h nudging, 6-h barotropic variational assimilation (Bennett et al. 1993), and 6-h 4D variational assimilation (Bennett et al. 1996)
have been contrasted. Data assimilation and forecasts have been performed on two domains. The large domain shown in Fig. 3a is at 0.58 resolution (approximately 50 km) and covers the area 58–458N, 1108–658W. The smaller domain is a 133 3 109 grid covering the domain shown in Fig. 4a and is nested within the larger domain. The smaller domain has a resolution of approximately 15 km. a. The experiments For Hurricane Opal, the experimental methodology was as follows. There were two sets of four forecasts performed, and also the CLIPER forecasts were used for ‘‘no-skill’’ reference. The forecasts were the control forecast, which was based on the model described by
1252
MONTHLY WEATHER REVIEW
TABLE 1. Tropical Cyclone Beti forecast position errors (km) at 12, 24, 36, and 48 h for forecasts commencing at 0000 UTC 26 March 1996.
TABLE 2. Tropical Cyclone Olivia forecast position errors (km) at 12, 24, 36, and 48 h for forecasts commencing at 0000 UTC 9 April 1996.
Valid date/time Assim. type Control 6-h nudging 1-h baro. var. 1-h nudging 1-h 4D var. CLIPER
VOLUME 126
Valid date/time
26 Mar 112 h
27 Mar 124 h
27 Mar 136 h
28 Mar 148 h
Mean error
318 298 184 158 167 53
652 530 230 110 110 190
901 686 227 122 144 454
712 550 186 105 57 522
646 516 207 124 119 305
Leslie and Purser (1995), and was initialized with the NCEP Aviation Run analysis, valid at 0000 UTC 2 October 1995. Shown in Figs. 3b and 3c for the larger domain are the SLP and 850-hPa winds. The provisional fields on the 15-km grid were obtained simply by interpolating from the larger grid, and are shown in Figs. 4b and 4c. Six-hourly nudging was performed using the NCEP analyses as well as the enhanced 6-h cloud and water vapor wind datasets, available at 0000, 1200, and 1800 UTC 1 October 1995 and 0000 UTC 2 October 1995. A typical wind coverage is given in Fig. 4d. The forecasts were nested in the operational NCEP Aviation Run forecast. The barotropic variational assimilation was run using NCEP’s Aviation Run analyses to provide an 850–250-hPa deep-layer mean field, with the variational assimilation being used to incorporate deep-layer mean wind fields into the system while the model and its generalized inverse were used to find the appropriate starting point for the barotropic forecast commencing at 0000 UTC 2 October. Details of the system are given as before in Bennett et al. (1993). The final forecast generated in this experiment was a 4D variational assimilation forecast. Details of this forecast system are given in Bennett et al. (1996). It used NCEP Aviation Run analyses from 1200 UTC 1 October to 0000 UTC 2 October 1995. Forecast boundary conditions were from the operational NCEP Aviation Run forecast model and three enhanced cloud and water vapor wind datasets were incorporated during the four-dimensional model initialization. A similar methodology was used for the 1200 UTCbased forecasts on 2 October 1995. b. Results For Hurricane Opal, the operational guidance material generally moved the hurricane north at a considerably slower rate than that observed. Figure 5a shows the best track locations (O) compared with the forecast tracks from 0000 UTC 2 October 1995 until 0000 UTC 5 October 1995. The 72-h forecasts of the sea level pressure (SLP) fields from CLIPER, the control run, and the variational and nudging assimilation procedures, respectively, are all shown in Fig. 5a. As previously noted,
Assim. type Control 6-h nudging 1-h baro. var. 1-h nudging 1-h 4D var. CLIPER
4 Sep 112 h
4 Sep 124 h
4 Oct 136 h
4 Nov 148 h
Mean error
234 136 91 131 159 42
190 193 69 62 124 188
428 216 145 54 62 479
623 375 229 120 81 867
369 230 133 92 106 394
CLIPER moves the hurricane basically to the west, the control run was far too slow, while the nudging forecast placed the hurricane just at landfall at 72 h. In summary, it is clear from Fig. 5a that the forecasts generally moved Hurricane Opal too far to the west before recurving the storm across the gulf. It is also clear that the enhancement to the database from the addition of cloud and water vapor drift winds (see Fig. 4d) has changed (improved) the initial conditions and that the 6-h nudging and 6-h 4D variational assimilation forecasts are both superior to the control forecast based on the NCEP Aviation Run analysis and forecast boundary conditions. Forecast position errors are summarized in Table 4 and compared to those from CLIPER. The verifying analyses from the low-resolution NCEP numerical analysis are shown in Fig. 5b for the SLP field. Note that the cyclone location is poor compared with the best track location, owing to the lack of resolution in the global system. In the case of the 1200 UTC forecasts, as shown in Fig. 6, again a marked improvement over the control forecasts is seen from initialization using the high spatial resolution cloud drift winds. In these forecasts, it is evident that the starting trajectories for the 6-h nudging and 4D variational forecasts are closer to the observed trajectory of Hurricane Opal, indicating, again, an improved quality in the initial conditions for the track forecasts. This improvement in initial trajectory forecasts was also apparent in some Australian examples and suggests that forecasts based on hourly assimilation of GOES-8 data should be tested to determine if further TABLE 3. Tropical Cyclone Ethel forecast position errors (km) at 12, 24, 36, and 48 h for forecasts commencing at 0000 UTC 10 March 1996. Valid date/time Assim. type Control 6-h nudging 1-h baro. var. 1-h nudging 1-h 4D var. CLIPER
3 Nov 112 h
3 Nov 124 h
3 Nov 136 h
3 Dec 148 h
Mean error
227 165 115 99 103 93
362 213 202 136 181 111
319 158 158 183 176 251
405 221 258 89 161 499
328 189 183 127 155 238
MAY 1998
LESLIE ET AL.
1253
FIG. 3. (a) The low-resolution domain showing the subset of the NCEP global domain used for the provisional analyses and for nesting the high-resolution domain (b) The initial NCEP SLP analysis of Hurricane Opal valid for 1200 UTC 2 October 1995, from the Aviation Run. (c) As in (b) except for the wind field (m s21) at 850 hPa.
1254
MONTHLY WEATHER REVIEW
VOLUME 126
FIG. 4. (a) The high-resolution domain showing the 133 3 109 grid points at a resolution of approximately 15 km. (b) The initial NCEP analysis valid for 1200 UTC 2 October 1995, from the Aviation Run, interpolated to the 15-km grid. (c) As in (b) except for the wind field at sigma level 0.85. (d) A typical cloud and water vapor drift wind data coverage, for 1200 UTC 2 October 1995.
MAY 1998
LESLIE ET AL.
1255
FIG. 4. (Continued)
improvement in the accuracy of initial forecast tracks (and subsequent forecasts) can be achieved using hourly data during initialization. Forecast errors for this case have been summarized in Table 5 with those for the related CLIPER forecast. 5. Summary and conclusions Enhanced cloud drift wind datasets, similar to those employed in the studies above, have been used in recent years for predicting tropical cyclone movement in several experiments. In recent studies over the Australian region (Le Marshall et al. 1996a), 6-h nudging and a barotropic variational technique (Bennett et al. 1993) using hourly winds were contrasted in a study of Tropical Cyclone Rewa in the Coral Sea. In that case, the gains from the use of hourly winds with the hourly barotropic variational approach were greater than those seen from the use of the BMRC tropical analyses with 6-h nudging. More recently, Bennett et al. (1996) demonstrated the utility of 4D variational assimilation using an enhanced cloud drift wind database in the northwest Pacific. This and the recent studies by Le Marshall et al. (1996b,c), extend the earlier work to include hourly data with hourly 4D variational assimilation and hourly nudging as initializing procedures and examine the utility of the high-density wind fields now available from GOES-8. A control forecast, 6-h nudging, hourly nudging, hourly barotropic variational assimilation, and hourly 4D variational assimilation have been contrasted using hourly wind data. It was found that both hourly nudging and variational assimilation, using hourly observations, provided improved forecasts and that the hourly 4D variational assimilation and hourly nudging performed
best. This result is consistent with the earlier studies and provides support for the testing of systems, in the short term, which incorporate hourly nudging with hourly winds as candidates for the next generation operational forecast systems, the computing load associated with hourly nudging, for example, being practicable, but the 4D variational assimilation procedure is still too computationally expensive. The forecasts for Hurricane Opal also are very significant in that they reinforce the findings of the Australian studies carried out by the lead authors, that initialization of NWP models using high temporal resolution (6-hourly down to hourly) and spatial resolution data assimilation has the ability to improve track forecasts, even in the case of the difficult, recurving tropical cyclones. In the case of Hurricane Opal, use was made of the enhanced spatial density wind datasets available now from GOES-8. The Australian and Atlantic tropical cyclone results, when considered together, indicate that when such high spatial and temporal resolution datasets are used together with continuous assimilation techniques and a high-resolution forecast model, the potential to improve hurricane track forecasts is greatly increased. In conclusion, from these and related studies, it would appear that the use of hourly and 6-h high-density locally derived satellite winds has the potential to reduce mean forecast errors by a significant percentage, especially the more difficult storms that often produce the greatest track forecast errors. However, the results also suggest that although benefits from these winds can be seen using 6-h data assimilation, there might be occasions where a single static analysis fails to encapsulate much of the dynamic information available through initializing using hourly datasets (see, e.g., the Tropical
1256
MONTHLY WEATHER REVIEW
VOLUME 126
FIG. 5. (a) Hurricane Opal track (O) with the control (M), 3D variational assimilation (3), 6-h nudging (N6), 4D variational assimilation (4), and CLIPER (C) forecasts commencing at 0000 UTC 2 October 1995. (b) The 72-h verifying numerical SLP analysis, valid at 0000 UTC 5 October 1996.
Cyclone Beti case). Indeed there may also be problems in incorporating high spatial and temporal density (hourly) wind observations in a 6-h analysis with a typical time window of 63 h, in such a way as to extract their full information content. The details of atmospheric
structures, if they are very mobile and of small zonal or meridional dimension, may be lost. The full utility of hourly satellite-derived winds, for example, seems to be apparent only when used with continuous assimilation schemes.
TABLE 4. Hurricane Opal forecast position errors at 12, 24, 36, 48, 60, and 72 h for forecasts commencing at 0000 UTC 2 October 1995.
TABLE 5. Hurricane Opal (1200 UTC 10 February–0000 UTC 10 May 1995). Forecast position errors at 12, 24, 36, 48, and 60 h for forecasts commencing at 1200 UTC 2 October 1995.
Valid date/time
Valid date/time
2 Oct 3 Oct 3 Oct 4 Oct 4 Oct 5 Oct Mean Assim. type 112 h 124 h 136 h 148 h 160 h 172 h error Control Nudging Baro. var. 4D var. CLIPER
88 3 35 20 44
140 107 169 97 136
256 162 235 168 258
523 287 423 261 544
630 311 440 338 —
768 266 479 284 1304
401 189 297 195 457
2 Oct Assim. type 112 h Control Nudging Baro. var. 4D var. CLIPER
163 123 151 131 84
3 Oct 124 h
3 Oct 136 h
4 Oct 148 h
4 Oct 160 h
Mean error
261 125 173 120 211
423 152 283 135 474
614 180 448 104 794
861 238 606 267 —
464 164 332 151 313
MAY 1998
LESLIE ET AL.
FIG. 6. As in 5a except commencing 1200 UTC 2 October 1995.
Acknowledgments. This research was partially supported by The Office of Naval Research under ONR Grant N00014-94-1-0556. The authors are indebted to the following institutions for providing data: NCEP for the NCEP aviation data and CLIPER predictions, University of Wisconsin—Madison for the high quality 6h satellite-derived winds for Hurricane Opal, and the Naval Research Laboratory, Monterey, for a full history of the behavior of Hurricane Opal. The authors also express their thanks to Terry Adair for assisting in the preparation of this manuscript, and to COLA for permission to use the GRADS graphics software. REFERENCES Bennett, A. F., L. M. Leslie, C. R. Hagelberg, and P. E. Powers, 1993: Tropical cyclone prediction using a barotropic model initialized by a generalized inverse method. Mon. Wea. Rev., 121, 1714– 1729. , B. S. Chua, and L. M. Leslie, 1996: Generalised inversion of a global numerical weather prediction model. Meteor. Appl. Phys., 60, 165–178.
1257
Davidson, N. E., and B. J. McAvaney, 1981: The ANMRC tropical analysis scheme. Mon. Wea. Rev., 109, 155–228. Elsberry, R. L., 1990: International experiments to study tropical cyclones in the western North Pacific. Bull. Amer. Meteor. Soc., 71, 1305–1316. Haltiner, G. J., and R. T. Williams, 1980: Numerical Prediction and Dynamic Meteorology. Wiley, 477 pp. Le Marshall, J. F., W. Smith, and G. Callan, 1985: Hurricane Debby— An illustration of the complementary nature of VAS soundings and cloud and water vapor motion winds. Bull. Amer. Meteor. Soc., 66, 258–263. , L. J. Stirling, R. F. Davidson, and M. J. Hassett, 1987: The Australian region McIDAS. Aust. Meteor. Mag., 35, 55–64. , N. R. Pescod, G. A. Mills, and P. K. Stewart, 1992: Cloud drift winds in the Australian Bureau of Meteorology: An operational note. Aust. Meteor. Mag., 40, 247–250. , , R. S. Seaman, G. A. Mills, and P. K. Stewart, 1994: An operational system for generating cloud drift winds in the Australian region and their impact on numerical weather prediction. Wea. Forecasting, 9, 361–370. , L. M. Leslie, and C. Spinoso, 1996a: The impact of spatial and temporal distribution of satellite observations on tropical cyclone data assimilation: Preliminary results. Meteor. Atmos. Phys., 60, 157–163. , , and A. F. Benett, 1996b: Tropical Cyclone Beti—An example of the benefits of assimilating hourly satellite wind data. Aust. Meteor. Mag., 45, 275–279. , , , C. Spinoso, and N. R. Pescod 1996c: Assimilation of direct readout satellite observations from polar and geostationary satellites in sub-synoptic scale meteorology. Adv. Space Res., 19, 413–422. Leslie, L. M., and R. J. Purser, 1995: Three-dimensional mass-conserving semi-Lagrangian scheme employing forward trajectories. Mon. Wea. Rev., 123, 2551–2566. Mills, G. A., G. M. Callan, and B. M. Goodman, 1986: A mesoscale data assimilation scheme for real time use in the McIDAS environment. CIMSS Tech. Rep., 86 pp. [Available from CIMSS, Space Science and Engineering Center, University of Wisconsin, 1225 West Dayton St., Madison, WI 53706.] Morison, R. P., 1993: Statistical tropical cyclone forecasting. M.S. thesis, Dept. of Mathematics, Monash University, 98 pp. [Available from Monash University, Dept. of Mathematics, Clayton, Victoria 3168, Australia.] Puri, K., N. E. Davidson, L. M. Leslie, and L. W. Logan, 1992: The BMRC tropical limited-area model. Aust. Meteor. Mag., 40, 81– 104. Velden, C. S., C. M. Hayden, W. P. Menzel, J. L. Franklin, and J. S. Lynch, 1992. The impact of satellite-derived winds on numerical hurricane track forecasts. Wea. Forecasting, 7, 107–118.