culated as a unigram language model on the specific class c. This is contrary to most ... The interpolation weight is defined by λ; higher values of λ induce more ...
Improved Methods for Language Model Based Question Classification Andreas Merkel, Dietrich Klakow Spoken Language Systems, Saarland University, 66123 Saarbr¨ucken, Germany {andreas.merkel|dietrich.klakow}@lsv.uni-saarland.de
Abstract
In this paper, we propose a language model based approach to classify user questions in the context of question answering systems. As categorization paradigm, a Bayes classifier is used to determine a corresponding semantic class. We present experiments with state-of-the-art smoothing methods as well as with some improved language models. Our results indicate that the techniques proposed here provide performance superior to the standard methods, including support vector machines. Index Terms: Systems for Information Retrieval, Question Answering, Language Modeling, Question Classification
2. Language Model Based Question Classification The framework we used to classify the user questions is described in this section. For the task of information retrieval, a language model based approach was introduced by Ponte and Croft [5]. They showed that this method performs better than traditional state-of-the-art retrieval systems. In this paper, we intend to propose the same techniques for the task of classifying user questions. The main advantage of using a language model based approach is the large supply of known techniques to calculate and smooth probabilities. This is necessary, because there is so little available training data. On average, there are only about 100 training questions per class. As described in Section 1, a Bayes classifier was used to perform the categorization task. In this case, it is defined by
1. Introduction cˆ = argmaxc P (Q|c)P (c) In a spoken question answering system a speech recognizer is used on top of a question answering (QA) framework. For example, such a system was developed as a part of the Smartweb project [1]. In this system, a speaker asks a natural language question and the system provides an answer. In contrast to a classical document retrieval framework, which just returns relevant documents to a user query, a QA system answers with accurate responses to a question posed in natural language [2]. Thus, the task is very complex and document retrieval is only a small part of the entire system. In order to provide the user with the correct answer, the QA system has to “understand” the meaning of a question. For example, if a user asks the question “When was James Dean born?”, the answer of the system should be a date and not a country. This means that the QA system has to analyze the question before making further steps. Normally, this is done in the “query construction”. In this part, the user question is classified into several semantic categories. This categorization helps the system to reduce the search space and, hence, is very useful in finding and verifying resulting answers. It may also help to determine the search strategies for further retrieval modules [3]. Most existing QA systems do not use more than 20 semantic categories to classify questions. In the approach we describe in this paper, a more fine-grained classification taxonomy is used. The original hierarchy was introduced in [3] and describes 6 coarse- and 50 fine-grained classes. As we will show, it is sufficient to optimize only the fine-grained classes; thus, in our experiments, we used this taxonomy for classification. Based on this taxonomy, a Bayes classifier with language models as categorization paradigm was used. With this framework, we show that our approach is at least as good as systems discussed in current literature [4].
.
(1)
The advantage of using such a classifier is the certainty of obtaining a minimum error rate provided that all probabilities are exactly known. The term P (Q|c) denotes the conditional probability of the user question Q given semantic class c. P (c) is the prior probability of this class. If we consider the problem of data sparsity for training, P (Q|c) has to be calculated as the product of all occurring query terms:
P (Q|c) =
n Y
P (wi |wi−1 c)
(2)
i=1
where Q = {w1 . . . wn }. The prior probability P (c) is calculated as a unigram language model on the specific class c. This is contrary to most of the current literature [6], where the prior information is considered uniform, and therefore can be neglected. Smoothing is not required, because all of the semantic classes occur more than four times in the training data, which is sufficiently often to calculate the maximum likelihood probabilities for language model estimation. The next section shows how to calculate P (wi |wi−1 c). To avoid the problem of zero probabilities, which would result in excluding specific terms from the classification, smoothing methods are introduced.
3. Methods In this section, we will illustrate how to smooth zero probabilities, which can occur when query terms are not seen in combination with a specific semantic class. For that purpose, we introduce unigram as well as bigram language models.
3.1. Standard Smoothing Methods Zhai and Lafferty [6] presented three different smoothing methods based on unigram statistics for the task of information retrieval. In the following sections, we also introduce these standard methods for the task of question classification. 3.1.1. Jelinek–Mercer A smoothing technique based on linear interpolation was first introduced by Jelinek and Mercer [6]. This technique was based on the probability estimate N (wi , c) + λPBG (wi |c) wi N (wi , c)
Pλ (wi |c) = (1 − λ) P
(3)
where N (wi , c) is the count of the word wi in combination with the class c and PBG (wi |c) is the “background” probability for unseen events. Possible distributions are introduced in Section 3.3. The interpolation weight is defined by λ; higher values of λ induce more smoothing.
Equation (6) shows a unigram back-off model as described in Section 3.1.3, where N (wi , c) is the frequency of the term wi in combination with class c, the discounting parameter is defined by d, and PBG (wi |c) is the back-off language model. The term α denotes the back-off weight. In this case, the discounting parameter is independent of the term frequency. By contrast, the rational function d(N ) =
Pµ (wi |c) =
N (wi , c) + µPBG (wi |c) P wi N (wi , c) + µ
(4)
where N (wi , c) is the frequency of word wi and class c, PBG (wi |c) is the collection model and µ is the smoothing parameter. 3.1.3. Absolute Discounting Absolute discounting is the most common and popular smoothing method in speech recognition. It is defined by max (N (wi , c) − δ, 0) δB P +P PBG (wi |c) N (w , c) N (wi , c) i w wi (5) where N (wi , c) are the observation frequencies determined on the training data. The term PBG (wi |c) denotes the backing-off model trained on background data and B specifies how often N (wi , c) is larger than the smoothing parameter δ.
3.2.2. Log–Linear Interpolation The use of language models for log–linear interpolation was first proposed in [8]. The exact model we will use in our experiments is defined by P (wi |wi−1 c) =
1 Zλ (wi−1 c)
In addition to the smoothing algorithms defined in Section 3.1, we consider here improved methods to estimate smoothed probabilities.
PU niDisc (wi |c)1.0 PAbsDisc (wi |wi−1 c)λ
(8)
where Zλ (wi−1 c) is a normalization weight depending on wi−1 , c and the parameter λ. The term PUniDisc (wi |c) is the improved absolute discounting method described in the previous section and PAbsDisc (wi |wi−1 c) is an absolute discounting approach using bigram statistics. The parameter λ denotes the interpolation weight. 3.3. Background Models In this section, possible background models we used for the smoothing methods described in Section 3 are shown. 3.3.1. Zerogram The simplest background model, which uses no information about words, is the zerogram defined by Zero PBG (wi |c) =
Pδ (wi |c) =
3.2. Improved Smoothing Methods
(7)
describes a discounting parameter which depends on term counts, where d0 is the absolute discounting parameter introduced in Section 3.1.3, whereas s and g are additional parameters.
3.1.2. Bayesian Smoothing with Dirichlet Priors If a multinomial distribution for estimating a language model is considered and a Dirichlet distribution is used as the conjugate prior, it results in the smoothed probability estimate
d0 + s(N − 1) 1 + g(N − 1)
1 |V |
(9)
where |V | is the size of the vocabulary. 3.3.2. Unigram Another commonly used distribution is the unigram model. It can be computed with the well-known maximum likelihood estimator: N (wi ) U ni . (10) PBG (wi |c) = P wi N (wi )
N (wi ) means the frequency of the word wi in the training corpus. Note that both variants are independent of the class c.
3.2.1. Improved Absolute Discounting (UniDisc) The improved absolute discounting smoothing method introduced in [7] for smoothing very small adaptation corpora is known as UniDisc. This technique was based on the proability estimate 8 > < N(wi , c) − d + αPBG (wi |c) if N(wi , c) > 0 N Pd (w|c) = > : α · PBG (wi |c) else (6)
4. Experiments This section describes the dataset we used for our experiments as well as the results of the different smoothing approaches. 4.1. Dataset We used the 5,500 questions provided by the Cognitive Computing Group at University of Illinois at Urbana Champaign1 1 http://l2r.cs.uiuc.edu/∼cogcomp/Data/QA/QC/
280
45
260 40 misclassification error rate in %
Number of errors for fine classes
240 220 200 180 160 140 120
30
25
100
dirichlet zerogram dirichlet unigram
Experiments linear fit
80
20 80
100
120 140 Number of errors for coarse classes
160
180
0
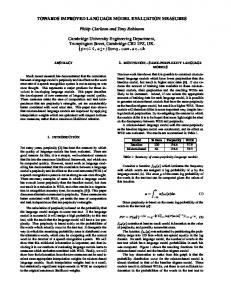
Figure 1: Correlation between number of errors for coarse and fine classes.
500
1000
1500
2000 µ
2500
3000
3500
4000
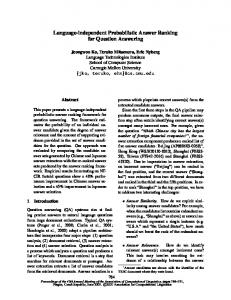
Figure 3: Misclassification error rate for different Dirichlet prior smoothing parameters.
45
45
linear zerogram linear unigram
abs. disc. zerogram abs. disc. unigram
40
40 misclassification error rate in %
misclassification error rate in %
35
35
30
25
35
30
25
20
20 0
0.1
0.2
0.3
0.4
0.5
0.6
0.7
0.8
0.9
1
0.1
0.2
0.3
0.4
λ
0.5
0.6
0.7
0.8
0.9
1
δ
Figure 2: Misclassification error rate for different linear interpolation smoothing parameters.
Figure 4: Misclassification error rate for different discounting parameters.
as training data. The evaluation was done with the TREC102 dataset, which contains 500 test questions. The vocabulary we used in our experimental setup consists of about 10000 words extracted from the training data. As evaluation metric, the misclassification error rate (MER), which specifies the percentage of misclassified semantic classes for the evaluation test data, was chosen. For our experimental setup, we used the classification taxonomy defined in [3]. It consists of 6 coarse- and 50 finegrained semantic classes. Figure 1 shows the correlation between the number of errors for the coarse- and fine-grained classes as a scatter plot. It proves that both types of classification correlate very well. Hence, for the balance of this work, we concentrate exclusively on improving the performance of the fine-grained classes.
information. Both curves are relatively independent of the interpolation weight and reach their minimum MER at approximately 0.5, which means that smoothing is necessary. For a high smoothing parameter (λ ≈ 1), the unigram language model is slightly better than the zerogram distribution.
4.2. Results The results of our experiments are discussed in this section. As experimental methods, we used the standard and improved smoothing algorithms defined in Section 3. 4.2.1. Jelinek–Mercer Interpolation Figure 2 shows the results of the Jelinek–Mercer interpolation for different smoothing weights. It proves that using a zerogram background distribution performs slightly better than unigram 2 http://trec.nist.gov
4.2.2. Dirichlet Priors The experiments with Dirichlet priors are presented in Fig. 3. In this case, the zerogram model performs significantly better than the unigram distribution. A smoothing value of µ = 200 is yielded the best performance, but this time, both methods depend more on the smoothing parameter. Surprisingly, the behavior of the unigram background model in comparison with the zerogram distribution is completely different. These results indicate that the unigram model requires much more smoothing to enhance the performance. When using a parameter µ ≥ 1200, the unigram performs better than the zerogram language model. 4.2.3. Absolute Discounting For absolute discounting (Fig. 4), both used background distributions strongly depend on the smoothing parameter. In contrast to the other standard methods, best results are obtained when using a large discounting value. Again, the unigram model performs better than the zerogram distribution for a high smoothing value. But in this case, the unigram statistics exceeds the zerogram background model.
0
Table 1: Comparison of proposed language model based approaches for query classification. In contrast, the best traditional method in literature ([4]) is the Support Vector Machine (SVM) with a MER of 19.8%.
25% 24% 23% 22% 21% 20.6%
0.002
Method Jelinek–Mercer Dirichlet Prior Absolute Discounting UniDisc Log–Linear
0.004 g
0.006 0.008 0.01 0.012 0.4
0.5
0.7
0.6
0.8
0.9
1
MER 28.4% 34.2% 25.5% 20.6% 19.2%
s
Figure 5: Contour plot for misclassification error rate for different discounting parameters for UniDisc experiments. 45 log-linear
misclassification error rate in %
40
35
30
25
20 -0.4
-0.2
0
0.2
0.4
0.6
0.8
λ
Figure 6: Misclassification error rate for different log-linear smoothing parameter.
4.2.4. UniDisc The experimental results for the first improved language model are shown in Fig. 5. For this setting, the best performance was gained when using the discounting parameter d0 = 1. From this follows that events, which appear just once, are discarded. Thus, only terms with multiple occurrences are used for classification. As singletons are mostly nouns, this is a reasonable result, because such events contain no useful information for the task of question categorization. The combination of both additional discounting parameters is presented as a contour plot. It shows the area of best performance at s = 0.8 and g = 0.007 with a MER of 20.6%.
different background models, such as zerogram and unigram models. Table 1 gives an overview of all smoothing methods used in our experiments. It shows the number of misclassified categories as well as the misclassification error rate (MER). In general, our improved approaches perform better than the standard smoothing methods. Here, the absolute discounting method is best, whereas Dirichlet priors performs best for the task of sentence retrieval in question answering [2]. In regard to the improved methods, the enhanced absolute discounting experiments performed better than the standard back-off algorithm. The approach with the best results is the log–linear interpolation method, which achieved a MER of 19.2%. These results are comparable to other state-of-the-art methods, like SVMs. But, in terms of training, this approach can be computed in linear time complexity and therefore is much faster compared to most existing implementations which have to be computed in polynomial time.
6. Acknowledgements This work was partially funded by the BMBF project SmartWeb under contract number 01 IMD01 M. The authors would like to thank Michael Wiegand, Jochen L. Leidner and John McDonough for interesting discussions.
7. References [1]
Wahlster, W., Smartweb: Mobile Applications of the Semantic Web, in Proc. of Informatik, Springer, 2004.
[2]
Shen, D., Leidner, J.L., Merkel, A., Klakow, D., The Alyssa System at TREC 2006: A Statistically-Inspired Question Answering System, in Proc. TREC 2006, Gaithersburg, 2006.
[3]
Li, X. and Roth, D., Learning Question Classifiers, in Proc. COLING, Taipei, 2002.
[4]
Zhang, D. and Lafferty, J., Question Classification using Support Vector Machines, in Proc. SIGIR, Toronto, 2003.
[5]
Ponte, J.M. and Croft, B., A Language Modeling Approach to Information Retrieval, in Proc. SIGIR, Melbourne, 1998.
[6]
Zhai, C. and Lafferty J., A Study of Smoothing Methods for Language Models Applied to Ad Hoc Information Retrieval, in Proc. SIGIR, New Orleans, 2001.
[7]
Klakow, D., Language Model Adaptation for Tiny Adaptation Corpora, in Proc. Interspeech, Pittsburgh, 2006.
[8]
Klakow, D., Log–Linear Interpolation of Language Models, in Proc. ICSLP, Sydney, 1998.
4.2.5. Log–Linear Interpolation Figure 6 demonstrates the experiments for the log–linear interpolation approach. It proves that using absolute discounting with bigram statistics for interpolation results in an additional performance gain. The best MER is achieved at approximately λ = 0.1. For λ ≥ 0, the distribution remains relatively independent to the smoothing parameter.
5. Conclusion In this paper, we have presented a language model based approach to question classification in the context of spoken question answering. Our methodology is based on a Bayes classifier and uses several state-of-the-art and improved methods to smooth unseen events. We have also showed the effects of using