sensors Article
A UWB/Improved PDR Integration Algorithm Applied to Dynamic Indoor Positioning for Pedestrians Pengzhan Chen
ID
, Ye Kuang and Xiaoyue Chen *
School of Electrical Engineering and Automation, East China Jiaotong University, Nanchang 330013, China;
[email protected] (Y.K.);
[email protected] (X.C.) * Correspondence:
[email protected]; Tel.: +86-186-7993-6816 Received: 10 July 2017; Accepted: 5 September 2017; Published: 8 September 2017
Abstract: Inertial sensors are widely used in various applications, such as human motion monitoring and pedestrian positioning. However, inertial sensors cannot accurately define the process of human movement, a limitation that causes data drift in the process of human body positioning, thus seriously affecting positioning accuracy and stability. The traditional pedestrian dead-reckoning algorithm, which is based on a single inertial measurement unit, can suppress the data drift, but fails to accurately calculate the number of walking steps and heading value, thus it cannot meet the application requirements. This study proposes an indoor dynamic positioning method with an error self-correcting function based on the symmetrical characteristics of human motion to obtain the definition basis of human motion process quickly and to solve the abovementioned problems. On the basis of this proposed method, an ultra-wide band (UWB) method is introduced. An unscented Kalman filter is applied to fuse inertial sensors and UWB data, inertial positioning is applied to compensation for the defects of susceptibility to UWB signal obstacles, and UWB positioning is used to overcome the error accumulation of inertial positioning. The above method can improve both the positioning accuracy and the response of the positioning results. Finally, this study designs an indoor positioning test system to test the static and dynamic performances of the proposed indoor positioning method. Results show that the positioning system both has high accuracy and good real-time performance. Keywords: inertial navigation; UWB; indoor positioning; symmetrical features; error correction
1. Introduction In today’s fast-paced modern society, people are increasingly dependent on the convenience of location-based services, which are based on the precise positioning method. According to statistics, 80–90% of human activities occur indoors; thus, without interfering on the premise of privacy, the indoor location information of crowds has high commercial value. At present, the mainstream indoor positioning technologies are ultrasound, infrared, Bluetooth, ZigBee, radio frequency identification technology (RFID), and WIFI [1–6]. This technologies meet the requirements of some indoor activities to some extent, but some shortcomings still exist, such as high cost and poor positioning accuracy. An inertial-sensor-based method, named pedestrian dead-reckoning (PDR) positioning, has the advantages of low cost, small volume, and strong autonomy, but its inertial positioning method has poor positioning accuracy and the positioning error will accumulate over time. Therefore, determining how to reduce the cumulative error of the inertial sensors is an urgent concern. Zhuang et al. [7] used the zero velocity update (ZUPT) algorithm to clear the cumulative error in each step interval, and improve the accuracy of inertial navigation to a certain extent. The error can be controlled within 2 m. The positioning accuracy of the meter level Sensors 2017, 17, 2065; doi:10.3390/s17092065
www.mdpi.com/journal/sensors
Sensors 2017, 17, 2065
2 of 20
can barely meet the requirements because the conditions become more severe. Therefore, inertial positioning is usually combined with other positioning methods. Xin et al. [8] used various methods to fuse the Bluetooth tag and PDR positioning data; after experimental verification, the extended Kalman filter (EKF) fusion could achieve increased positioning accuracy and an average accuracy of less than 1 m. A disadvantage is that the cost of placement and maintenance of Bluetooth labels is high, and, Bluetooth positioning and PDR method can barely achieve precise positioning. Thus, integrating the two methods can only reach the positioning accuracy at the meter level. Ruiz et al. [9] proposed a new INS/RFID tightly-coupled indoor location method based on Kalman filter (KF), and applied ZUPT and zero angular-rate updates (ZARU) to detect pedestrian gait interval. The method can effectively eliminate the error drift and control the average positioning accuracy in 1.5 m. The combination of positioning technologies and inertial positioning can only improve the positioning accuracy to a very small extent because the positioning accuracy of Bluetooth and RFID methods is poor. Meanwhile, UWB is not sensitive to channel fading, has low transmission signal power spectral density, low interception capacity, and low system complexity, and can provide centimeter-level accuracy, but its susceptible to blocking, which causes low dynamic performance. Pittet et al. [10] used EKF to fuse UWB/PDR data. However, EKF could not achieve good results, and even cause the filtering divergence of the nonlinear system. In addition, the KF could not correct the heading error, thereby increasing the heading error with time. Zihajehzadeh et al. [11] used two cascaded Kalman filter to fuse the UWB/IMU data and reduce the heading errors to a certain extent, but the heading angle needed 20 s to be converged; thus, the method failed to meet the dynamic response requirements. He et al. [12] used distance data from the UWB module placed on the mobile node to correct the positioning error of dead reckoning (DR) and were able to achieve an average positioning accuracy of 0.2646 m. The aforementioned studies show that the combined positioning method of UWB/PDR can obtain high positioning accuracy and meet the requirements of most indoor environments. However, the above method neglects the dynamic performance of indoor positioning system. Given the increasingly important role of indoor positioning plays in virtual reality (VR) and robots, dynamic performance has become an indispensable in evaluating a qualified indoor positioning system. Dynamic positioning accuracy will directly affect the user’s gaming experience, especially in VR theme parks and other indoor positioning applications. In a complex indoor environment, the independent UWB positioning can barely obtain continuous ranging information, and the autonomy and real-time performance of inertial sensors can favorably improve the dynamic performance of the integrated positioning system. However, the traditional PDR algorithm based on a single IMU cannot provide accurate positioning data. Hence, integrating UWB/PDR data directly failed to achieve the ideal static and dynamic positioning accuracy. Inertial sensing is widely used in human motion monitoring and location positioning of various applications. However, because inertial sensors cannot accurately define the process of human movement, data drift occurs in the human positioning process, which seriously affects positioning accuracy and stability. At present, many scholars have adopted various methods based on inertial sensing to improve the performance of human motion. Although the static performance of positioning data can be improved, but the dynamic performance of positioning results still fails to meet the application requirements. Present studies have neglected the following rules: in the process of human body movement, in order to maintain body balance, the movements of symmetrical parts have a certain degree of similarity and symmetry. Moreover, throughout the movement, a certain regularity exists between the movement of symmetrical joint bones and the movement of joint bones is similar; only a certain phase difference occurs in time. These rules can be used to accurately define the process of human motion and improve the traditional PDR algorithm.
Sensors 2017, 17, 2065
3 of 20
2. Positioning Strategy of Distributed Inertial Sensors Sensors 2017, 17, 2065
3 of 20
PDR algorithm is a pedestrian trajectory estimation method based on inertial sensors. The traditional PDR algorithm takes the data of single-foot inertial sensor as the input and completes pedestrian calculation through the steps of step detection, step length calculation, and heading the pedestrian calculation through the steps of step detection, step length calculation, and heading calculation. However, the data acquisition and calculation process of a single foot causes a large error calculation. However, the data acquisition and calculation process of a single foot causes a large error and lacks a review mechanism. The improved PDR algorithm proposed in this study is a positioning and lacks a review mechanism. The improved PDR algorithm proposed in this study is a positioning method based on the inertial data of the right and left feet. To verify the feasibility of the method, the method based on the inertial data of the right and left feet. To verify the feasibility of the method, the output inertial data of the pedestrian's feet are analyzed, and the action characteristics of the human output inertial data of the pedestrian's feet are analyzed, and the action characteristics of the human body are obtained before improving the traditional method. body are obtained before improving the traditional method.
An g u la r v e lo c i ty
Ri g h t F o o t
2.1. Analysis of Human Body Movement 2.1. Analysis of Human Body Movement The motion of the human body presents periodicity during walking, which can be seen through The motion of the human body presents periodicity during walking, which can be seen through observation. A complete gait cycle starts at the point when the heel of one foot hits the floor and ends observation. A complete gait cycle starts at the point when the heel of one foot hits the floor and at the point when the heel of the same foot hits the floor again. During this period, the lower limb ends at the point when the heel of the same foot hits the floor again. During this period, the lower experiences both stationary and swinging phases. The swing phase can be divided into three stages, limb experiences both stationary and swinging phases. The swing phase can be divided into three namely, toe-off (TO), mid-stance (MS) and the heelstrike (HS). Thus, a complete gait cycle can be stages, namely, toe-off (TO), mid-stance (MS) and the heelstrike (HS). Thus, a complete gait cycle can divided into four processes, namely, TO, MS, HS and foot flat (FF). be divided into four processes, namely, TO, MS, HS and foot flat (FF). The movements of the lower limbs are usually symmetrical. Two inertial sensors are placed on The movements of the lower limbs are usually symmetrical. Two inertial sensors are placed on both feet in order to verify the symmetry of the lower limb. The angular velocity curve of the Y-axis both feet in order to verify the symmetry of the lower limb. The angular velocity curve of the Y-axis can reflect the gait cycle and the symmetry of the feet when walking by analyzing triaxial acceleration can reflect the gait cycle and the symmetry of the feet when walking by analyzing triaxial acceleration and angular velocity data. and angular velocity data. In Figure 1, the periodic characteristic of the angular velocity curve of the Y-axis is more obvious, In Figure 1, the periodic characteristic of the angular velocity curve of the Y-axis is more obvious, the output curve is smooth, and the features are easy to be extract. Figure 2 shows that the gait cycle the output curve is smooth, and the features are easy to be extract. Figure 2 shows that the gait cycle of of the left and right feet alternates with each other, and the still period of the left (right) foot the left and right feet alternates with each other, and the still period of the left (right) foot corresponds corresponds to the swing period of the right (left) foot. These characteristics provide the possibility to the swing period of the right (left) foot. These characteristics provide the possibility of implementing of implementing the PDR algorithm and improving dynamic performance. the PDR algorithm and improving dynamic performance. 7
[rad/s ] 0 -7 0
200
400
600
800
1000
1200
200
400
600
800
1000
1200
Le ft Fo o t
7
[rad/s ] 0
-7 0
F ra m e s
Figure 1. Angular velocity of both feet (1 frame = 0.017 s).
Ri g h t F o o t
Le ft Fo o t
An g u la r v e lo c i ty
HS(R) MS(R) TO(R) The traditional PDR algorithmFF(R) is based on the output data of a single-foot inertial sensor. However, FF(L) the reliability of single-foot data is low, leading toHS(L) a large deviation in the pedestrian position estimation. MS(L) TO(L) 7 Step detection method based on one foot is not accurate and lacks an inspection mechanism, especially in the step detection of PDR [rad/s ] 0 algorithm, thus affecting the final positioning results. Figure 2 shows that the symmetry of the human lower limb in motion can favorably provide the precision of step detection. -7 daily experience show that feet cannot be in a swing state at the same time The data in the figure and 150 200 250 300 350 400 450 7 foot is in the swing phase, the other foot must be in a quiescent period to during walking; when one maintain the stability of] the 0 body's center of gravity. This phenomenon indicates that the body is in the [rad/s stationary state when two feet are stationary at the same time. According to the above characteristics,
-7 150
200
250
300
350
F ra m e s
Figure 2. Gait cycle of both feet (1 frame = 0.017 s).
400
450
An g u la r v e lo c i ty
Ri g h t
[rad/s ] 0 -7 0
200
400
600
800
1000
1200
Sensors 2017, 17, 2065
Le ft Fo o t
7
4 of 20
[rad/s ] 0
this study improves the -7 step detection and heading estimation methods in traditional PDR algorithm 0 200 400 600 800 1000 1200 by proposing a step detection method based on limb symmetry and a dynamic threshold and a heading estimation method based on angular velocity threshold. F ra m e sThese methods can improve the precision of step detection and heading calculation and finally improve the positioning accuracy and dynamic Sensors 2017, 17, 2065 4 of 20 1. Angular velocity of both feet (1 frame = 0.017 s). performance of the PDR Figure algorithm.
Ri g h t F o o t
Le ft Fo o t
An g u la r v e lo c i ty
The traditional PDR algorithm is based on the output data of a single-foot inertial sensor. HS(R) MS(R) TO(R) FF(R) However, the reliability of single-foot data is low, leading to a large deviation in the pedestrian HS(L) FF(L) MS(L) TO(L) position estimation. Step detection method based on one foot is not accurate and lacks an inspection 7 mechanism, especially in the step detection of PDR algorithm, thus affecting the final positioning [rad/s ]that results. Figure 2 shows 0 the symmetry of the human lower limb in motion can favorably provide the precision of step detection. The data in the figure and daily experience show that feet cannot be -7 150 time during 200 walking; 250 when 300 400 phase, 450 in a swing state at the same one foot is350 in the swing the other foot 7 must be in a quiescent period to maintain the stability of the body's center of gravity. This 0 the body is in the stationary state when two feet are stationary at the same [rad/s ]that phenomenon indicates time. According to the above characteristics, this study improves the step detection and heading -7 estimation methods in traditional PDR algorithm by proposing a350 step detection method 150 200 250 300 400 450 based on limb symmetry and a dynamic threshold and a heading estimation method based on angular velocity F ra m e s threshold. These methods can improve the precision of step detection and heading calculation and Figure 2. Gait both feetperformance (1 frame frame = = 0.017 Figure 2. Gait cycle cycle of both feet (1 0.017 s). finally improve the positioning accuracy and of dynamic of s). the PDR algorithm. 2.2. Improved PDR Indoor Positioning Algorithm INS and PDR algorithm are two commonly used methods in navigation [13]. The advantages of the PDR algorithm is that it reduces the error brought by the integral in the step length estimation and does not need to integrate the acceleration. PDR algorithm consists of three steps: step step detection, detection, step length calculation and heading detection. The previous position of the pedestrian can be used to calculat the current position: ! X! X ! l cos Xk+1 k 1 Xkk l × cos ϕ = Ykk + Yk+1 Yk 1 Y l ×sin l sin ϕ
(1) (1)
X k 1 ! Xk ! and X X respectively represent the current position and the previous position k + 1 and Y k respectively represent the current position and the previous position YkYk1+1 kY k
coordinates, step length, and ϕ represents the heading value.value. The improved PDR represents coordinates, respectively; respectively; l lis the is the step length, and the heading The improved algorithm proposed in thisinstudy is shown in Figure 3: PDR algorithm proposed this study is shown in Figure 3: Adaptive step detection based on limb symmetry and dynamic threshold
Initial positioning
Step length calculation
Location prediction
Heading detection
Figure 3. 3. Improved PDR algorithm. algorithm. Figure Improved PDR
2.2.1. Step Detection Method Based on Limb Symmetry and Dynamic Threshold The zero crossing method [14] and wave peak detection method [15] are two kinds of step detection methods. Owing to the presence of errors and the inevitable jitter in human motion, steps are misjudged by the traditional zero crossing method, making it difficult to detect the true steps accurately, as shown in Figure 4. A constant threshold value is set in the wave peak detection algorithm. The steps will be counted when the acceleration exceeds the threshold. Figure 4 illustrates that the human body is not in an absolutely uniform state during the course of motion, and the peak
Sensors 2017, 17, 2065
5 of 20
2.2.1. Step Detection Method Based on Limb Symmetry and Dynamic Threshold
Ac c e le ra t io n
The zero crossing method [14] and wave peak detection method [15] are two kinds of step detection methods. Owing to the presence of errors and the inevitable jitter in human motion, steps are misjudged by the traditional zero crossing method, making it difficult to detect the true steps accurately, as shown in Figure 4. A constant threshold value is set in the wave peak detection algorithm. The steps will be counted when the acceleration exceeds the threshold. Figure 4 illustrates that the human body is not in an absolutely uniform state during the course of motion, and the peak acceleration of each complete gait range is not fixed. Therefore, the peak detection method cannot accurately calculate the Sensors 2017, 2065 In view of the shortcomings of the traditional step detection method,5 this of 20 study true number of 17, steps. proposes a new step detection method based on human motion characteristics and dynamic threshold detection method, this study proposes a new step detection method based on human motion to improve the accuracy of step detection. The inertial data in the process of walking show that the characteristics and dynamic threshold to improve the accuracy of step detection. The inertial data in angular left and right a certain and symmetry, and the features thevelocity process of of the walking show thatfeet the presents angular velocity of periodicity the left and right feet presents a certain of angular velocity curves around the Y-axis is particularly evident. Therefore, to increase the periodicity and symmetry, and the features of angular velocity curves around the Y-axis accuracy is of stepparticularly detection, evident. the traditional steptodetection is improved based on the the characteristics Therefore, increase method the accuracy of step detection, traditional step of the detection method improved based on the characteristics of the angular velocity of the Y-axis. angular velocity of theisY-axis.
5
[rad/s ] 0
-5 0
500
1000
1500
2000
2500
3000
3500
F ra m e s Figure Acceleration of both = 0.017 s). s). Figure 4. 4.Acceleration bothfeet. feet(1(1frame frame = 0.017
Figure 5 shows the change in angular velocity amplitude of the Y-axis. Step detection threshold
Figure the change angular velocity amplitude the Y-axis. At Step should5beshows constantly changinginand continuous because walking of is continuous. thedetection same time,threshold the shouldthreshold be constantly changing because is of continuous. the same the of the current gait and rangecontinuous is set according to thewalking amplitude the angular At velocity curvetime, of threshold of the current range set according to the of the angular velocity curve the previous three gait steps. The is dynamic threshold can amplitude be calculated using Equations (2)–(4). In of the previous three (4), steps. Theisdynamic be angular calculated usingofEquations (2)–(4). In Equation (4), v peak Equation the meanthreshold magnitudecan of the velocity the previous three steps, and (i )
( i −1)
( i −2)
i) ( i 1) magnitude ( i 2) v peak isv(the mean of the angular velocity of the previous three steps, and v peak , v peak , v peak peak , v peak , v peak are the peaks of the i, i + 1, and i + 2 steps, respectively. are the peaks of the i, i + 1, and i + 2 steps, respectively. 1 i) i 1) v peak 1 (v (peak v (peak v (i 2) ) (2) (i ) (i −1) peak ( i −2) 3 v peak = (v peak + v peak + v peak ) (2) 3
v l v(peak i) peak l = v (peak i)
v peak AV 0.5 0 thi l AV 2 thi 1AV th l AV 0.5 th l AV 2 +i 0.5 0 ≤ thi × l threshold AV>threshold Y Y
N N
Previous Previous heading heading
Previous Previous heading heading
Change Change value of value of angle angle
Current Current heading heading
Figure 7. 7. Flow Flow chart chart of of heading heading calculation. calculation. Figure Figure 7. Flow chart of heading calculation.
3. Data Data Fusion Fusion Strategy Strategy of of Dynamic Dynamic Pedestrian Pedestrian Positioning Positioning 3. Data Fusion Strategy of Dynamic Pedestrian Positioning 3. Althoughthe theimproved improvedPDR PDRmethod methodproposed proposedin inthis thisstudy studyis ismore moreaccurate accuratethan thanthe thetraditional traditional Although the improved PDR method proposed this study is more accurate than the traditional Although in PDR algorithm in positioning results, it can still be difficult to utilize in the application requirements PDR algorithm algorithm in in positioning positioning results, results, it it can can still still be be difficult difficult to to utilize utilize in in the the application application requirements requirements PDR of some indoor environments because of the existence of cumulative error. The positioning accuracy of some indoor environments because of the existence of cumulative error. The positioning accuracy of of some indoor environments because of the existence of cumulative error. The positioning accuracy of the UWB positioning method is relatively high, but its signal propagation is vulnerable to occlusion, thethe UWB positioning method isisrelatively of UWB positioning method relativelyhigh, high,but butits itssignal signalpropagation propagationisisvulnerable vulnerableto to occlusion, occlusion, and it cannot guarantee the continuous and stable positioning accuracy, causing its poor dynamic and it cannot guarantee the continuous and stable positioning accuracy, causing its poor and it cannot guarantee the continuous and stable positioning accuracy, causing its poor dynamic dynamic performance. The proper combination of the two methods can ensure high positioning accuracy and performance. The The proper proper combination combination of of the the two two methods methods can can ensure ensure high high positioning positioning accuracy accuracy and and performance. improve dynamic performance. improve dynamic dynamic performance. improve performance. The position data of of pedestrians pedestrians are are obtained obtained by by calculating calculating using using acceleration acceleration and and angular angular The position data of are by using acceleration and angular The position data pedestrians obtained calculating velocity information obtained from inertial sensors through the PDR algorithm. Distance information velocity information information obtained sensors through through the PDR algorithm. algorithm. Distance Distance information information velocity obtained from from inertial inertial sensors the PDR is obtained by calculating the corresponding output data of the UWB module using time-of-flight is obtained by calculating the corresponding output data of the UWB module using time-of-flight is obtained by calculating the corresponding output data of the UWB module using time-of-flight (TOF)method. method.The Thelocation locationaccuracy accuracyand anddynamic dynamicperformance performanceof ofthe theindoor indoorpositioning positioningsystem systemcan can (TOF) The location accuracy and dynamic performance of the indoor positioning system can (TOF) method. be improved by fusing the two methods using the UKF filter. be improved improved by by fusing be fusing the the two two methods methods using using the the UKF UKF filter. filter. The indoor positioning system designed in this work consists ofofaaahardware hardware terminal and The indoor positioning system designed in this workconsists consistsof hardwareterminal terminal and The indoor positioning system designed in this work and aa unit. TheThe hardware includes the UWB UWB sensors and IMU IMU (Figure 8). The The navigation unit of of anavigation navigation unit. hardware includes the UWB sensors and (Figure IMU (Figure 8). The navigation navigation unit. The hardware includes the sensors and 8). navigation unit the PC estimates the position of the pedestrian by fusing the location data of UWB and the location unitPC of estimates the PC estimates the position of the pedestrian bythe fusing the location data of UWB and the the the position of the pedestrian by fusing location data of UWB and the location and attitude calculated by IMU, thus plotting the pedestrian trajectory. location and attitude calculated by IMU, thus plotting the pedestrian trajectory. and attitude calculated by IMU, thus plotting the pedestrian trajectory. Navigation Unit Navigation Unit
Slave sensor 1 Slave sensor 1
PC PC
UWB Tag UWB Tag
UKF UKF
Slave sensor 2 Slave sensor 2 IMU IMU
PDR PDR
Slave sensor 3 Slave sensor 3
Figure 8. Structure diagram of the positioning system. Figure Figure 8. 8. Structure Structure diagram diagram of of the the positioning positioning system. system.
3.1. Data Data Fusion Fusion Strategy Strategy Based Based on on UKF UKF 3.1. Thebasic basicarchitecture architectureof ofthe thecombined combinedpositioning positioningsystem systemand andthe thenavigation navigationcoordinate coordinatesystem system The (n coordinate) and the carrier coordinate system (b coordinate) used in this work are shown in Figure (n coordinate) and the carrier coordinate system (b coordinate) used in this work are shown in Figure 9. The The integrated integrated positioning positioning system system used used by by the the algorithm algorithm is is mainly mainly composed composed of of two two parts: parts: PDR PDR 9. and UWB positioning systems. Among these positioning systems, the IMU placed on the left foot and and UWB positioning systems. Among these positioning systems, the IMU placed on the left foot and
Sensors 2017, 17, 2065
9 of 20
3.1. Data Fusion Strategy Based on UKF The basic architecture of the combined positioning system and the navigation coordinate system (n coordinate) and the carrier coordinate system (b coordinate) used in this work are shown in Figure 9. The integrated positioning system used by the algorithm is mainly composed of two parts: PDR9 of and Sensors 2017, 17, 2065 20 UWB positioning systems. Among these positioning systems, the IMU placed on the left foot and right obtains the thepedestrian pedestrianmotion motioninformation information through built-in accelerometer, gyroscope right foot obtains through thethe built-in accelerometer, gyroscope and magnetometer. Then, the ,improved PDR PDR algorithm is used to obtain the real-time position and travel and magnetometer. Then the improved algorithm is used to obtain the real-time position and trajectory of the pedestrian. The UWB tag placed the shoulder of a pedestrian calculates travel trajectory of the pedestrian. Thepositioning UWB positioning tagon placed on the shoulder of a pedestrian the distance positioning tag and the base station measuring TOF data between calculates thebetween distancethe between the positioning tag and the by base station by measuring TOF them. data On this basis, UKF [18,19] is UKF used [18,19] to fuseisthe position bycalculated IMU and the between them.using On this basis, using used to fuseinformation the positioncalculated information by pseudorange information measured bymeasured the UWB by tag, soUWB as to tag, realize thetoaccurate real-time indoor IMU and the pseudorange information the so as realize the accurate realpositioning pedestrians. time indoor of positioning of pedestrians.
U UWB label
TOF
n frame
O
TOF Distance matrix
Pseudo range1
TOF Distance matrix
Pseudo range2
TOF Distance matrix
Pseudo range3
UKF
N
Positioning error prediction
E Position
IMU(right foot) Z
b frame X
IMU(left foot)
Improved PDR
Localization information Localization information
Y
Figure Figure 9. 9. Data Datafusion fusion strategy. strategy.
3.2. 3.2. Error Error Model Model of of PDR/UWB PDR/UWB Combined Combined Positioning Positioning The The error error model model of of the the combined combined positioning positioning system system proposed proposed in in this this work work is is aa 15-dimensional 15-dimensional state state variable: variable: X = [ ϕ E ϕ N ϕU δv E δv N δvU δPE δPN δPU (11) X [E N U vE vN vU PE PN PU ε bx ε by ε bz ∇ ax ∇ ay ∇ az ] (11)
bx by bz ax ay az ]
where, ϕ E ϕ N ϕU represent the attitude angle errors in the east, north, and up directions; where, the attitude errors in and the up east, north, and directions; the velocity errors inangle the east, north, directions; NU represent U represent δv E δvNE δv δPEup δP N δPU are represent the gyroscope errors; ε bx ε by ∇ axand ∇ ayup∇directions; represent the ε bz velocity errors in the east, north, az are the vEtheposition vN vUerrors; acceleration errors. PE PN PU are the position errors; bx by bz represent the gyroscope errors; 4. Experimentation are the acceleration errors. ax
ay
az
In this work, an improved PDR algorithm for pedestrian localization is proposed by improving 4. Experimentation the traditional PDR algorithm according to the symmetry of the human body. A complete indoor positioning system is designed by fusing PDR algorithm and UWB positioning method using UKF, In this work, an improved PDR algorithm for pedestrian localization is proposed by improving which not only ensures the positioning accuracy under static conditions, but also improves the dynamic the traditional PDR algorithm according to the symmetry of the human body. A complete indoor performance of the positioning system effectively. To verify the effectiveness of the indoor positioning positioning system is designed by fusing PDR algorithm and UWB positioning method using UKF, system,not first, theensures localization accuracy ofaccuracy the improved traditional which only the positioning under PDR static algorithm conditions,and butthe also improvesPDR the algorithm is compared and the error of the two methods is analyzed. Experiments are then designed dynamic performance of the positioning system effectively. To verify the effectiveness of the indoor to verify thesystem, static positioning accuracy accuracy and dynamic of the proposed In the positioning first, the localization of theperformance improved PDR algorithm andmethod. the traditional staticalgorithm verification, the positioning results PDR positioning, positioning and PDR is compared and the errorofofthe theimproved two methods is analyzed. UWB Experiments are then
designed to verify the static positioning accuracy and dynamic performance of the proposed method. In the static verification, the positioning results of the improved PDR positioning, UWB positioning and UKF fusion positioning are analyzed, and the positioning accuracy and positioning error of the three methods are compared. In the dynamic test, a dynamic positioning reference system is designed based on capacitive touch sensing, the positioning system and the verification platform are set to
Sensors 2017, 17, 2065
10 of 20
UKF fusion positioning are analyzed, and the positioning accuracy and positioning error of the three methods are compared. In the dynamic test, a dynamic positioning reference system is designed based on capacitive touch sensing, the positioning system and the verification platform are set to clock Sensors 2017, 17, 2065 the positioning accuracy of each time is analyzed, and the error curve is plotted. 10 of 20 synchronization, 4.1. Comparison Positioning Results between Improved PDR andTraditional TraditionalPDR PDR 4.1. Comparison of of Positioning Results between Improved PDR and Figure1010shows showsthe thecomparison comparisonofoflocalization localizationresults resultsbetween betweenthe thetraditional traditional PDRand andthe the Figure PDR improved PDR algorithm this paper.The The test site a laboratory 11.7 long and wide.The The improved PDR algorithm inin this paper. test site is is a laboratory 11.7 mm long and 7.57.5mmwide. black curve the figure represents the walking trajectory, which a rectangle long and black curve inin the figure represents the walking trajectory, which is is a rectangle 8.58.5 mm long and 4.54.5 mm wide. The blue curve represents traditional PDR trajectory, and the red curve thepredictive predictive wide. The blue curve represents thethe traditional PDR trajectory, and the red curve is is the trajectory theimproved improvedPDR PDRalgorithm algorithmproposed proposedininthis thiswork. work.The The positioning accuracy this trajectory ofof the positioning accuracy ofof this method improved 20% compared with the traditional PDR algorithm, improvement that can method is is improved byby 20% compared with the traditional PDR algorithm, anan improvement that can provide thepositioning positioningaccuracy accuracyofofapproximately approximately51.25 51.25cm, cm,asasshown shownininTable Table2.2. provide the Route Improved PDR
PDR
8.5m
4.5m
Figure 10. Location results of traditional PDR and improved PDR. Figure 10. Location results of traditional PDR and improved PDR. Table 2. Error analysis of PDR and improved PDR. Table 2. Error analysis of PDR and improved PDR. Improved Improved PDR PDR Maximum error/m 0.95 Maximum error/m 0.95 Average error/mAverage error/m 0.51 0.51 Minimum error/m 0.32 Minimum error/m 0.32
PDR PDR 1.23 1.23 0.93 0.93 0.35 0.35
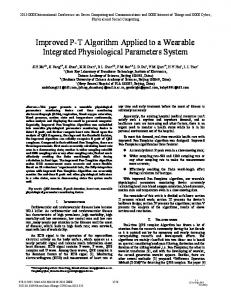
4.2. Static Verification 4.2. Static Verification ToTo verify the performance ofof the proposed indoor positioning method, thethe laboratory (Figure 11)11) verify the performance the proposed indoor positioning method, laboratory (Figure is is chosen asas thethe experimental site. Table 3 shows thethe node arrangement. TheThe walking trajectory is a is chosen experimental site. Table 3 shows node arrangement. walking trajectory rectangle 8.5 m long and 4.5 m wide, as represented by the red line. Figure 12 shows the layout of the a rectangle 8.5 m long and 4.5 m wide, as represented by the red line. Figure 12 shows the layout of the UWB base station, UWB sensors are important parts of UWB positioning, as they receive the signal UWB base station, UWB sensors are important parts of UWB positioning, as they receive the signal and provide the time and angle data required, asas well asasplay a role inin achieving the communication and provide the time and angle data required, well play a role achieving the communication between the tag and the positioning platform. Therefore, the number and layout of sensors will play between the tag and the positioning platform. Therefore, the number and layout of sensors will play a decisive role forfor positioning results. AA test platform using three base stations and one tab can cover a decisive role positioning results. test platform using three base stations and one tab can cover the entire laboratory and meet the requirements ofof positioning. InIn addition, thethe UWB tab is is atat least the entire laboratory and meet the requirements positioning. addition, UWB tab least 1515 cm away from the wall, table and other obstacles. Otherwise, the location data will be inaccurate. cm away from the wall, table and other obstacles. Otherwise, the location data will be inaccurate. The base station is placed 3 ft, more than 2 m, above the ground. The sensors can measure the TOF of the UWB pulses transmitted by the tags, therefore providing a centralized estimate of the tag positions.
Sensors 2017, 17, 2065
11 of 20
The base station is placed 3 ft, more than 2 m, above the ground. The sensors can measure the TOF of the UWB pulses transmitted by the tags, therefore providing a centralized estimate of the tag positions. Sensors 2017, 17, 2065 2065 11 of of 20 20 Sensors 2017, 17, 11
11
22
33
Figure 11. 11. Node Node arrangement arrangement and and experimental experimental site. site. Figure 11. Node arrangement and experimental site. Figure Table 3. 3. Node Node arrangement. arrangement. Table Table 3. Node arrangement. Number Number 11Number 1 22 2 33 3
Hardware Module Module Hardware Hardware Module UWB Tab UWB Tab IMU(R) UWB Tab IMU(R) IMU(L) IMU(R) IMU(L) IMU(L)
Figure 12. Outlet of UWB sensors. Figure 12. 12. Outlet Outlet of of UWB UWB sensors. sensors. Figure
In Figure 13, the blue dotted line represents the actual walking trajectory of the pedestrian In Figure Figure 13, 13, the the blue blue dotted dotted line line represents represents the the actual actual walking walking trajectory trajectory of of the the pedestrian pedestrian in in the the In in the experiment, and the black circle indicates the location data computed by UWB positioning, experiment, and the black circle indicates the location data computed by UWB positioning, and the experiment, and the black circle indicates the location data computed by UWB positioning, and the and the red fork represents the location data calculated by PDR. Based on the data shown in the red fork fork represents represents the the location location data data calculated calculated by by PDR. PDR. Based Based on on the the data data shown shown in in the the figure, figure, UWB UWB red figure, UWBcan positioning can provide higheraccuracy positioning accuracy compared with PDRHowever, positioning. positioning provide higher positioning compared with PDR positioning. an positioning can provide higher positioning accuracy compared with PDR positioning. However, an However, an obvious delay in the position calculation of UWB and a signal loss at the same time obvious delay delay in in the the position position calculation calculation of of UWB UWB and and aa signal signal loss loss at at the the same same time time are are observed, observed, obvious are observed, which cannot providepositioning continuous results. positioning results. PDR positioning can provide which cannot provide continuous PDR positioning can provide continuous which cannot provide continuous positioning results. PDR positioning can provide continuous continuous positioning data, but the accuracy cannot meet the requirements of indoor positioning. positioning data, data, but but the the accuracy accuracy cannot cannot meet meet the the requirements requirements of of indoor indoor positioning. positioning. positioning
Sensors 2017, 17, 2065 Sensors 2017, 17, 2065 Sensors 2017, 17, 2065
12 of 20 12 of 20 12 of 20
00
Route Route UWB UWB Improved PDR Improved PDR
-1 -1
East/m East/m
-2 -2 -3 -3 -4 -4 -5 -5 -6 -6 -7 -7-4 -4
-3 -3
-2 -2
-1 -1
00
11
22
33
44
55
66
North/m North/m Figure 13. Trajectories of UWB Figure 13. 13. Trajectories Trajectories of of UWB UWB and and improved improved PDR. PDR. Figure and improved PDR.
In Figure 14, the solution trajectory after UKF fusion is represented by green points with aa In with In Figure Figure 14, 14, the the solution solutiontrajectory trajectoryafter afterUKF UKFfusion fusionisisrepresented representedbybygreen greenpoints points with positioning accuracy of 10–15 cm. At the same time, it can be seen that the dynamic performance is positioning accuracy a positioning accuracyofof10–15 10–15cm. cm.AtAtthe thesame sametime, time,ititcan canbe beseen seenthat thatthe thedynamic dynamic performance performance is is greatly improved compared with the single UWB. The specific dynamic verification is introduced in greatly improved compared with the single UWB. The specific dynamic verification is introduced in greatly improved compared with the single UWB. The specific dynamic verification is introduced in the next section. the the next next section. section. 00
Route Route UWB UWB Improved PDR Improved PDR UKF UKF
-1 -1
East/m East/m
-2 -2 -3 -3 -4 -4 -5 -5 -6 -6 -7 -7-4 -4
-3 -3
-2 -2
-1 -1
00
11
22
33
44
55
66
North/m North/m Figure 14. Positioning trajectory through UKF filter. Figure Figure 14. 14. Positioning Positioning trajectory trajectory through through UKF UKF filter. filter.
The The error error analysis analysis of of the the three three methods methods is is shown shown in in Table Table 4: 4: The error analysis of the three methods is shown in Table 4: Table 4. Error analysis of three methods. Table 4. Error analysis of three methods. Table 4. Error analysis of three methods. Improved PDR UWB UWB/Improved PDR Improved PDR UWB UWB/Improved PDR Maximum error/m 0.95 0.54 0.33 Improved PDR UWB UWB/Improved0.33 PDR Maximum error/m 0.95 0.54 Average error/m 0.51 0.23 0.13 Average error/m 0.51 0.23 0.13 Maximum 0.54 0.33 0.02 Minimum error/merror/m 0.32 0.95 0.12 Minimum error/m 0.32 0.51 0.12 Average error/m 0.23 0.13 0.02 Minimum error/m 0.32 0.12 0.02
As As shown shown in in Table Table 4, 4, the the results results of of static static verification verification show show that that the the proposed proposed method method can can effectively improve the positioning accuracy under static positioning with an average positioning effectively improve the positioning accuracy under static positioning with an average positioning As 0.13 shown in Table 4, the results of static verification show that the proposed method can effectively error error of of 0.13 m. m. improve the positioning accuracy under static positioning with an average positioning error of 0.13 m. To verify To verify the the high high accuracy accuracy performance performance of of the the proposed proposed method method under under static static positioning, positioning, experiments experiments have have been been designed designed to to compare compare the the positioning positioning results results of of the the proposed proposed method method and and the the latest localization methods. In [20], the author proposed an approach based on support latest localization methods. In [20], the author proposed an approach based on support vector vector
Sensors 2017, 17, 2065
13 of 20
To2017, verify the high accuracy performance of the proposed method under static positioning, Sensors 17, 2065 13 of 20 experiments have been designed to compare the positioning results of the proposed method and regression to estimate the received strength non-site-surveyed positions thesupport environment. the latest localization methods. Insignal [20], the authoratproposed an approach basedofon vector The proposed methodthe could be used to strength improveatthe resolution of fingerprint-based indoor WiFi regression to estimate received signal non-site-surveyed positions of the environment. localization systems without increasing site survey effort. Inof[21], a new Wi-Fi based The proposed method could be used to the improve the resolution fingerprint-based indoorindoor WiFi localization technique is proposed that achieves significantly improvement of indoor positioning localization systems without increasing the site survey effort. In [21], a new Wi-Fi based indoor accuracy with the helpisofproposed Li-Fi assisted coefficient calibration.improvement The proposedoftechnique leverages localization technique that achieves significantly indoor positioning indoor existing Li-Fi lighting and Wi-Fi infrastructure, and results in a cost-effective and useraccuracy with the help of Li-Fi assisted coefficient calibration. The proposed technique leverages indoor convenient localization framework. In in this work, experimental study and existing Li-Fiindoor lightingaccurate and Wi-Fi infrastructure, and results a cost-effective and user-convenient measurements conductedframework. to verify the In performance the proposedstudy idea. and Experimental resultsare in indoor accurateare localization this work, of experimental measurements this work demonstrate an accuracy improvement of 80% compared with existing WiFi based conducted to verify the performance of the proposed idea. Experimental results in this work positioning systems. demonstrate an accuracy improvement of 80% compared with existing WiFi based positioning systems. As shown shown in in Figure Figure 15, 15, the the method in the As method in the current current work work has has better better static static positioning positioning performance performance than methods in [20,21]. Table 5 further proves the validity of the proposed method. than methods in [20,21]. Table 5 further proves the validity of the proposed method. In In addition, addition, Figure 15 15 confirms confirms that that the the method method has has better better dynamic dynamic performance. performance. Figure
Figure 15. Comparison between the the proposed proposed method method and and methods methods in in [20,21]. [20,21]. Figure 15. Comparison of of positioning positioning results results between Table 5. Error Error analysis analysis of of three three methods. methods. Table 5. Maximum error/m Maximum error/m Average error/m Average error/m Minimum error/m Minimum error/m
Method in [21] Method 1.78 in [21] 1.78 1.24 1.24 0.22 0.22
Method in [20] Method 0.72 in [20] 0.720.46 0.460.13 0.13
UWB/Improved PDR UWB/Improved 0.35PDR 0.35 0.15 0.15 0.05 0.05
4.3. Dynamic Verification 4.3. Dynamic Verification The dynamic positioning verification platform verifies the accuracy and real-time performance The dynamic positioning verification platform verifies the accuracy performance of of the indoor localization method. Therefore, the reference system mustand be real-time able to accurately locate the indoor localization method. the reference system must be able to accurately locate monitoring points and give Therefore, reference results quickly. The positioning reference system usedthe in monitoring and give reference results quickly. The positioning referencedynamic system used in this this work is points based on the principle of capacitive touch induction. The maximum positioning work onand the principle of capacitive touch induction. The maximum dynamic positioning error isisbased 6 cm, the dynamic response time is approximately 16 ms, which can meeterror the is 6 cm, and the response time is system. approximately 16 ms, which can meet the requirements of requirements of dynamic the positioning reference the positioning reference system. 4.3.1. Design of the Verification Platform The indoor positioning dynamic reference system used in this work is based on the principle of capacitive touch induction, Figure 16 shows a capacitive touch panel, where the middle green round is copper, which can be called a “key”. These buttons lead to a wire attached to the MCU, which detects whether the button is “pressed” by a wire. Figure 16 shows the capacitance sensing module
Sensors 2017, 17, 2065
14 of 20
4.3.1. Design of the Verification Platform The indoor positioning dynamic reference system used in this work is based on the principle of capacitive touch induction, Figure 16 shows a capacitive touch panel, where the middle green round is copper, which can be called a “key”. These buttons lead to a wire attached to the MCU, Sensors 2017, 17, 2065 14 of 20 whichSensors detects the button is “pressed” by a wire. Figure 16 shows the capacitance 2017,whether 17, 2065 14 of sensing 20 module designed in this work. The module is mainly composed of a capacitance induction chip designed in this work. The module is mainly composed of a capacitance induction chip MPR121 and designed in this work. The module is mainly composed of a capacitance induction chip MPR121 and MPR121 and achip master chip STM32F103C8T6, and the capacitor chip and MCU communicate a master STM32F103C8T6, and the capacitor induction chipinduction and MCU communicate by IIC. Each a master chip STM32F103C8T6, and the capacitor induction chip and MCU communicate by IIC. Each by IIC.capacitive Each capacitive sensing module capacitive sensing chips, each at 6 cm. sensing module contains six contains capacitivesix sensing chips, each spaced at 6 cm. Tospaced apply the capacitive sensing module contains six capacitive sensing chips, each spaced at 6 cm. To apply the capacitive sensing module to module pedestriantolocation detection, the circular copper strip is designed as astrip is To apply the capacitive sensing pedestrian location detection, the circular copper capacitive sensing module to pedestrian location detection, the circular copper strip is designed as a long strip shape. In the walking process, when the foot touches the capacitor module, the designed a long strip In shape. In the walking when thetouches foot touches the capacitor module, longasstrip shape. the walking process,process, when the foot the capacitor module, the the corresponding capacitance sensing chip will react immediately and output in real-time the pedestrian corresponding capacitance sensing chip and output in real-time the pedestrian corresponding capacitance sensing chipwill willreact react immediately immediately and output in real-time the pedestrian position. The low cost and fast response of the MPR121 chip provide the precondition of the validity position. The low cost and fast response of the MPR121 chip provide the precondition of the position. The low cost and fast response of the MPR121 chip provide the precondition ofvalidity the validity of the positioning reference system. the positioning reference system. of the of positioning reference system. Sensor Pad Sensor Pad
Ground Ground
Figure 16.16.Capacitance inductionprinciple. principle. Figure Capacitance induction Figure 16. Capacitance induction principle.
Figure 17 shows the capacitive sensing module: FigureFigure 17 shows the the capacitive sensing 17 shows capacitive sensingmodule: module:
Figure 17. Hardware of capacitor module. Figure 17. Hardware of capacitor module.
Figure 17. Hardware of capacitor module. In the test, the capacitive sensing module is arranged in a grid format, and each module is In the test, the capacitive sensing module is arranged in a grid format, and each module is connected by CAN bus (Figure 18). Each capacitor chip has itsgrid own numberand and marksmodule the Inconnected the test,by theaa capacitive sensing is arranged in aits is CAN bus (Figure 18).module Each capacitor chip has ownformat, number and each marks the coordinates of each chip. When the pedestrian walks in the area, the reference system can quickly coordinates of each When pedestrian walks theits area, reference system connected by a CAN bus chip. (Figure 18).the Each capacitor chipinhas ownthe number and markscan thequickly coordinates locate the coordinates of the pedestrian. When the pedestrian passes through the capacitance locate coordinates of the pedestrian. the pedestrian passes through capacitance of each chip.theWhen the pedestrian walks inWhen the area, the reference system canthequickly locate the induction module, the capacitance sensing chip quickly senses the foot action, and calculates the induction module, the capacitance sensing chip quickly senses the foot action, and calculates the coordinates of the pedestrian. When the pedestrian passes through the capacitance induction module, location of the pedestrian according to the positioning algorithm. The distance between each location of the pedestrian according to the positioning algorithm. The distance between each the capacitance sensingchip chipdetermines quickly senses the foot action, and the location the pedestrian capacitor sensing the positioning accuracy of calculates the positioning referenceofsystem. In capacitor sensing chip determines the positioning accuracy of the positioning reference system. In according to the The distance each capacitor determines this work, apositioning spacing of algorithm. 6 cm is selected, and the between positioning accuracy cansensing meet thechip precision this work, a spacing of 6 cm is selected, and the positioning accuracy can meet the precision requirements of the positioning reference system. At the same time, the module keeps the clock the positioning accuracy the positioning reference In this work, a spacing of 6 the cm clock is selected, requirements of the of positioning reference system. system. At the same time, the module keeps synchronized with the indoor positioning system, and the dynamic coordinates calculated by the and the positioningwith accuracy can meet the precision of coordinates the positioning reference system. synchronized the indoor positioning system, requirements and the dynamic calculated by the capacitance induction module and the proposed indoor positioning are compared to verify the module and proposed indoor positioning are compared to verify the and At thecapacitance same time,induction the module keeps thethe clock synchronized with the indoor positioning system, performance of the dynamic positioning method. performance of the dynamic positioning the dynamic coordinates calculated by themethod. capacitance induction module and the proposed indoor
positioning are compared to verify the performance of the dynamic positioning method.
Sensors 2017, 17, 2065
15 of 20
Sensors 2017, 17, 2065
15 of 20
Sensors 2017, 17, 2065
15 of 20
6cm
Sensor Pad
6 12 12 18
11 17
18
17
24 24
23 23
30 30
29 29
28 28
5 11
22 22
26
25
16
26
25
10 16
20
19
4 10
6cm
Sensor Pad
6
5
4
20
19
27 27
14
13
21 21
14
13
15
8
7
9 15
8
7
9
3
2
1
6cm
3
2
1
6cm
Figure 18. Outlet of capacitor module.
Figure 18.18.Outlet capacitor module. Figure Outlet of of capacitor module. Figure 19 shows the actual use of the capacitor module in the experiment. The capacitance Figure 19 shows the actual use of the capacitor module in the experiment. The capacitance
sensing quickly senses use the of foot and the navigation of the PC The shows the walking Figure 19chip shows the actual theaction, capacitor module in theunit experiment. capacitance sensing sensing chip quickly senses the foot action, and the navigation unit of the PC shows the walking trajectory. chip quickly senses the foot action, and the navigation unit of the PC shows the walking trajectory. trajectory.
Figure 19. Outlet of capacitor module.
Figure 19.Outlet Outlet of of capacitor Figure 19. capacitormodule. module.
4.3.2. Calculating the Dynamic Response Performance of the Dynamic Positioning Reference System
4.3.2. Calculating the Dynamic Response Performance of the Dynamic Positioning Reference System
4.3.2. Calculating thethe Dynamic Response Performance DynamicofPositioning Reference To verify real-time performance of this method,of thethe performance dynamic response, which System To verify the real-time performance of this method, the performance of dynamic response, which
is also an index, should not be ignored by the location verification system. The dynamic response Tois verify the real-time performance of this the performance dynamic response, also index, should not be ignored themethod, location verification system.ofThe dynamic responsewhich time an of the reference system based on theby principle of capacitive touch induction is mainly composed is alsotime anofindex, should not be ignored by the location verification system. The dynamic response time of the reference system basedtime, on the of capacitive touch mainlytime, composed four parts: ① Chip induction ②principle IIC communication time, ③ induction Algorithmisrunning ④ of the of reference based on the principle ofexpressed capacitive touch induction mainly time, composed of four ① Chip induction time, ② IIC time, ③ Algorithm ④ CANparts: bussystem communication time, all of which arecommunication in the following formula:is running CAN bus communication which are expressed in the following formula: 1 Chip 2ofIIC 3 Algorithm 4 CAN four parts: inductiontime, time,all communication time,
running time, tD tR tI t A tC (12) bus communication time, all of which are texpressed t t int the t following formula: (12) D
R
I
A
C
In the formula, 𝑡𝐷 represents the dynamic response time; 𝑡𝑅 represents the chip induction
In the formula, the dynamic 𝑡𝑅 represents thet Achip induction t D IIC = communication t R + t Iresponse + t A +time, ttime; time, which is 16 ms;𝑡𝐷𝑡𝐼 represents represents the 4 μs; represents C approximately
t A represents time, is 16running ms; 𝑡𝐼 time, represents the IIC communication time, approximately 4 μs; thewhich algorithm approximately 10 ns; and 𝑡𝐶 represents the CAN bus communication
(12)
Inthe the formula, t D represents the dynamic t R represents chip induction time, time, approximately 4 μs. The dynamic response time𝑡oftime; the reference systemthe is approximately algorithm running time, approximately 10response ns; and 𝐶 represents the CAN bus communication calculated by the formula. whichtime, is1616ms ms; t represents the IIC communication time, approximately 4 µs; t A represents the I approximately 4 μs. The dynamic response time of the reference system is approximately algorithm time, approximately 10 ns; and tC represents the CAN bus communication time, 16 msrunning calculated by the formula. approximately 4 µs. The dynamic response time of the reference system is approximately 16 ms calculated by the formula.
Sensors 2017, 17, 2065 Sensors 2017, 17, 2065
16 of 20 16 of 20
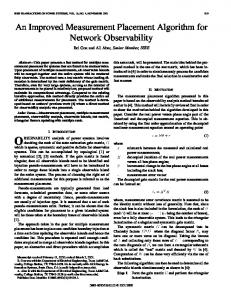
4.4. 4.4. Verification Verification Result Result In In daily daily activities, activities, the the speed speed of of the the human human body body is is constantly constantly changing. changing. Therefore, Therefore, the the dynamic dynamic positioning positioning performance performance under under different different moving moving speeds speeds needs needs to to be be analyzed analyzed to to verify verify the the dynamic dynamic performance test was was carried performance of of the the positioning positioning method. method. The The dynamic dynamic verification verification test carried out out in in three three groups, groups, and the results were compared with a pedestrian under normal walking speed, jogging and the results were compared with a pedestrian under normal walking speed, jogging and and fast fast running running speeds. speeds. The The speed speed of of movement movement was was 1, 1, 22 and and 33 m/s m/sin inthe thestraight straightline linemovement. movement. (1) Dynamic verification verification under under walking walking speed speed (1 (1 m/s): m/s): (1) Dynamic Figure position between combined positioning Figure 20 20 presents presents the the comparison comparison of of the the real-time real-time position between the the combined positioning system system when thethe walking speed is 1 is m/s. In theIn leftthe figure, the X system proposed proposedand andthe thereference reference system when walking speed 1 m/s. left figure, and Y axes the position the pedestrian, and the Z axis time. As shown in the X and represent Y axes represent the of position of the pedestrian, andrepresents the Z axisthe represents the time. the diagram, the normal walking speed, the integrated navigation system can continuously As shown in under the diagram, under the normal walking speed, the integrated navigation system can and stably output the output pedestrian position, and has and excellent dynamic performance and high continuously and stably the pedestrian position, has excellent dynamic performance and positioning accuracy. high positioning accuracy. UKF Reference Coordinate
3
3.9
East/m
Time/s
4 2 1
3.8 3.7
0 -1 0 1 2 3 3.5 North/m
3.6 4 3.5 -1
East/m
0
1 North/m
2
Figure 20. 20. Results for dynamic tracking tracking of of position position (1 (1 m/s). m/s). Figure
To verify the the positioning positioning accuracy method, the To verify accuracy of of the the method, the positioning positioning error error of of the the integrated integrated positioning method and the improved PDR method are compared under the dynamic positioning, as positioning method and the improved PDR method are compared under the dynamic positioning, shown in Figure 21:21: as shown in Figure UKF Improved PDR
0.7 0.6
Error/m
0.5 0.4 0.3 0.2 0.1 0 0
5
10
15 Time/s
20
25
30
Figure 21. 21. Location Location error error curve. curve. (1 (1 m/s). m/s). Figure
As shown in the diagram, the positioning error of the single PDR method will diverge with time, As shown in the diagram, the positioning error of the single PDR method will diverge with time, and the positioning accuracy of the combined method is stable owing to the correction of UWB. and the positioning accuracy of the combined method is stable owing to the correction of UWB. (2) Dynamic verification under jogging speed (2 m/s)
Sensors 2017, 17, 2065 Sensors 2017, 17, 2065
17 of 20 17 of 20
As shown in Figure 22, the method used in this work still has good dynamic performance under the motion of 217, m/s, and the positioning accuracy is slightly inferior to the positioning accuracy at (2) Dynamic under jogging speed (2 m/s) Sensors 2017, 2017,verification 2065 17 of of 20 20 Sensors 17, 2065 17 walking speed. The error curve is shown in Figure 23: As shown in Figure 22, 22, thethe method this workstill stillhas has good dynamic performance As shown shown in Figure Figure methodused usedin in this this work work good dynamic performance under under As in 22, the method used in still has good dynamic performance under the motion of 2 m/s, and the positioning accuracy is slightly inferior to the positioning accuracy at UKF the motion motion of of 22 m/s, m/s, and and the the positioning positioning accuracy accuracy is is slightly slightly inferior inferior to to the the positioning positioning accuracy accuracy at at the Reference walking speed. The error curve is shown in Figure 23: walking speed. TheThe error curve is isshown 23: walking speed. error curve shownin inFigure Figure 23: Coordinate
3.8
UKF UKF Reference Reference Coordinate Coordinate
3 3.6 3.8
0 2
East/m East/mEast/m
1
33
Time/s Time/s
Time/s
3.8
2
22
3 11
3.5 0
002 2 North/m0 0 North/m North/m
-2
33
East/m
3.5 3.5 East/m East/m
3.4 3.6 3.6 3.4 3.2 3.4 3.2 3.2 3
-2
-1
33-2 -2
0 North/m
1
2
00 11 22 North/m North/m Figure 22. Results for the dynamic tracking of position (2 m/s). -2 -2
-1 -1
Figure 22. Results for for the the dynamic dynamic tracking tracking of position (2 (2 m/s). m/s). Figure Results position Figure 22. 22. Results for the dynamic trackingofof position (2 m/s).
UKF UKF Improved UKF Improved PDR Improved PDR PDR
0.8 0.8 0.8 0.7 0.7
0.7 Error/m Error/m
Error/m
0.6 0.5
0.6 0.6 0.5 0.5
0.4 0.4 0.4 0.3 0.3 0.3 0.2 0.2 0.2 0.1 0.1 0.100 0
5 5 5
10
1010
15 15 15 Time/s Time/s
20 20 20
25 25 25
30 30
30
Time/s Figure 23.Location Location error error curve curve (2(2 m/s). Figure 23. Location m/s). Figure 23. error curve(2 m/s). Figure 23. Location error curve (2 m/s). (3) Dynamic Dynamic verification verification under under running running speed speed (3 (3 m/s): m/s): (3)
2 1
0 -2
33
3.4 3.4
22
3.4 3.2 3.2
11
00 -2 -2
00
North/m North/m
0 North/m
3.2 3.4 2.833 3.2 3.4 2.62.8 22 2.6 East/m East/m
East/m East/m East/m
Time/s
3
Time/s Time/s
(3) verification under running speed (3 m/s): m/s):of the method can meet the requirements of (3) Dynamic Dynamic verification under running (3 As shown shown in Figure Figure 24, the the dynamicspeed performance As in 24, dynamic performance of the method can meet the requirements of theshown humanin body in the the running situation, but, the the positioning positioning accuracy is lower lower thanrequirements that when when As Figure 24, the dynamic performance the method can meet the of the human body in running situation, but, accuracy is that As shown in Figure 24, the dynamic performance ofofthe method can meet thethan requirements of the walking and jogging, as shown in Figure 25. walking and jogging, as shown in Figure 25.but, the positioning accuracy is lower than that when the human body in the running situation, human body in the running situation, but, the positioning accuracy is lower than that when walking walking and jogging, Figure 25. and jogging, as shownasinshown Figurein25. UKF UKF Reference Reference Coordinate UKF Coordinate
Reference Coordinate
3.2 33 2.8 2.8 3 2.6 2.6
-1 2.8 -1
00 11 North/m North/m
22
3.4 3 3.2 2.8 24. 2 Figure 2.6 Figure Results for for the the dynamic dynamic tracking tracking of of position position (3 (3 m/s). m/s). 24.East/m Results 2.6 -1 0 1 North/m
Figure Figure 24. 24. Results Results for for the the dynamic dynamic tracking tracking of of position position (3 (3 m/s). m/s).
2
Sensors 2017, 17, 2065 Sensors 2017, 17, 2065
18 of 20 18 of 20
UKF Improved PDR
Error/m
1.5
1
0.5
0 0
5
10
15 Time/s
20
25
30
Figure25. 25.Location Locationerror errorcurve curve(3 (3m/s). m/s). Figure
The average average error error analysis analysis of of the the integrated integrated positioning positioning system system and and the the modified modified PDR PDR dynamic dynamic The verification test is shown in Table 6: verification test is shown in Table 6: Table6. 6. Error Erroranalysis analysisof ofdynamic dynamicexperiment. experiment. Table Speed/(m/s) Average Error of UKF/(m) Speed/(m/s) Average Error of UKF/(m) 1 0.129706 1 2 0.129706 0.155324 2 3 0.155324 0.195338 3 0.195338
Average Error of Improved PDR/(m) Average Error of Improved PDR/(m) 0.504338 0.504338 0.597811 0.597811 0.80149 0.80149
The experimental results show that the designed indoor positioning system can meet the The experimental that the at designed system can meet the dynamic performanceresults of the show human body normalindoor speed,positioning but the positioning accuracy is dynamic different performance of the human body aterror normal speed, gradually but the positioning accuracy of is different at the different at different speeds. The location increases with the increase speed, but error speeds. location with the increase of speed, but the error will not diverge will notThe diverge overerror timeincreases because gradually of the error correction of UWB. over time because of the error correction of UWB. 5. Conclusions 5. Conclusions In this work, an integrated positioning method of UWB and an improved PDR is proposed, and In this work, andisadvantages integrated positioning method UWB and anrespectively. improved PDR is proposed, the advantages and of UWB and PDRofare analyzed According to the and the advantages and body disadvantages and PDR analyzedis respectively. According to symmetry of the human in motion,of theUWB traditional PDRare algorithm improved, and the location the symmetry of the human body in motion, the traditional PDR algorithm is improved, and the data of two methods are fused to achieve complementary advantages, to meet the positioning location data ofintwo methods are fused to achieveAs complementary advantages, meet the positioning requirements complex indoor environments. UWB cannot complete theto positioning task when requirements in complex UWB cannot positioning when the signal is blocked, PDRindoor is usedenvironments. to make up forAs these defects. Atcomplete the samethe time, UWB can task effectively the signal is blocked, PDR is used to make up for these defects. At the same time, UWB can effectively eliminate the accumulated position, velocity and attitude error of the PDR algorithm. The eliminate the accumulated and attitude of the PDR algorithm. experimental experimental results showposition, that thevelocity positioning error of error this method is reduced by The 74.5% and 43.5% results show positioning error of this method is reduced by 74.5% and 43.5% compared to compared to that that the of PDR and UWB respectively. The average accuracy of the proposed method can that of PDR and UWB respectively. The average accuracy of the proposed method can reach 10–15 cm reach 10–15 cm under both dynamic and static conditions. under both dynamic and static conditions. Acknowledgments: This research was supported by the Youth Foundation Project of Jiangxi Science and Acknowledgments: This research was supported the Youth Foundation Project ofmethod Jiangxi is Science Technology Department (20161BAB212053), The by research on the bionic diagnosis basedand on Technology Department (20161BAB212053), The research on the bionic diagnosis method is based on comprehensive feature mining and complete intelligent identification for the shafting faults of rotating comprehensive feature mining and complete intelligent identification for the shafting faults of rotating machinery. machinery. Author Contributions: Pengzhan Chen contributed to the conception of the reported research and helped revise Author Contributions: Pengzhan Chen contributed the conception of the reported research and revise the manuscript. Ye Kuang contributed significantly toto the design and conduct of the experiments andhelped the analysis of as well Ye as contributed to the writing of the manuscript. Xiaoyue Chen helped design the experiments theresults, manuscript. Kuang contributed significantly to the design and conduct of the experiments and the and perform the analysis with analysis of results, as well as constructive contributed discussions. to the writing of the manuscript. Xiaoyue Chen helped design the experiments and perform the analysis with discussions. Conflicts of Interest: The authors declare noconstructive conflict of interest. Conflicts of Interest: The authors declare no conflict of interest.
Sensors 2017, 17, 2065
19 of 20
Abbreviations The following abbreviations are used in this manuscript: UWB UKF PDR IMU ZUPT
ultra-wide band unscented Kalman filter pedestrian dead reckoning inertial components zero-velocity update
References 1. 2. 3.
4. 5. 6. 7. 8. 9.
10. 11.
12.
13. 14. 15. 16.
17.
18.
Hazas, M.; Hopper, A. Broadband ultrasonic location systems for improved indoor positioning. IEEE Trans. Mob. Comput. 2006, 5, 536–547. [CrossRef] Oh, J.H.; Kim, D.; Lee, B.H. An Indoor Localization System for mobile robots using an active infrared positioning sensor. J. Ind. Intell. Inf. 2014, 2, 35–38. [CrossRef] Subhan, F.; Hasbullah, H.; Rozyyev, A.; Bakhsh, S.T. Indoor positioning in Bluetooth networks using fingerprinting and lateration approach. In Proceedings of the International Conference on Information Science and Applications, Jeju Island, Korea, 26–29 April 2011. [CrossRef] Fang, S.H.; Wang, C.H.; Huang, T.Y.; Yang, C.H.; Chen, Y.S. An Enhanced ZigBee Indoor Positioning System with an Ensemble Approach. Commun. Lett. IEEE 2012, 16, 564–567. [CrossRef] Saab, S.S.; Nakad, Z.S. A Standalone RFID Indoor Positioning System Using Passive Tags. IEEE Trans. Ind. Electron. 2011, 58, 1961–1970. [CrossRef] Yang, C.; Shao, H.R. WiFi-based indoor positioning. IEEE Commun. Mag. 2015, 53, 150–157. [CrossRef] Zhuang, Y.; El-Sheimy, N. Tightly-Coupled Integration of WiFi and MEMS Sensors on Handheld Devices for Indoor Pedestrian Navigation. IEEE Sens. J. 2015, 16, 224–234. [CrossRef] Li, X.; Wang, J.; Liu, C. A Bluetooth/PDR Integration Algorithm for an Indoor Positioning System. Sensors 2015, 15, 24862–24885. [CrossRef] [PubMed] Ruiz, A.R.J.; Granja, F.S.; Honorato, J.C.P.; Guevara, J.I.R. Accurate Pedestrian Indoor Navigation by Tightly Coupling Foot-Mounted IMU and RFID Measurements. IEEE Trans. Instrum. Meas. 2011, 61, 178–189. [CrossRef] Pittet, S.; Renaudin, V.; Merminod, B. UWB and MEMS based indoor navigation. J. Navig. 2008, 61, 369–384. [CrossRef] Zihajehzadeh, S.; Yoon, P.K.; Park, E.J. A magnetometer-free indoor human localization based on loosely coupled IMU/UWB fusion. In Proceedings of the 2015 37th Annual International Conference of the IEEE Engineering in Medicine and Biology Society (EMBC), Milan, Italy, 25–29 August 2015. [CrossRef] He, K.; Zhang, Y.; Zhu, Y.; Xia, W.; Jia, Z.; Shen, L. A hybrid indoor positioning system based on UWB and inertial navigation. In Proceedings of the International Conference on Wireless Communications & Signal Processing, Nanjing, China, 15–17 October 2015. [CrossRef] Zhuang, Y.; Lan, H.; Li, Y.; El-Sheimy, N. PDR/INS/WiFi Integration Based on Handheld Devices for Indoor Pedestrian Navigation. Micromachines 2015, 6, 793–812. [CrossRef] Jirawimut, R.; Ptasinski, P.; Garaj, V.; Cecelja, F.; Balachandran, W. A method for dead reckoning parameter correction in pedestrian navigation system. IEEE Trans. Instrum. Meas. 2003, 52, 209–215. [CrossRef] Cristianini, N.; Shawe-Taylor, J. An Introduction to Support Vector Machines: And Other Kernel-Based Learning Methods; Cambridge University Press: Cambridge, UK, 2000. Kappi, J.; Syrjarinne, J.; Saarinen, J. MEMS-IMU based pedestrian navigator for handheld devices. In Proceedings of the 14th International Technical Meeting of the Satellite Division of the Institute of Navigation (ION GPS 2001), Salt Lake City, UT, USA, 11–14 September 2001. Fang, L.; Antsaklis, P.J.; Montestruque, L.; McMickell, M.B.; Lemmon, M.; Sun, Y.; Fang, H.; Koutroulis, I.; Haenggi, M.; Xie, M.; et al. Design of a wireless assisted pedestrian dead reckoning system—The NavMote experience. IEEE Trans. Instrum. Meas. 2006, 54, 2342–2358. [CrossRef] Landolsi, M.A.; Mugaibel, A.H.; Almutairi, A.F. UKF-based channel estimation and LOS/NLOS classification in UWB wireless networks. J. Eng. Res. 2016, 4, 86–102. [CrossRef]
Sensors 2017, 17, 2065
19.
20. 21.
20 of 20
Jin, X.B.; Yan, S.; Nie, C.X. Tracking for indoor RFID system with UKF and EKF. In Proceedings of the International Conference on Estimation, Detection and Information Fusion, Harbin, China, 10–11 January 2015. [CrossRef] Hernanded, N.; Ocaña, M.; Alonso, J.M.; Kim, E. Continuous Space Estimation: Increasing WiFi-Based Indoor Localization Resolution without Increasing the Site-Survey Effort. Sensors 2017, 17, 147. [CrossRef] Huang, Q.; Zhang, Y.; Ge, Z.; Lu, C. Refining Wi-Fi based indoor localization with Li-Fi assisted model calibration in smart buildings. In Proceedings of the 16th International Conference on Computing in Civil and Building Engineering, Osaka, Japan, 6–8 July 2016; pp. 1358–1365. © 2017 by the authors. Licensee MDPI, Basel, Switzerland. This article is an open access article distributed under the terms and conditions of the Creative Commons Attribution (CC BY) license (http://creativecommons.org/licenses/by/4.0/).