F1000Research 2014, 2:93 Last updated: 31 JUL 2014
RESEARCH ARTICLE
Improved performance of sequence search approaches in remote homology detection [v2; ref status: indexed, http://f1000r.es/3qo] Adwait Govind Joshi1,2, Upadhyayula Surya Raghavender1, Ramanathan Sowdhamini1 1National Centre for Biological Sciences (Tata Institute of Fundamental Research), Gandhi Krishi Vignyan Kendra Campus, Bangalore,
560065, India 2Manipal University, Manipal, Karnataka, 576104, India
v2
First published: 22 Mar 2013, 2:93 (doi: 10.12688/f1000research.2-93.v1)
Open Peer Review
Latest published: 16 Jul 2014, 2:93 (doi: 10.12688/f1000research.2-93.v2)
Invited Referee Responses Abstract The protein sequence space is vast and diverse, spanning across different families. Biologically meaningful relationships exist between proteins at superfamily level. However, it is highly challenging to establish convincing relationships at the superfamily level by means of simple sequence searches. It is necessary to design a rigorous sequence search strategy to establish remote homology relationships and achieve high coverage. We have used iterative profile-based methods, along with constraints of sequence motifs, to specify search directions. We address the importance of multiple start points (queries) to achieve high coverage at protein superfamily level. We have devised strategies to employ a structural regime to search sequence space with good specificity and sensitivity. We employ two well-known sequence search methods, PSI-BLAST and PHI-BLAST, with multiple queries and multiple patterns to enhance homologue identification at the structural superfamily level. The study suggests that multiple queries improve sensitivity, while a pattern-constrained iterative sequence search becomes stringent at the initial stages, thereby driving the search in a specific direction and also achieves high coverage. This data mining approach has been applied to the entire structural superfamily database.
1
2
report
report
1
1
version 1 published 22 Mar 2013
version 2 published 16 Jul 2014
report
1 Saikat Chakrabarti, Indian Institute of Chemical Biology India 2 Mallur Srivatsan Madhusudhan, Indian Institute of Science Education and Research, Pune (IISER) India
Latest Comments No Comments Yet
F1000Research Page 1 of 19
F1000Research 2014, 2:93 Last updated: 31 JUL 2014
Corresponding author: Ramanathan Sowdhamini (
[email protected]) How to cite this article: Joshi AG, Raghavender US and Sowdhamini R. Improved performance of sequence search approaches in remote homology detection [v2; ref status: indexed, http://f1000r.es/3qo] F1000Research 2014, 2:93 (doi: 10.12688/f1000research.2-93.v2) Copyright: © 2014 Joshi AG et al. This is an open access article distributed under the terms of the Creative Commons Attribution Licence, which permits unrestricted use, distribution, and reproduction in any medium, provided the original work is properly cited. Data associated with the article are available under the terms of the Creative Commons Zero "No rights reserved" data waiver (CC0 1.0 Public domain dedication). Grant information: AGJ is supported by a fellowship (09/860(0104)/2010-EMR-I ) from the Council of Scientific and Industrial Research, India. USR is supported by Open Source Drug Discovery (OSDD) grant (OSDD/HCP001/11FYP/2011-12/124) from the Council of Scientific and Industrial Research (CSIR), India. RS thanks CSIR for OSDD Grant and Department of Biotechnology, India for financial support in the form of Centre for Excellence Grant (BT/01/COE/09/01). Competing interests: No competing interests were disclosed. First published: 22 Mar 2013, 2:93 (doi: 10.12688/f1000research.2-93.v1) First indexed: 28 Jul 2014, 2:93 (doi: 10.12688/f1000research.2-93.v2)
F1000Research Page 2 of 19
F1000Research 2014, 2:93 Last updated: 31 JUL 2014
REVISED Amendments from Version 1 We have now modified the title in response to comment from Dr. Chakrabarti to emphasize that it is a search approach not an algorithm. In such repetitive sequence searches, the best improvement is not only in high coverage but in achieving it with minimal computational time. In this respect, BRS-MP is recommended if the searches are likely to be exhaustive with multiple queries. Likewise, we mention recommended best strategies, such as gathering homologues at 60–90% and to retain motifs less than 15 residues, as suggested by Dr. Madhusudhan. These are now mentioned in the Conclusions. Since the search is against the NR sequence database, there is no firm gold standard to recognize false positives (point 3 made by Dr. Saikat Chakrabarti) and hence it is hard to compare the performance using traditional ROC curves. In response to comment from Dr. Madhusudhan, we have now included one more example on a protein superfamily. MQ or MPMQ approach, whilst being obvious choices, are also computationally demanding and this analysis on 12 superfamilies was a conscious attempt to measure the extent of gain/loss of coverage. We have now introduced a Venn diagram that provides a cumulative measure of coverage of these different approaches (Figure 4-A of the revised manuscript). We do find similar trends when the improved sequence search approach is applied on 1961 superfamilies. See referee reports
Introduction Protein sequence databases have grown enormously in recent times. Understanding protein homology within such huge sets of sequences requires tracing the divergence by mutation, substitution, insertion and deletion of residues1,2. Homologous proteins reflect similarity at sequence and structural levels, implying functional similarity3. This level of similarity broadens into the superfamily and the ways to deduce such relationships differ for both protein sequence and structure information4,5. There are different databases that organize sets of homologous proteins or protein superfamilies based on protein sequence and structure. These databases primarily employ protein domain information present in a sequence or structure. SCOP is a database that organizes the protein structural domain data in different hierarchical levels based on structural and functional information6. Many sequence search strategies use SCOP domains as a starting point for homology detection, focusing mainly at the superfamily level7,8. Structure-based classification is helpful to explore sequence space and helps in functional assignments by association of protein sequences9. Of the several methods developed for protein homology detection, the popular BLAST10 algorithm uses heuristics to search sequences and is able to detect close homologues, but fails in a few instances to establish relationships between distantly related proteins. To detect remote homologues, several methods such as, PSI-BLAST10 based on profiles, Hidden Markov Model (HMM)-based methods like HMMSEARCH and Jackhmmer11,12, pattern-based methods like PHI-BLAST13, intermediate sequence search methods such as Cascade PSI-BLAST14 and phylogenetic tree based searches like Treesearch15 have been developed. Methods such as CHASE incorporate some of the above methods in a combined manner to reinforce the sequence search16. Each of the above methods can be optimized for better performance by customizing their parameters and the way they are implemented for sequence searches. For instance, PSI-BLAST is
an iterative PSSM (Position Specific Scoring Matrix)-based remote homology detection method. In Cascade PSI-BLAST the search is iterated for several generations in a cascaded manner to improve remote homology detection14. It is important to select appropriate start points for sequence searches, especially for protein families and superfamilies, as different start points can result in different coverage. Park and co-workers have shown that remote homology detection is enhanced threefold for a set of related sequences in the form of a profile than merely searching with a single sequence as a query17. Anand and co-workers emphasized the use of multiple PSSMs as better detectors of remote homologues compared to a single query18. Thus, a search strategy can be designed to improve remote homology detection by choosing appropriate method(s) and starting point(s) for the search and by further optimizing the parameters. We have considered multi-member superfamilies from the PASS2 database19. PASS2 is a database of structural alignments of protein domains in a SCOP superfamily which share less than 40% mutual sequence identity. The strategy lies in using all the members of PASS2 superfamily, i.e., multiple members, and searching against the NR-Db (Non Redundant Database) available at the NCBI protein resource. We present our analysis based on a multiple query approach (MQ) for PSI-BLAST and PHI-BLAST. While using PHI-BLAST, for each query we obtain a set of patterns to initiate multiple searches per query, thereby adding an extra dimension for multiple patterns. The search approaches are evaluated at different coverage levels and a comparison of the two approaches using the two methods is presented. The methods are then applied to the entire PASS2 database.
Materials and methodology Dataset Different structural classes of proteins described in SCOP (version 1.75) were considered for remote homology detection. PASS219 based on the SCOP database and the ASTRAL compendium20, uses protein structural entries from the SCOP superfamily with less than 40% mutual sequence identity. Three superfamilies each from four structural classes from the PASS2 database (2008 version) were selected for this study (Table 1). Each superfamily contains a varied number of members, with some containing a single family and others with more than one family. The classification of families is based on SCOP hierarchies; PASS2 does not consider this classification. Therefore, different members within a PASS2 superfamily may be listed in different families in SCOP. The sequence search strategy devised, described below, was implemented for data mining the sequence homologues for structural superfamilies. Structural members from all the 1961 PASS2 superfamilies were used to search for sequence homologues.
Homologue detection Each member of the PASS2 superfamily was selected as a query for homologue detection and used to search against the NR-Db available at the NCBI ftp site (ftp://ftp.ncbi.nih.gov/blast/db/FASTA/ nr.gz). Two popular methods, PSI-BLAST and PHI-BLAST, from the BLAST 2.2.23+ package, were used for sequence searches (ftp://ftp.ncbi.nih.gov/blast/executables/blast+/2.2.23/ncbi-blast2.2.23+-x64-linux.tar.gz) (see Figure 1 for flow-chart). Page 3 of 19
F1000Research 2014, 2:93 Last updated: 31 JUL 2014
Table 1. List of 12 PASS2 superfamilies considered for sequence searches.
Class
SCOP Code
No. of members
No. of SCOP families
Size
Name of superfamily as in SCOP database
ALL α
47336
7
3
86
Acyl carrier protein-like
47565
5
1
120
Insect pheromone/odorantbinding proteins
48345
3
3
230
A virus capsid protein alpha helical domain
51101
3
1
147
Mannose-binding lectins
50203
10
2
100
Bacterial enterotoxins
ALL β
51069
4
1
248
Carbonic anhydrase
α AND β 55031
7
1
109
Bacterial exopeptidase dimerisation
55307
5
1
146
Tubulin C-terminal domain-like
55239
4
1
119
RuBisCo-small subunit
51971
9
3
243
Nucleotide-binding domain
51679
6
4
343
Bacterial-luciferase-like
51351
3
1
243
Triose phosphate isomerase
α OR β
Figure 1. Flowchart of workflow for the sequence search strategy.
PSI-BLAST was used for each query until convergence or a maximum of 20 iterations. The expectation value threshold (E-value: parameter –e) and inclusion threshold (parameter –h) were both set to 0.001. In all the iterations, all the alignment regions from each of the hit sequences were considered for further validation steps. Following this, a set of all unique sequence homologues (hits with a unique GenInfo Identifier (GI)) was recorded for each member. Sets of hits from all the members in a superfamily were pooled and filtered to generate a cumulative set of unique GIs for each superfamily.
Employing all members for homology detection for a superfamily is essentially the multiple query (MQ) approach in the sequence search strategy. For all the PASS2 superfamilies, data mining was carried out using this MQ approach and PSI-BLAST on the latest NR-Db version (June, 2012 release) to populate a sequence homologue database for structural superfamilies7. PHI-BLAST requires a query and a pattern pair as an input. A set of patterns was identified for each query and each query-pattern pair was used for the PHIBLAST search. The parameters and their values were maintained Page 4 of 19
F1000Research 2014, 2:93 Last updated: 31 JUL 2014
as in PSI-BLAST searches. The use of multiple patterns for all the multiple queries (MPMQ approach), for superfamily level homology detection was tested on the 12 PASS2 superfamilies.
through either of the sequence approaches (MQ and MPMQ) discussed above11. This approach of validation had earlier been effective in 80% of the examples23.
Pattern generation Homologues were searched for query sequence patterns, using stringent PSI-BLAST criteria (maximum 10 iterations, 10-10 E-value), in NR-Db. A set of hits with 60–90% sequence identity was selected for the pattern generation process. For queries with 15 amino acid positions, it is broken into subsets of patterns which meet all the above conditions and has a maximum length of 15. After the motif passes through all the above filters, it is converted into a PROSITE format pattern, and used for PHI-BLAST along with its query22.
Validation The PASS2 database contains structure-based sequence alignments which are used to build a HMM for each superfamily. Since these HMMs are built using structural alignments, they are highly sensitive in validating the sequence homologue obtained for a superfamily member as a true positive (TP). A library of all PASS2 superfamily HMMs was consulted using HMMSCAN, from the HMMER 3.0 package (ftp://selab.janelia.org/pub/software/hmmer3/3.0/hmmer-3.0linux-intel-x86_64.tar.gz), to validate all the sequence homologues
Coverage of sequence search approaches Coverage for both of the sequence search approaches was based on different levels. Firstly, a cumulative set of validated hits (Cum-TP) obtained for each superfamily should contain all the PASS2 members comprising that particular superfamily. Secondly, hits corresponding to the sequences of all the SCOP members for a given superfamily should be part of the Cum-TP set. Since, PASS2 contains superfamilies where no two members within a superfamily had >40% sequence identity, the coverage at the SCOP level reflects the sensitivity of the search strategy. Any cross-superfamily hits detected were considered as false positives (FP), even if they belong to the same fold. Thirdly, since sequences of all structural entries present in Protein Data Bank (PDB) obtained as hits are not classified into SCOP, all structural entries were inspected through HMM validation whether they associate to a single PASS2 superfamily HMM with no cross-superfamily associations. Finally, all the protein sequence homologues devoid of the above mentioned levels, with no structural information, were validated by HMMSCAN. In each superfamily, a set of cumulative true positives (Cum-TP) was formed with hits having unique GI obtained from different members. Therefore, from the set of all hits obtained for a superfamily (All Hits), the number of validated hits, i.e. Cum-TP, was used to calculate positive prediction value (PPV) for all 12 superfamilies in both approaches. The PPV is calculated as follows:
CumTP ∗ 100 PPV = All Hits A member with highest number of TPs was identified as a best representing sequence (BRS) and its TP count was also recorded (BRS-TP) for all superfamilies. Corresponding to Cum-TP, a ratio of BRS-TP/All Hits was also calculated. Using this value and CumTP, a percentage gain in the coverage (PGC) was recorded:
CumTP − BRSTP PGC = ∗ 100 CumTP The overlap between coverage achieved by the four cases – MPMQ approach, MQ approach, BRS from PHI-BLAST and PSI-BLAST was assessed by plotting a Venn diagram24. Following these fourcases, all the validated hits obtained for all the 12 superfamilies were segregated into 4 sets and used for plotting the Venn diagram. Page 5 of 19
F1000Research 2014, 2:93 Last updated: 31 JUL 2014
Results The sequence search strategy devised for remote homology detection was tested and implemented.
MQ approach for sequence search Selection of parameters. 12 structural superfamilies were considered for testing the sequence search strategy. These superfamilies span different classes (α, β, α/β, α+β) of proteins, as per the SCOP definitions. In the MQ approach, all the members from each of the 12 selected superfamilies were used as inputs for PSI-BLAST to search against the NR-Db. The performance of PSI-BLAST was optimized for different parameters. The E-value (parameter –e) and inclusion threshold (parameter –h) were optimized to 0.001, after testing it on a range of 1 to 10-10. An optimized E-value ensures better coverage with fewer FP. The number of iterations (parameter –j) was set to 20, after testing for values 5, 10 and 20. Some queries may converge within 5 iterations where the superfamily was less diverse as in the case of 50203 (Bacterial enterotoxin). However, for certain superfamilies like 55239 (RuBisCo-small subunit), none of the members could converge searches within 20 iterations explaining the abundance of sequence homologues for such proteins in the NR-Db. The rest of the parameters were set to default. Query retention. In the profile-based iterative (PSI-BLAST) run, the sensitivity and specificity depends upon the quality of the PSSM generated per iteration. If the PSSM gets corrupted, then the PSIBLAST search drifts to FPs by inclusion of non-homologous sequences. This can be traced by retention of the query in the PSSM throughout the iterations of a PSI-BLAST run. A query retained until the end reflects good optimization of search parameters and little corruption of the PSSM. To study the query retention for each member in a superfamily, the presence of query was inspected in all iterations for the PSI-BLAST run. The number of iterations was divided into four bins as 25%, 50%, 75% and 100% of total iterations for which the PSI-BLAST run lasted or converged. If a PSI-BLAST run converged at the 16th iteration, upper limits for these four bins were 4th, 8th, 12th and 16th iterations, respectively. The query was
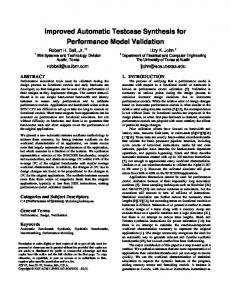
inspected for the occurrence in any of the four bins for all members of a superfamily. The frequency of queries last observed in any of the four bins is plotted in Figure 2-A. It reflects that out of a total of 70 queries from all 12 superfamilies, 45 queries were retained until the last iteration and 23 queries were not retained beyond 50% of iterations. However, it was observed that close homologues of the member query (sequence identity >90%) were retained until the last bin, thereby driving the PSI-BLAST search in the correct direction. Query drift was observed in only two out of the total 70 members from 12 different superfamilies. In the data mining of all structural superfamilies within the PASS2 database using the MQ approach, a similar trend was observed for the entire set of 10569 queries arising from 1961 superfamilies. 65% of queries were observed in the fourth bin, thereby ensuring the parameters selected for this scale-up of a MQ approach were acceptable. At times, the loss of query in the PSSM could still be beneficial, if the resultant PSSM is enriched by neighboring families, thus improving the coverage at the superfamily level. The PASS2 database includes the classification of superfamilies as single-member (SMS), two-member (TMS) and multi-member (MMS) based on the number of members in each superfamily. A distribution for the query retention in the four bins for these sections is shown in Figure 2-B. 68% of MMS queries have >50% query retention. However, in the MQ approach, few of the members in MMS are retained until the fourth bin to ensure better sequence search at the superfamily level.
MPMQ approach for sequence search Each member and pattern pair was used for sequence searches using PHI-BLAST. Similar to PSI-BLAST, the E-value (parameter -e) and inclusion threshold (parameter -h) were optimized to 0.001. The maximum number of iterations allowed was set to 20. While generating the patterns, it was ensured that patterns are specific and stringent to query. The length of the patterns generated varies from 3 to 40 amino acid positions; however during sequence search using PHI-BLAST, the pattern length of maximum 15 amino acid positions
Figure 2. Frequency of retention of query until 25%, 50%, 75% or 100% of iterations of PSI-BLAST is represented as four bins (0–25%, 26–50%, 51–75%, 76–100% respectively). (A) Number of member queries observed per bin for 12 superfamilies and (B) A stacked bar plot for all percentage query retention bins observed for all superfamily members in PASS2 database and also for the different sets of SMS (Single-Member Superfamily), TMS (Two-Member Superfamily) and MMS (Multi-Member Superfamily).
Page 6 of 19
F1000Research 2014, 2:93 Last updated: 31 JUL 2014
was used. Longer lengths reflect the long conserved stretches in the homologues selected for pattern generation. Multiple patterns for each query and multiple queries per superfamily (MPMQ approach) were used in the sequence searches. This gives rise to multiple start points to search in sequence space for each superfamily. Although PHI-BLAST essentially follows an iterative protocol like PSIBLAST, the hits identified in the first iteration differ as they are constrained to have the pattern specified along with the query. This ensures that the hits will be used to create the first PSSM for the rest of the iterative search process.
Validation and coverage The sequence hits obtained through MQ and MPMQ approaches were validated for TP and then inspected for the coverage at different levels for all 12 superfamilies. Coverage for PASS2 members. Every member was examined for its coverage of all the PASS2 members in the sequence search. All the members achieved full coverage when searched in the cumulative set of hits derived from sequence searches of all the PASS2 members. Every member of the two superfamilies, RuBisCo small subunit (SCOP code: 55239) and mannose-binding lectins (SCOP code: 51101), could identify all other members. But for the rest of the superfamilies, every member was unable to identify all the PASS2 members. Although, single members in such instances were unable to cover all the PASS2 members cumulatively, presence of all members gave rise to 100% coverage, thereby stating the importance of the use of multiple queries (MQ). Coverage for SCOP superfamily members. The coverage for all the SCOP superfamily members was inspected. The ratio of the number of sequence homologues of SCOP superfamily entries identified as TP to the total number of SCOP superfamily members is plotted as
shown in Figure 3 (blue bars). Almost all of the superfamilies obtained >90% coverage for all SCOP superfamily members. The only exception was the Bacterial enterotoxins superfamily with two families (SCOP code: 50203), where coverage was 25%. In the PASS2 database, this superfamily contained nine members from one SCOP family, and could identify most of its SCOP family members. But none of the members could identify cross-family members. However, there was only one member from the other family which was not sufficient to identify all the family members. This lack of coverage can be overcome if more members are included from the second family. For such a diverse superfamily, it is apparent that unless we use an MQ approach, it is difficult to achieve a reasonable coverage. In the rest of the superfamilies, some members were able to identify cross-family members while some could not identify any crossfamily member. In either case, all of the SCOP family members were covered. Cumulatively, all PASS2 members are strong enough to cover most of the SCOP superfamily members underlining the high sensitivity of MQ approach. Coverage for the structural (PDB) entries. The sequences of structural entries present in PDB were part of the All Hits set. These are newer entries which are yet to be accounted in the SCOP database. After PASS2-HMM validation, they were inspected for which superfamily they belong to and if they could associate to the query member’s superfamily. There were no cross-superfamily connections, highlighting the specificity of the sequence search through the MQ approach. Coverage with respect to the TP sequence homologues. While following the MQ approach over a huge database like NR-Db, it is necessary to achieve a maximum number of homologues (TP) and minimum unrelated sequences (FP). The use of multiple queries ensures a high TP count, while appropriate stringency of the E-value
Figure 3. Coverage of 12 superfamilies for the PSI-BLAST sequence search. The blue bars correspond to the percentage of SCOP members identified as hits. The red bars correspond to percentage ratio of TP (True Positives) identified by BRS (Best Representative Sequence) and All Hits (BRS-TP/All Hits). The green bars correspond to percentage ratio of Cumulative TP identified for a superfamily and All Hits (Cum-TP/All Hits). Page 7 of 19
F1000Research 2014, 2:93 Last updated: 31 JUL 2014
restricts occurrence of FPs. Following validation based on PASS2 HMMs, a set of Cum-TP was obtained and a ratio of Cum-TP/All Hits was calculated. Similarly, a BRS-TP/All Hits ratio was also calculated. Both these values are expressed as percentages as shown in Figure 3 (green and red bars respectively). The percentage of SCOP entries identified is also represented in Figure 3 for each superfamily. Considering the Cum-TP/All Hits ratio, Figure 3 shows the extent of coverage achieved by the BRS. It is clear that none of the BRS could achieve more than an 80% TP share of all the TPs identified at superfamily level. The average coverage for BRS across all superfamilies was ~50%. However, the Cum-TP/All Hits ratio was >90% for most of the superfamilies. In most of the cases, the false positives were hits which could not get associated with any PASS2HMM, but did not associate with any other superfamily apart from query superfamily. This may partly be due to the fact that the superfamily was so diverse that the PASS2-HMM itself was getting noisy due to the diversity or else the hit obtained was too distant to get validated using the HMM validation cut-offs. On average, false positives were 35%, but cumulative coverage by all queries for a complete superfamily is excellent (100% Cum-TP/All Hits ratio). Even in the case of a single-family superfamily (55031 - Bacterial exopeptidase dimerisation domain superfamily), all the members have attained a 100% Cum-TP/All Hits ratio.
MPMQ approach outperforms MQ approach The coverage of the MPMQ approach for all 12 superfamilies was equal to or better than the MQ approach at each level discussed above. All the PASS2 members were identified cumulatively by all the members. The coverage increased for all the superfamilies with respect to the SCOP superfamily (except for the 50203 superfamily which performed poorly even in the MQ approach). The sequences of structural (PDB) entries identified were associated with the query superfamily PASS2-HMM. Similar to PSI-BLAST, PHI-BLAST results also revealed that the use of multiple queries are beneficial for achieving better coverage at PASS2, SCOP and PDB level. The MPMQ approach was contrasted with the MQ approach (Table 2). The high PPV value suggests that both approaches were able to discern between the TP and FP. The MPMQ approach has relatively more start points than the MQ approach, employing pattern-constrained PHI-BLAST. The BRS identified in PSI-BLAST was also the same in the PHI-BLAST results for most of the superfamilies. However, the performance of BRS from PHI-BLAST using multiple patterns (MP) was even better for some of the superfamilies than MQ approach wherein all the queries were used through PSIBLAST for sequence search. There was an increase in the number of TP identified for BRS PHI-BLAST as against MQ in 5 out of 12 superfamilies. The TP count for all 12 superfamilies was highest for MPMQ with better PPV for 10 out of 12 superfamilies than MQ approach. Corresponding to the four approaches – MPMQ, MQ, BRS PHIBLAST and BRS PSI-BLAST, the total hit count with MPMQ was highest for each superfamily. Hence, all the hits obtained were combined for all 12 superfamilies together. Following the above mentioned
four approaches, the total hits-set (36111 hits), was segregated into four sets (MPMQ = 35680, MQ = 22744, BRS PHI-BLAST = 16909, BRS PSI-BLAST = 9079) and plotted as a Venn diagram (Figure 4-A). The total hit sets obtained by BRS of both PSI-BLAST and PHI-BLAST were subsets of the MQ and MPMQ approaches, respectively. However, it was interesting to find that 98% of the hits identified through MQ approach were covered by MPMQ, emphasizing the performance of MPMQ over MQ approach. Moreover, MPMQ approach covered 37% more hits which were not identified by MQ approach. The BRS PHI-BLAST approach alone was able to identify 15% more hits than MQ approach, suggesting that employment of BRS PHI-BLAST approach alone can augment the MQ approach for a gain in coverage. The MPMQ approach covers 99% of the total hit set. This was chosen as 100% coverage (% saturation value) to compare performance of rest of the 3 cases (viz. MQ approach, BRS PHI-BLAST and BRS PSI-BLAST) for each superfamily, separately. The performance was compared by plotting percentage coverage achieved using the BRS-TP/All Hits and Cum-TP/All Hits (Figure 4-B). The Cum-TP/ All Hits was highest in all superfamilies for the PHI-BLAST runs. This was chosen as 100% coverage (% saturation), to compare performance of BRS in MQ and MPMQ and Cum-TP/All Hits for the MQ approach. The Cum-TP/All Hits (MPMQ) was almost double for 55307 and 51971. This difference between MPMQ and MQ approaches was >20% for 9 out of 12 superfamilies. Although the MPMQ approach has promising results in comparison to the MQ approach, it is computationally very expensive. Each member in a superfamily generates multiple patterns, hence the higher the number of query-pattern pairs means the number of PHI-BLAST runs to be performed for the given superfamily increases proportionally. The performance of BRS in both approaches was also inspected. BRS for MPMQ achieved close to 80% coverage in 9 out of 12 superfamilies, with an exceptionally low value of 25% for the 51971 superfamily (a multi-family superfamily). Considering multi-family superfamilies (47336, 50203, 51679, 51971), the BRS of MPMQ could not cross 50% coverage compared with the Cum-TP/All Hits of MPMQ. This reinforces and lends support to the strategy of using multiple queries for sequence searches at the superfamily level. The MPMQ BRS was able to identify more TPs than Cum-TP obtained through MQ for the 51069, 55239, 51351 superfamilies, which are single-family superfamilies. This implies that BRS in isolation, through PHI-BLAST, can drive sequence searches attaining better coverage in such superfamilies, achieving a trade-off between coverage and computational time. However, performance of BRS is highly superfamily-specific.
Implementation of MQ approach for data mining GenDiS (Genomic Distribution of protein structural domain Superfamilies) is our previous database of sequence homologues based on PASS2, where sequence homologues for structural members are organized with respect to their genomic distribution at the superfamily level7. In an attempt to populate GenDiS, the MQ approach was implemented to search in sequence databases starting with all the 1961 PASS2 superfamilies. PASS2 classification of SMS, TMS and MMS relies on the number of constituent members in a superfamily. For each superfamily a percentage gain in coverage (PGC) value due to improvised strategies, in comparison with simple Page 8 of 19
F1000Research 2014, 2:93 Last updated: 31 JUL 2014
Table 2. Comparison of MQ (Multiple Query) and MPMQ (Multiple Patterns – Multiple Query) approaches for 12 superfamilies (SF – Superfamily, TP – True Positive, Cum-TP – Cumulative true positives, PPV – Positive Prediction Value, bold faced entries are BRS (Best Representative Sequence). SF
48345
47565
47336
51069
50203
51101
55307
Members
MQ Hits
TP
d1bvp11
99
97
d1qhda1
356
356
d1uf2c1
15
d1c3ya
722
d1ooha
MPMQ
Cum-TP
PPV
Hits
TP
468
0.99
101
98
390
390
15
16
16
706
1126
1089
702
701
1089
1056
d1p28a
807
792
1162
1151
d1r5ra
731
723
1155
1119
d2p70a1
681
678
1109
1105
d1dnya
857
851
1328
1328
d1dv5a
945
944
1494
1491
d1klpa
814
814
1197
1197
d1nq4a
750
741
1312
1310
d1t8ka
672
672
1153
1153
d1vkua
637
637
10
10
d2pnga1
905
894
1399
1396
d1jd0a
581
581
1154
1154
d1kopa
627
627
1346
1346
d1luga
572
572
1336
1336
d2znca
638
638
1360
1360
d1an8a1
94
94
95
95
d1enfa1
220
218
221
221
d1esfa1
220
219
221
221
d1et9a1
5
5
6
6
d1eu3a1
94
94
58
58
d1m4va1
101
101
102
102
d1prtb1
16
14
17
15
d1ty0a1
94
94
95
95
d1v1oa1
101
101
102
102
d3seba1
185
184
186
186
d1c3ma
599
496
607
501
d1ouwa
601
499
597
487
d1ugx1
602
507
616
507
d1rq2a2
621
585
1254
1184
d1tuba2
548
548
1081
1081
d1tubb2
598
598
1093
1093
d1w5ba2
734
723
1291
1279
d1w5fa2
692
687
1255
1250
1008
3368
1032
433
471
1977
0.98
0.99
1
0.99
0.76
0.97
Cum-TP
PPV
502
0.99
1259
0.95
4595
0.99
1508
1
436
0.99
506
0.81
3545
0.98
Page 9 of 19
F1000Research 2014, 2:93 Last updated: 31 JUL 2014
SF
55031
55239
51351
51679
51971
Members
MQ Hits
TP
d1cg2a2
1186
d1fnoa3
531
d1r3na2
615
615
d1vgya2
657
657
d1ysja2
807
d1z2la2 d2q43a2
Cum-TP
MPMQ Hits
TP
1186
2749
2749
530
675
671
1284
1283
1758
1758
807
1193
1193
642
642
1156
1155
941
941
1501
1501
d1bwvs-
691
691
1084
1084
d1rlbi-
580
580
1093
1093
d1svdm1-
592
592
1115
1115
d1wdds-
596
596
1124
1124
d1aw1a
819
819
1723
1723
d1hg3a
780
780
1818
1815
d1n55a
727
727
1578
1578
d1ezwa-
1180
1180
2440
2440
d1luca-
1312
1312
2025
2025
d1lucb-
1401
1401
2225
2225
d1nqka-
814
814
1803
1803
d1rhca-
1014
1014
2269
2269
d1tvla
661
661
1172
1172
d1c0pa1
1046
929
1813
1505
d1cjca2
966
964
1941
1941
d1h7wa4
864
864
1504
1503
d1i8ta1
631
619
2256
2071
d1lqta2
1011
1011
2144
2143
d1o94a3
1182
1181
2044
2044
d1ps9a3
577
575
1248
1248
d1usja1
626
615
1772
1674
d1ve9a1
808
722
2168
1646
3629
849
1356
3582
4215
PSI-BLAST runs, was calculated based on the preliminary results on 731 MMS (see Methods). The PGC was divided into four quarters and the frequency of superfamilies belonging to each quarter is shown in Figure 5-A. It was found that 532 superfamilies obtain >50% PGC. This observation strongly suggests the necessity of the MQ approach for remote homology detection, where the BRS alone collects fewer homologues. The MQ approach has to be implemented, especially for huge databases like NR-Db, to obtain improved coverage at the superfamily level. An inspection of the relation between number of members and PGC for MMS is shown in Figure 5-B, revealing an increase in PGC value with a rise in the number of members. The PGC values are extremely high for diverse and large superfamilies with more than 30 members.
Discussion We have employed structural entries from the PASS2 database to understand and improve sequence data mining techniques, where the searches are specifically meant for detection of distant homologues19.
PPV
0.99
1
1
1
0.9
Cum-TP
PPV
5615
0.99
1161
1
2183
0.99
5239
1
8031
0.9
SCOP is a good benchmark dataset to evaluate many homology detection methods6, but removing redundancy with respect to similar entries reduces the search time. However, with the use of the MQ approach for searching sequence space there is substantial improvement in coverage, albeit with an increase in search time. Use of PASS2 superfamily members as query is a trade-off, between use of all the SCOP members as query (ideal for best coverage) and a single query for the entire structural superfamily (ideal for saving computational time). MQ grants an additional advantage of coverage, which is revealed by considering coverage at different levels. A multi-member SCOP superfamily like 48345 (a virus capsid protein alpha helical domain), with multiple families (Orbivirus capsid [SCOP code: 48346], Phytoreovirus capsid [101395] and vp6, the major capsid protein of group A rotavirus [63596]), where each query gives an exclusive set of hits for each query (representing its SCOP family) through both the methods, use of multiple queries is inevitable to Page 10 of 19
F1000Research 2014, 2:93 Last updated: 31 JUL 2014
Figure 4. (A) Venn diagram representing four sets MPMQ (Multiple Pattern-Multiple Query), MQ (Multiple Query), BRS (Best Representative Sequence) from PHI-BLAST and BRS from PSI-BLAST comprising of all hits combined for 12 superfamilies. (B) Comparison of MPMQ and MQ with respective BRS-TP (Best Representative-True Positives). The blue and green bars correspond to TP obtained for BRS (BRS-TP) and cumulatively (Cum-TP) using all queries in the superfamily respectively using PSI-BLAST. The red and purple bars correspond similarly to TP obtained for BRS (BRS-TP) and cumulatively (Cum-TP) for all queries in the superfamily respectively using PHI-BLAST. All values are % saturation considering Cum-TP for PHI-BLAST (highest number of TP) as the saturation value for each superfamily.
250 A
B 54 256
200
# of Members
147
274 0-25%
26%-50%
51%-75%
150
100
50 76%-100% 0
0
20
40
60
80
100
PGC Figure 5. (A) Frequency of superfamilies based on PGC (Percentage Gain in Coverage) value divided into 4 bins (0–25%, 26–50%, 51–75%, 76–100%). (B) The PGC value plotted against number of members for all superfamilies.
Page 11 of 19
F1000Research 2014, 2:93 Last updated: 31 JUL 2014
achieve a better or even complete coverage. Similarly, another multimember, multi-family superfamily 51971 (Nucleotide-binding domain) contains nine PASS2 members divided among three SCOP families (N-terminal domain of adrenodoxin reductase-like [SCOP code: 51972] - five members, D-aminoacid oxidase, N-terminal domain [51979] - two members and UDP-galactopyranose mutase, N-terminal domain [69427] - two members). In this superfamily, PASS2 members of one family could not identify PASS2 members from other family. Owing to the diverse nature of this superfamily, it is necessary to adopt the MQ approach for achieving better coverage. Further, for this superfamily, MPMQ approach provided multiple start points and a two-fold increase in coverage as compared to MQ approach. However, it was not possible for PASS2 members to establish a cross-family connection. Therefore, choice of multiple queries with inclusion of their respective multiple patterns increases the overall coverage for diverse superfamilies. These findings comply with previous findings based on different search methods17,25. To date, many methods and approaches have been standardized for sequence searches at different levels of database complexity8,16–18,25. PSI-BLAST is in many instances a primary choice for homology detection. Efforts by different groups have enhanced the usage of PSI-BLAST, improving its sensitivity in remote homology detection14,26. PHI-BLAST, employing an initial pattern–hit initiation, enhances the search method before continuing over profile-based searches in subsequent iterations25. In the present study this has been shown to increase the coverage by >20% for many of the selected superfamilies. The simultaneous use of different methods greatly improves coverage, and the combinations of other methods needs to be investigated. The choice of BRS identified from MQ may provide a better option to run PHI-BLAST for a single query. This is beneficial considering an increase in coverage, but it is necessary to acknowledge that, multiple queries and their multiple patterns increase computational time tremendously for a given superfamily. Although for a multimember, multi-family superfamily, this may not effectively work, this approach can serve as a good trade-off between coverage and computational time for a superfamily with a single family. Also, for a very large superfamily (>20 members), the BRS-PHI-BLAST will be a good option to choose, however the choice of any of the discussed approaches for sequence search becomes superfamily specific.
Conclusion In the post-genomic era, there is a strong need to devise sequence search strategies for effective functional annotation. Functional annotation transfer and convincing establishment of sequence relationships are bottlenecks at low sequence identities. Hence, there is a constant quest for a robust computational program which is greedy on coverage and stringent in eliminating false positives. Remote homology detection through sequence searches has been addressed by various methods and approaches. Considering a protein structural superfamily, when an attempt to view its spread in the sequence space is made, one can resort to various methods and approaches. This study shows that a MQ approach proves beneficial for increasing
the coverage. The PASS2 database, which accounts for SCOP superfamily members that are structurally aligned, becomes a good start point to scan sequence space for good coverage at the complete SCOP superfamily level. Instead of using all SCOP members, using only PASS2 members with a MQ gives rise to good coverage in remote homology detection. In this paper, we have further compared the MQ approach using PSI-BLAST to a MPMQ using PHI-BLAST. The MPMQ approach totally outperforms the MQ approach. Use of patterns makes the initial pattern-hit initiation stringent, thus elevating the specificity of the search25. The study also indicates that a best representative sequence performs better with the PHI-BLAST than the BRS PSI-BLAST while better or equivalent to the MQ PSI-BLAST approach for certain superfamilies. Therefore the use of BRS PHI-BLAST can help save computational time and achieve better coverage. But this is superfamily-specific and for multi-family superfamilies, a query from one family may not be sufficient to associate with hits obtained from a query of a different family within a given superfamily. It is, therefore, necessary to resort to a MQ or MPMQ approach for getting reasonable coverage. The PGC obtained from data mining for all multi-member superfamilies from PASS2 points to the necessity of using multiple queries. The MQ approach is the easiest to follow for an end-user to achieve good coverage at superfamily level, while using MPMQ approach will improve the extent of sequence coverage. However, if there are many members (>10) in a superfamily, MQ approach alone can be adopted. Alternatively, for representative sequences, multiple pattern based PHI-BLAST can be used to achieve a trade-off between computational time and coverage. Thus, different methods and different approaches can be used to improve the sequence searches during remote homology detection.
Author contributions AGJ was involved in the benchmarking of sequence searches for 12 superfamilies. Both AGJ and USR contributed the sequence searches for the entire superfamily databases. RS was involved in the design and critical analysis of the work. AGJ wrote the first draft of the manuscript and both USR and RS contributed to the improvement of the manuscript. Competing interests No competing interests were disclosed. Grant information AGJ is supported by a fellowship (09/860(0104)/2010-EMR-I) by Council of Scientific and Industrial Research, India. USR is supported by Open Source Drug Discovery (OSDD) grant (OSDD/ HCP001/11FYP/2011-12/124) from Council of Scientific and Industrial Research (CSIR), India. RS thanks CSIR for OSDD Grant and Department of Biotechnology, India for financial support in the form of Centre for Excellence Grant (BT/01/COE/09/01). Acknowledgments All authors thank NCBS for infrastructural and general support.
Page 12 of 19
F1000Research 2014, 2:93 Last updated: 31 JUL 2014
References 1.
Thorne JL: Models of protein sequence evolution and their applications. Curr Opin Genet Dev. 2000; 10(6): 602–605. PubMed Abstract | Publisher Full Text
2.
Orengo CA, Thornton JM: Protein families and their evolution-a structural perspective. Annu Rev Biochem. 2005; 74: 867–900. PubMed Abstract | Publisher Full Text
3.
Lee D, Redfern O, Orengo C: Predicting protein function from sequence and structure. Nat Rev Mol Cell Biol. 2007; 8(12): 995–1005. PubMed Abstract | Publisher Full Text
4.
Whisstock JC, Lesk AM: Prediction of protein function from protein sequence and structure. Q Rev Biophys. 2003; 36(3): 307–340. PubMed Abstract | Publisher Full Text
5.
Watson JD, Laskowski RA, Thornton JM: Predicting protein function from sequence and structural data. Curr Opin Struct Biol. 2005; 15(3): 275–284. PubMed Abstract | Publisher Full Text
6.
Murzin AG, Brenner SE, Hubbard T, et al.: SCOP: a structural classification of proteins database for the investigation of sequences and structures. J Mol Biol. 1995; 247(4): 536–540. PubMed Abstract | Publisher Full Text
7.
Pugalenthi G: GenDiS: Genomic Distribution of protein structural domain Superfamilies. Nucleic Acids Res. 2004; 33(Database issue): D252–D255. PubMed Abstract | Publisher Full Text | Free Full Text
8.
Wistrand M, Sonnhammer E: Improved profile HMM performance by assessment of critical algorithmic features in SAM and HMMER. BMC Bioinformatics. 2005; 6: 99. PubMed Abstract | Publisher Full Text | Free Full Text
9.
Dessailly BH, Redfern OC, Cuff A, et al.: Exploiting structural classifications for function prediction: towards a domain grammar for protein function. Curr Opin Struct Biol. 2009; 19(3): 349–356. PubMed Abstract | Publisher Full Text | Free Full Text
10.
Altschul SF, Madden TL, Schäffer AA, et al.: Gapped BLAST and PSI-BLAST: a new generation of protein database search programs. Nucleic Acids Res. 1997; 25(17): 3389–3402. PubMed Abstract | Publisher Full Text | Free Full Text
11.
Eddy SR: A new generation of homology search tools based on probabilistic inference. Genome Inform. 2009; 23(1): 205–211. PubMed Abstract | Publisher Full Text
12.
Johnson LS, Eddy SR, Portugaly E: Hidden Markov model speed heuristic and iterative HMM search procedure. BMC Bioinformatics. 2010; 11: 431. PubMed Abstract | Publisher Full Text | Free Full Text
13.
Zhang Z, Miller W, Schäffer AA, et al.: Protein sequence similarity searches using patterns as seeds. Nucleic Acids Res. 1998; 26(17): 3986–3990. PubMed Abstract | Publisher Full Text | Free Full Text
14.
Sandhya S, Chakrabarti S, Abhinandan KR, et al.: Assessment of a rigorous transitive profile based search method to detect remotely similar proteins.
J Biomol Struct Dyn. 2005; 23(3): 283–298. PubMed Abstract | Publisher Full Text 15.
Rehmsmeier M, Vingron M: Phylogenetic information improves homology detection. Proteins. 2001; 45(4): 360–371. PubMed Abstract | Publisher Full Text
16.
Alam I, Dress A, Rehmsmeier M, et al.: Comparative homology agreement search: an effective combination of homology-search methods. Proc Natl Acad Sci U S A. 2004; 101(38): 13814–13819. PubMed Abstract | Publisher Full Text | Free Full Text
17.
Park J, Karplus K, Barrett C, et al.: Sequence comparisons using multiple sequences detect three times as many remote homologues as pairwise methods. J Mol Biol. 1998; 284(4): 1201–1210. PubMed Abstract | Publisher Full Text
18.
Anand B, Gowri VS, Srinivasan N: Use of multiple profiles corresponding to a sequence alignment enables effective detection of remote homologues. Bioinformatics. 2005; 21(12): 2821–2826. PubMed Abstract | Publisher Full Text
19.
Bhaduri A, Pugalenthi G, Sowdhamini R: PASS2: an automated database of protein alignments organised as structural superfamilies. BMC Bioinformatics. 2004; 5: 35. PubMed Abstract | Publisher Full Text | Free Full Text
20.
Chandonia JM, Hon G, Walker NS: The ASTRAL Compendium in 2004. Nucleic Acids Res. 2004; 32(Database issue): 189D-192. PubMed Abstract | Publisher Full Text | Free Full Text
21.
Larkin MA, Blackshields G, Brown NP, et al.: Clustal W and Clustal X version 2.0. Bioinformatics. 2007; 23(21): 2947–2948. PubMed Abstract | Publisher Full Text
22.
Bairoch A: PROSITE: a dictionary of sites and patterns in proteins. Nucleic Acids Res. 1991; 19(Suppl) 2241–2245. PubMed Abstract | Publisher Full Text | Free Full Text
23.
Mutt E, Mitra A, Sowdhamini R: Search for Protein Sequence Homologues that Display Considerable Domain Length Variations. Int J Knowl Dis Bioinform. 2011; 2(2): 55–77. Publisher Full Text
24.
Oliveros JC: VENNY. An interactive tool for comparing lists with Venn Diagrams. BioinfoGP of CNB-CSIC. 2007. Reference Source
25.
Bhaduri A, Ravishankar R, Sowdhamini R: Conserved spatially interacting motifs of protein superfamilies: application to fold recognition and function annotation of genome data. Proteins. 2004; 54(4) 657–670. PubMed Abstract | Publisher Full Text
26.
Lee MM, Chan MK, Bundschuh R: Simple is beautiful: a straightforward approach to improve the delineation of true and false positives in PSI-BLAST searches. Bioinformatics. 2008; 24(11): 1339–1343. PubMed Abstract | Publisher Full Text
Page 13 of 19
F1000Research 2014, 2:93 Last updated: 31 JUL 2014
Open Peer Review Current Referee Status: Referee Responses for Version 2 Saikat Chakrabarti Structural Biology & Bio-Informatics Division, Indian Institute of Chemical Biology, Kolkata, West Bengal, India Approved: 28 July 2014 Referee Report: 28 July 2014 doi:10.5256/f1000research.4848.r5565 The authors have successfully addressed most of the questions raised during the review of version 1. The representation of the data in version 2 explains the outcome of the experiments more satisfactorily. I have read this submission. I believe that I have an appropriate level of expertise to confirm that it is of an acceptable scientific standard. Competing Interests: I have co-authored papers with the corresponding author Dr. R. Sowdhamini, the last of which was published in 2008.
Referee Responses for Version 1 Mallur Srivatsan Madhusudhan Indian Institute of Science Education and Research, Pune (IISER), Pashan, Pune, India Approved: 17 April 2014 Referee Report: 17 April 2014 doi:10.5256/f1000research.1249.r3320 In this study the authors have sought to improve the alignment protocols that make use of standard tools such as PSI-BLAST and PHI-BLAST to find protein sequences that are remotely related to a query sequence. These distant relationships would be useful in annotating protein functions and designing experiments. The authors of this study use multiple queries (MQ) as a starting point to detect protein homologous relationships. The results from MQ are compared against another search that makes use of multiple patterns deduced from multiple queries (MPMQ). The protocol has been benchmarked on a set of 12 superfamilies consisting of different fold types. The manuscript is clearly presented and the plots and tables make their points clearly and unambiguously. I wish that the authors would clarify the following points: 1. For any given query sequence what would be the best strategy to adopt: MQ or MPMQ? How F1000Research Page 14 of 19
F1000Research 2014, 2:93 Last updated: 31 JUL 2014
1. For any given query sequence what would be the best strategy to adopt: MQ or MPMQ? How would a potential user make this judgement? The prescriptions (conclusions section) from the text are a little ambivalent, especially to a non-expert user/reader. 2. Demonstrating the efficacy of the search protocol over only 3 examples of each type of fold (alpha, beta, alpha/beta and alpha+beta) may not be sufficient. The authors should look to increase the benchmark size or show that that the current benchmark is statistically representative. While the authors have not discussed this in depth, the implication appears to be that the search results appear to be independent of fold type. Could the authors comment on whether this is true for other types of SCOP fold families (trans-membrane proteins etc)? 3. In the two parts of Figure 2, it is apparent that most PSSMs diverge (non-retention of query), if at all, within the first 50% of the iterations. Only very seldom does this happen afterwards. Is there a lesson one can learn from this result? Could future search strategies make use of this observation? Admittedly not all divergent PSSMs are detrimental to the finding of homologues, but is there a way one can control for this during the search? 4. It would be instructive to have a somewhat more quantitative description of the process in the abstract. I think that reader would benefit in knowing how much better the two protocols are (‘X’ more sequence homologues identified; or TP rate goes up by ‘X’ and FP rate reduces by ‘Y’ - or something along these lines).The same quantifiable measures should also be mentioned in the concluding section. Minor points 1. In the pattern generation sub-section of the Methods section, the authors say that in the event of inadequate number of hits they relax the stringent criteria of allowing hits between 60-90% in sequence identity to include sequences in the range 40-95%. Why is the range 40-95% not used uniformly? Is it the case that the pattern recognition program suffers from a drastic decrease in efficiency when decreasing sequence identity from 60 to 40%? 2. What happens in cases where patterns are >15 amino acids in length? How does the program deal with this? Does it break the patterns into subsets of lengths that have a maximum length of 15? I have read this submission. I believe that I have an appropriate level of expertise to confirm that it is of an acceptable scientific standard. Competing Interests: No competing interests were disclosed. 1 Comment
Author Response Ramanathan Sowdhamini, National Centre for Biological Sciences, India Posted: 11 Jun 2014 We thank Dr. Madhusudhan for providing constructive comments and interests. We had applied these enhanced sequence search strategies to 1961 superfamilies and we find similar trends. We have now mentioned recommended strategies and parameters in the Conclusion section. Having said that, some of the strategies, search directions and parameters depend on the sequence F1000Research Page 15 of 19
F1000Research 2014, 2:93 Last updated: 31 JUL 2014
said that, some of the strategies, search directions and parameters depend on the sequence dispersion and population of families and few decisions are highly family-specific. We have the following responses to specific comments: Major query 1: The MQ approach is easiest to follow as the user needs only the input sequences for a given superfamily. If the superfamily is very diverse with many members (>10), the MQ approach can be adopted, perhaps for representative sequences, to achieve a trade-off between computational time and coverage. We have now mentioned this in Conclusions of the revised manuscript. Minor query 1: It is difficult to obtain patterns qualifying stringent cut-offs followed (please refer to Methods section) when the sequence identity is reduced to 40% that will be applicable for all the superfamilies. It was important to ensure that patterns do reflect conservation, thereby rendering specificity to the PHI-BLAST searches. However, in cases where there were few homologues to deduce a conserved pattern even at 60% sequence identity, 40% sequence identity cut-off had to be employed. Minor query 2:If a pattern is >15 amino acids in length, the long pattern is broken into subsets of patterns which qualify all the stringent cut-offs and have a maximum length of 15. Competing Interests: No competing interests were disclosed.
Saikat Chakrabarti Structural Biology & Bio-Informatics Division, Indian Institute of Chemical Biology, Kolkata, West Bengal, India Approved with reservations: 11 March 2014 Referee Report: 11 March 2014 doi:10.5256/f1000research.1249.r3732 Concept and strategy of the work: In this study the authors have chosen 12 superfamilies from PASS2 database and collected the unique sets of hits generated by PSI-BLAST and PHI-BLAST against the non-redundant protein database (NR-Db) and checked how many of the sequences from the same superfamily are returned. There are quite a number of already published reports that dealt with the same problem but used different dataset and search algorithms. The same research group has already published a report where they have worked improvement of PSI-BLAST using different parameters1,2. Though neither the concept nor the strategy is novel, the search for a reliable method for detection of remote homologues is crucial. The report provides good information about the performance of PSI-BLAST and PHI-BLAST with a defined set of parameters and also compares their performance. This could be useful information for future researchers who want to use the same homology search algorithm. I believe clarification of the following points will improve the article. Major Comments:
1. The strategies (MQ) and (MPMQ) are not selected by choice. It is an obvious process. If one wants F1000Research Page 16 of 19
F1000Research 2014, 2:93 Last updated: 31 JUL 2014
1. The strategies (MQ) and (MPMQ) are not selected by choice. It is an obvious process. If one wants to check the remote homologues in a superfamily level; one has to take all the sequences of the superfamily. Also MP is an obvious requirement for PHI-BLAST. So MPMQ and MQ are rather obvious requirement for running the programs effectively. But it has been reported other way round. 2. The authors have used a small fraction of the total dataset (12 out of 1961 PASS2 super-families) for demonstration of their algorithm. Testing the algorithm on a larger dataset will be helpful for establishing the efficacy of the algorithm. As mentioned in the manuscript, the result for 1961 families should be produced. Also the basis for choosing only those 12 superfamilies is not clearly mentioned. Would the result be similar for any random 12 superfamilies? Also, will this process return the same robustness if we use the same superfamilies from SCOP, where the number of sequences is greater? 3. The authors have demonstrated the efficacy of the two methods by means of bar graphs (figures 3 and 4), which represent the coverage percentage of each of the approaches of MQ and MPMQ. It would be more informative if the authors provided receiver operating characteristics (ROC) plots to show the rate of detection true positives (TPs) and false positives (FPs) by the methods. 4. In reference to figure 4, the authors should explain a little more about why they have considered the coverage percentage of MPMQ approach as the saturation percentage. In this way the analysis is biased towards PHI-BLAST. In my opinion, the representation of the true coverage in percentage for both methods would be more informative. 5. It is commendable how the authors have been able to identify all possible patterns that might be a property of a superfamily. However, my suggestion would be to use other third party motif-finding programs (apart from MOTIFS for which no published references were provided) and consider the consensus motif predicted by all such software for a particular super-family. Information about those motifs will be helpful. Care should be taken to ensure that the motifs are biologically and statistically relevant. 6. In the Validation section, HMM profiles for all PASS2 superfamilies were made and homologues were scanned against the HMM. The filtering criteria here are not mentioned. They also mention that they have used two-step validations. But actually the second step is used for the hits which fail to associate with any superfamily by level 1 search. So the validation is not two-step but one-step for each set. 7. The title states “Improved performance of sequence search algorithms in remote homology detection” but there is no improvement measure taken for enhancing the performance. And both the algorithms are well established and widely used for remote homology search. So what is the new improvement of the algorithms made by the authors? 8. On page 6 maximum length of motif is mentioned as 40 and in the Materials and methodology section (page 4) the same is mentioned as 15. Which one has actually been used? 9. In figure 5b, where increase in PGC is compared with number of member in families, the relation between the two is not clear. There are few families with more than 30 members. But only those few families have very high PGC. So a statistical relation is required. From the graph it looks like the algorithm is biased towards multi-member families which contain a high number (more than 30) of members. The efficiency of the program must be tested on single member, two-member and F1000Research Page 17 of 19
9. F1000Research 2014, 2:93 Last updated: 31 JUL 2014
of members. The efficiency of the program must be tested on single member, two-member and those multimember families which have less than 30 members. Minor Comments:1. The authors could throw some light on the fact as to why they have not used all the family members of a SCOP superfamily as has been mentioned in PASS2. For example, in table 1 the number of families mentioned by the authors for SCOP superfamily 47336 is 7, whereas PASS2 lists at 8. 2. It is not really clear what the coverage of the Best Representative Sequence (BRS) of a superfamily dataset says about the performance of the method. 3. In the collection of the hit pool, unique sets of homologues (hits) for each superfamily were taken. That means each protein in the sets of hits is associated with one query protein of the superfamily protein only. How is that done? The method is not clear. 4. In graph 2A and 2B the y-axes are comparable so they should be in same scale. 5. Both in figure 3 and 4 if the one-member, two-member and multi-member families were marked separately the result would be more prominent. 6. In the explanation of coverage, where the differences of the superfamilies are explained in terms of their constituent families, actual examples or a case study may be more helpful.
References 1. Sandhya S, Chakrabarti S, Abhinandan KR, Sowdhamini R, Srinivasan N: Assessment of a rigorous transitive profile based search method to detect remotely similar proteins. J Biomol Struct Dyn. 2005; 23 (3): 283-298 PubMed Abstract | Publisher Full Text 2. Bhadra R, Sandhya S, Abhinandan KR, Chakrabarti S, Sowdhamini R, Srinivasan N: Cascade PSI-BLAST webserver : a remote homology search tool for relating protein domains. Nucleic Acids Res. 2006; 34 (web server issue): 143-146 PubMed Abstract | Free Full Text | Publisher Full Text I have read this submission. I believe that I have an appropriate level of expertise to confirm that it is of an acceptable scientific standard, however I have significant reservations, as outlined above. Competing Interests: I have co-authored papers with the corresponding author Dr. R. Sowdhamini, the last of which was published in 2008. 1 Comment
Author Response Ramanathan Sowdhamini, National Centre for Biological Sciences, India Posted: 11 Jun 2014 We thank Dr. Saikat Chakrabarti for their useful and encouraging comments. The MQ or MPMQ approach, whilst being obvious choices, are also computationally demanding and this analysis on 12 superfamilies was a conscious attempt to measure the extent of gain/loss of coverage. We have F1000Research Page 18 of 19
F1000Research 2014, 2:93 Last updated: 31 JUL 2014
12 superfamilies was a conscious attempt to measure the extent of gain/loss of coverage. We have now introduced a Venn diagram that provides a cumulative measure of coverage of these different approaches (Figure 4-A of the revised manuscript). We do find similar trends when applied on the 1961 superfamilies. We had meant this as an approach, not an algorithm, and we have now modified the title as well. Our responses to specific comments: Major Comment 3: We agree that statistical measures such as ROC curves are often employed to compare methods and approaches. However, since our sequence searches are against the non-redundant sequence database, despite our independent validations, there is no clear negative dataset nor is there is a ‘gold standard’. So it is not possible to measure FPR and compare them for different approaches. Major Comment 4: A comparison of hits by different approaches shows that MPMQ achieves the highest coverage. We now provide a Venn diagram (Figure 4-A of the revised manuscript) that provides a quantitative idea of the performance of different approaches in terms of accumulation of validated hits. Major Comment 6: It is true that the validation is a one-step procedure since single-query HMM validation was invariably performed for validation of all the hits; however, it was necessary only when full-Sf HMM failed to validate. Major Comment 7: We are sorry that the title has been misleading. We had meant to say ‘ sequence search approaches’ since there is indeed no new algorithm involved. We have now modified the title. However, the improvement in performance is to arrive at a good balance between sequence coverage and computational time. Our analysis shows that it is possible to obtain good coverage by employing multiple queries followed by multiple patterns for the best representative query. Minor query 1:We have used all the members from PASS2 for all the sequence searches. In case of superfamily 47336, the current updated version of PASS2 has 8 members whereas the earlier (2008) version has been used for the analysis of 12 superfamilies. Therefore there is a difference in the number of members. Minor query 4: We are sorry about this and we have now modified Figure 2 in the revised manuscript. Minor query 6: Thanks for this suggestion. We are now including one more example in the revised manuscript to convey practical biological application. Competing Interests: No competing interests were disclosed.
F1000Research Page 19 of 19