This paper also presents a concise description of the backprojection image processing used. 1. INTRODUCTION. In the ... feet, it carried the C-band (5.4 GHz) microASAR, a small ... with the time-aligned motion data enables better SAR image.
IMPROVED PROCESSING OF THE CASIE SAR DATA Craig Stringham and David G. Long Microwave Earth Remote Sensing Laboratory Brigham Young University 459 CB, Provo, UT 84602 ABSTRACT In the summer 2009 NASA Characterization of Arctic Sea Ice Experiment (CASIE09), the microASAR, a small LFMCW SAR, was operated on the NASA Sierra unmanned aerial system (UAS). An overview of the microASAR and its role in CASIE09 are described in [1, 2]. While the limitations in the motion measurements stored with the microASAR data during the CASIE09 mission originally precluded full motion compensation, motion data collected for other CASIE sensors can be employed to improve the SAR image focus and calibration. This paper describes the methodology developed to time-align this motion data and applies this data along with other algorithm improvements to the processing of the microASAR data. This paper also presents a concise description of the backprojection image processing used. 1. INTRODUCTION In the summer of 2009, the NASA Sierra unmanned aerial system (UAS) flew over the Arctic Ocean off the coast of Svalbard, Norway; collecting sea ice imagery for the Characterization of Arctic Sea Ice Experiment (CASIE09). During 31 flight hours at altitudes ranging from 1000 to 1500 feet, it carried the C-band (5.4 GHz) microASAR, a small LFM-CW SAR, which collected data over most of this period. The microASAR design and its role in the CASIE09 mission have been well described in [1, 2]. Limitations in the motion measurements stored with the microASAR data during the CASIE09 mission originally precluded full motion compensation; however, motion data collected for other CASIE sensors can be employed to improve the SAR image focus and calibration. The 160 MHz bandwidth microASAR is an LFM-CW SAR operated in a bistatic antenna configuration, where the transmit and receive lines are continuously operating. Due to the simultaneous transmit and receive, the received signal is contaminated with a strong signal (feed-through) of the transmit signal due to the proximity of the transmit antenna. To suppress the feed-through component, the received signal is “de-chirped” by mixing the received signal with the transmit signal, followed by a high pass filter. This is effective in suppressing feed-through to enable digital recording of
978-1-4577-1005-6/11/$26.00 ©2011 IEEE
1389
SAR data. However, the residual feedthrough component can be exploited to estimate the system time delay. In addition, the nadir return can be used to improve the height estimate and remove GPS altitude biases. Coupling these estimates with the time-aligned motion data enables better SAR image focusing and calibration. This paper summarizes how these estimates are made and how they are used in processing the CASIE09 data to improve SAR image quality and accuracy. A description of how the time-domain backprojection processor is implemented on a graphics processor unit (GPU) is also provided. 2. CASIE FOCUSING The microASAR images were originally formed using the range doppler algorithm (RDA), which provided good results considering the relative sparsity of the GPS position data that was included in the microASAR data stream. However, the particular flight characteristics of the UAS during CASIE09 unexpectedly caused degradation of the overall SAR image quality. Fortunately, an alternate source of higher-rate GPS and attitude data, recorded for other sensors on the CASIE09 platform, became available. To take advantage of the attitude and position data, an algorithm to temporally align it with recorded data is developed. 2.1. Motion Measurement Alignment The original GPS data recorded with the SAR data was synchronized with a software interrupt which introduced some variability in the time alignment of raw SAR data and the GPS positions. After some experimentation, it was determined that sufficient time accuracy can be obtained by linearly regressing the PRF and GPS time tags and then interpolating the GPS data to the start of each LFM chirp. In the initial regression the average time-delay between the recorded SAR data and the GPS time tags is chosen by visually matching altitude changes in the GPS data to the nadir line in the SAR range compressed data. Fine tuning of the alignment is accomplished by minimizing the entropy of a small image section using a range of values near the visual alignment. The
IGARSS 2011
2.66
System Delay (m)
Amplitude
500
0
−500
2.64
2.62
2.6 0
500
1000
1500
0
Sample
50
100
150
200
250
300
Time (min)
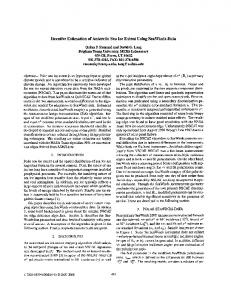
Fig. 1: Plot of the microASAR feed-through signal (line with kink at left) and the estimated sinusoid (smooth curve). new motion data is then interpolated based on the interpolated GPS time of each LFM chirp. To further enhance the signal time-of-flight precision, thereby improving the image focusing, estimates of the system cable delay and the range to nadir are extracted from the SAR data. 2.2. Estimating the System Cable Delay The system delay includes the time delay due to the cables in the transmit and receive lines, as well as the time delay caused by the RF components of the SAR system. The cable delay is usually estimated by the length of the cables. However, the RF component delay exhibits some variation with temperature. In this case the system delay can be estimated from the data collected during the flight using the residual feed-through. The transmit feed-through component is dominated by the signal coupling from the transmit antenna into the receive antenna over the fixed, short distance separating the antennas. In the dechirped data, this small distance shows up as a lowfrequency sinusoid. This signal component can be isolated using a low-pass filter. The sinusoid frequency is related to the measured antenna spacing and the system delay by the chirp rate. Hence, the system delay can be computed from the estimated frequency of the dechirped feed-through. Conventional FFT-based methods for estimating the feedthrough are limited by the range resolution of the SAR system (about 1m); however, the feed-through component is dominated by a single sinusoid so it can be accurately estimated with much finer resolution using the MUSIC algorithm [3]. Fig. 1 illustrates the isolated feed-through component and the sinusoid computed from the estimated frequency. We note that the impulse response of the processing filter creates an artifact at the start of the signal. To prevent this from adversely affecting the estimate, the sinusoid fit is made using only the
1390
Fig. 2: Plot of the feed-through distance estimate over a 4.5 hour in-flight data collection. The time variation is attributed to the temperature dependence of the RF components.
last 85% of the data. As illustrated in Fig. 2, the system delay varies somewhat over a flight. Though this variation is small, estimating this delay and compensating for it in the processing improves the image focus because the slant range is more accurately determined.
2.3. Altitude Improvement Using Nadir Return The quality of the SAR image is impacted by the accuracy of the platform height. During the CASIE09 flights, the GPS altitude observations exhibited a bias that varied approximately linearly with altitude. Because the CASIE09 flights were all conducted over open ocean and low-topography sea ice, the platform height can be estimated accurately from the SAR data. Such height estimates can be used to correct for biases in the GPS altitude measurements. Linear regression is used to estimate the altitude bias error. Prior to aligning the new motion data, the nadir altitude bias is removed. To minimize noise in the altitude bias estimates, the bias estimates are first smoothed using a median filter. To illustrate, Fig. 3 plots the GPS-derived height and the system delay-corrected range compressed data. The nadir echo is evident in the range compressed data where it corresponds to the top of the horizontal dark band in the plot. The shift in the band is the result of a change in altitude of the UAS. Note that there is no return signal for slant ranges shorter than the altitude (between the top of the box and the gray band). Also note that the difference between the nadir altitude and the GPS altitude changes with UAS altitude.
Range(m)
200 300 400 500 0
200
400
600
800
1000
Time(s) Fig. 3: Image of the altitude measurements (white dashed line) superimposed on the range compressed data. Slant range extends from the top of the image. The aircraft made a large altitude change around 800s. Note the difference in the altitude bias for the different operating altitudes.
3. BACKPROJECTION PROCESSING In order to produce the highest quality images, the SAR backprojection algorithm is used for image formation. In contrast to traditional Fourier based methods such as the RDA and chirp scaling algorithm (CSA), the time-domain backprojection algorithm can optimally account for all flight conditions including non-ideal motion and gain fluctuation due to attitude variations. One of the easiest ways to describe time-domain backprojection processing is that, from the point of view of a single pixel, it is a matched filter: for each pixel, the range compressed data from a given LFM chirp is interpolated to the slant-range distance from the pixel to the platform. Then the matched filter phase is computed based on the distance, which corrects for motion during the pulse (see [4]). The interpolated range-compressed signal and matched phase are multiplied and summed over all the chirps in the azimuth window. Sub-aperture processing can be accomplished by creating appropriate azimuth windows, and incoherently summing the sub-aperture images. The main disadvantage of backprojection processing is that it is computationally intensive. The processing time is generally an order of magnitude greater than Fourier based methods; however, the framework of backprojection allow it to be easily run on massively parallel processors like the NVIDIA Graphics Cards. There have been other developments of GPU based backprojection implementations such as [5]. Our implementation was developed independently from [5] and is optimized for accuracy and efficiency. We start by using a zero padded FFT to range compress
1391
and interpolate a section of the dechirped data. The size of the section is determined by the global memory available on the GPU. The backprojection kernel begins by creating a thread for each pixel that is approximately within the antenna beamwidth for the section of pulses. Each thread calculates the distance and angle from the pixel location to each antenna position in the section. Using the distance and angle calculations, several independent images are created for several subapertures, each using the appropriate azimuth window. Once all the pulses have been processed the sub-aperture images are incoherently summed to create a reduced speckle image. In terms of accuracy and efficiency, using the FFT interpolation on the GPU takes advantage of the speedups provided by the CUFFT library and provides both an accurate and fast interpolation. FFT interpolation increases the size of the SAR data and precludes it from being kept in shared memory. Using shared memory can dramatically reduce global memory accesses because shared memory has 150x lower latency. To mitigate this penalty, each thread processes multiple pulses and multiple sub-aperture images, which allows the scheduler to hide the global memory latency behind more computations. Also, the antenna positions are stored in the shared memory to reduce global memory accesses. The achieved speed-up varies depending on the SAR parameters and the number of sub-apertures used. In the most basic setup, the GPU implementation achieved a 300x speedup over a similarly structured C implementation. In the CASIE processing, we use several sub-apertures with appropriate windowing so the data is processed in approximately real time. 4. RESULTS Using the GPU based implementation described, over 2000 km of SAR images were generated. Fig. 4 shows a sample of the improved images. The flight track is at the top of the images, with the direction of travel from left to right. Both images were collected at an average altitude of approximately 450m. The new images have much better defined ice edges and even though there is considerable aircraft motion, the images are well focused. We note that the rolloff in the far range is due to lower surface backscatter due to the incidence angle increase and the reduction of antenna gain. 5. CONCLUSIONS This paper has presented the methodology used to improve the image processing of the CASIE-09 SAR data set. This process has required the application of several estimation techniques in order to align the GPS data with the SAR data, to account for a time variant system delay, and to correct for GPS altitude biases. The achieved improvement was made possible by the GPU backprojection implementation and the accurate alignment of the high-precision GPS data to the SAR data. Based upon this work, future efforts will be made
Ground Range (m)
6.3◦ 22.4◦
200
35.5◦
400
45.5◦
600
52.8◦
800
58.3◦
1000
62.5◦ 0
200 400 600 800 1000 1200 1400 1600 1800 2000 2200 2400 2600 2800 3000 3200 3400 3600 3800
65.8◦
Azimuth (m) 6.3◦ 22.4◦
Ground Range (m)
200
35.5◦
400
45.5◦ 600
52.8◦ 58.3◦
800
62.5◦ 1000 0
200
400
600
800
1000
1200
1400
1600
1800
2000
2200
2400
2600
65.8◦
Azimuth (m) Fig. 4: Two examples of the improved imagery. The left y axis specifies the ground range in meters, and the right y axis is the incidence angle. to improve the calibration of the CASIE images. The improvement thus made enhance the scientific research into the characterization of Arctic sea ice. 6. REFERENCES [1] E. Zaugg, D. Long, M. Edwards, M. Fladeland, R. Kolyer, I. Crocker, J. Maslanik, U. Herzfeld, and B. Wallin, “Using the MicroASAR on the NASA SIERRA UAS in the Characterization of Arctic Sea Ice Experiment,” in Radar Conference, 2010 IEEE, May 2010, pp. 271 –276. [2] David G. Long, Evan Zaugg, Matthew Edwards, and James Maslanik, “The microASAR experiment on CASIE-09,” in Geoscience and Remote Sensing Sympo-
1392
sium (IGARSS), 2010 IEEE International, July 2010, pp. 3466 –3469. [3] Monson H. Hayes, Statistical digital signal processing and modeling, John Wiley & Sons, 1996. [4] E.C. Zaugg and D.G. Long, “Generalized frequencydomain sar processing,” Geoscience and Remote Sensing, IEEE Transactions on, vol. 47, no. 11, pp. 3761 –3773, Nov. 2009. [5] A. Fasih and T. Hartley, “GPU-accelerated synthetic aperture radar backprojection in CUDA,” in Radar Conference, 2010 IEEE. IEEE, 2010, pp. 1408–1413.