downlink sessions, increased autonomy is required for planetary rovers. Specifically NASA's planned 2003 and 2005 Mars rover missions must incorporate ...
Autonomous Robots, 2, 1{20 (1992)
c 1992 Kluwer Academic Publishers, Boston. Manufactured in The Netherlands.
Improved Rover State Estimation in Challenging Terrain BRIAN D. HOFFMAN Silicon Graphics Computer Systems, Mountain View, CA 94043 ERIC T. BAUMGARTNER Science and Technology Development Section, Jet Propulsion Laboratory, California Institute of Technology, Pasadena, CA 91109 TERRY HUNTSBERGER Science and Technology Development Section, Jet Propulsion Laboratory, California Institute of Technology, Pasadena, CA 91109 PAUL S. SCHENKER Science and Technology Development Section, Jet Propulsion Laboratory, California Institute of Technology, Pasadena, CA 91109 Received April 29, 1991; Revised October 11, 1991 Editors: B. Bhanu
Abstract. Given ambitious mission objectives and long delay times between command-uplink/data-
downlink sessions, increased autonomy is required for planetary rovers. Speci cally NASA's planned 2003 and 2005 Mars rover missions must incorporate increased autonomy if their desired mission goals are to be realized. Increased autonomy, including autonomous path planning and navigation to user designated goals, relies on good quality estimates of the rover's state, e.g., its position and orientation relative to some initial reference frame. The challenging terrain over which the rover will necessarily traverse tends to seriously degrade a dead-reckoned state estimate, given severe wheel slip and/or interaction with obstacles. In this paper, we present the implementation of a complete rover navigation system. First, the system is able to adaptively construct semi-sparse terrain maps based on the current ground texture and distances to possible nearby obstacles. Second, the rover is able to match successively constructed terrain maps to obtain a vision-based state estimate which can then be fused with wheel odometry to obtain a much improved state estimate. Finally the rover makes use of this state estimate to perform autonomous real-time path planning and navigation to user designated goals. Reactive obstacle avoidance is also implemented for roaming in an environment in the absence of a user designated goal. The system is demonstrated in soft soil and relatively dense rock elds, achieving state estimates that are signi cantly improved with respect to dead reckoning alone (e.g., 0.38 m mean absolute error vs. 1.34 m), and successfully navigating in multiple trials to user designated goals.
Keywords: Planetary rovers, range map registration, state estimation, vision-based navigation, realtime path planning
2
Ho�man, et al.
1. Introduction The current planned objectives for NASA's 2003 and 2005 rover missions to Mars include traverses totalling tens of kilometers over time frames spanning several months to a year or more. During these long distance traverses, various science functions are to be performed, including sample acquisition and cache, spectroscopic imaging, and micro-camera imaging. In order to adequately achieve these ambitious desired mission objectives within the speci ed time frames, increased autonomy must be introduced and incorporated into NASA's 2003 and 2005 rover platforms. Given the long delay times between command-uplink/datadownlink sessions, increased levels of autonomy are necessary as teleoperation is infeasible, and high average ground speeds are desired to maximize the amount of terrain covered per unit time. Of paramount importance are the robustness and computational e�ciency of the autonomous behaviors. Not only must these algorithms function with repeated high performance in varying terrains and lighting conditions, but also work well given the computational limitations imposed by radiation hardened processor requirements and power constraints. Additionally, these behaviors must take into account and be capable of dealing with the possiblities of sensor and actuator degradation over time, both during transit, landing, and surface traverse. Thus, we desire that the rover be capable of robustly and autonomously completing the following tasks: � obstacle avoidance � state estimation � real time path planning to a user designated
goal
For the task of obstacle avoidance, we desire that the rover be capable of distinguishing hazardous terrain features with a minimum of false positives or undetected hazards, with the former requiring the rover to perform excessive, time-consuming avoidance maneuvers, and the latter being directly hazardous to the health and well being of the rover. Our implementation of autonomous obstacle avoidance, using a texture-based interest operator
[6] coupled with stereo correlation and triangulation, is adaptive to varying surface and lighting conditions, as well as being computationally e�cient. We achieve this adaptive behavior through application of the texture-based interest operator to the local vicinity of the rover wheels in the current images returned by the stereo cameras. Any changes in local terrain or lighting will automatically be incorporated into the newly computed texture signature since the search for \interesting" points uses the texture signature as a baseline. In soft soil wheel slip is signi cant which results in the degradation of the dead-reckoned vehicle state estimate. Likewise, in terrain with dense rock elds, obstacle climbing and numerous rotations in obstacle avoidance maneuvers signi cantly degrade the dead-reckoned vehicle estimate. Thus, for the task of state estimation, we implement an extended Kalman lter [2] to fuse together two estimates of the rover's change in state. The rst estimate is visually based, using terrain maps generated at each frame during the rover's traverse to derive the rover's betweenframe rotation and translation [27]. The second estimate is the dead-reckoned estimate, using the rover's wheel odometry. The combination of the two measurements gives us a much more accurate state estimate than relying on either measurement alone. Finally, using our current Kalman ltered state estimate, we replan our desired path to the user designated goal at each point, using a real-time 2D potential ow based path planning methodology [7], addressing the problem of real-time path planning to a user designated goal. These approaches have been experimentally veri ed using NASA/JPL's Lightweight Survivable Rover (LSR), pictured in gure 12. Much work has been accomplished in range map generation, some using \texture" features such as corners or other interest point identi cation methods [3] [17]. Some generation algorithms use parallel approaches [8]. Given the computational limitations imposed by power and radiation hardened processor requirements, we have developed a computationally e�cient semi-sparse range map generation algorithm which is adaptive to both distance and texture. Likewise, much work has been done in the area of mobile vehicle state estimation, often using vi-
Improved Rover State Estimation in Challenging Terrain sion [2] [29] [17] [11] [19] [9] [14], or using statistical estimation techniques to fuse together measurements of the rover state from multiple sensors [2] [17] [22]. However, experimental validation of statistical state estimation approaches such as Kalman ltering for mobile robotics generally has only been performed in laboratory settings, benign terrain [2] [17], [14], [4], or only in simulation [22]. Some navigation performance evaluation has been pursued [16], however state estimation during these trials relied on dead reckoning only. We add experimental validation in very di�cult terrain, as might be experienced by a rover performing traverses on the surface of Mars, and show the feasibility of such a sensor fusion approach to state estimation. It is important to note that the state estimation framework is not only valid for vision-based measurements as described in this paper, but also for other sensor inputs as well. In fact researchers have investigated the use of inertial navigation sensors (INS) in rover systems [1], [21]. The fusion of vision-based map registration with wheel odometry provides an important capability for determining rover state estimates that can only be enhanced by the inclusion of additional independent measurement sources such as INS systems. Potential ow based path planning has been demonstrated extensively in simulation, [7], [13], [5], [20], [12] (see [7] for more references). Here, we demonstrate experimental validation of realtime path planning using harmonic potentials in dynamic environments. Additionally, the environment consists of soft soil and relatively dense rock elds, thus validating the potential ow based path planning approach in complex and challenging environments. Finally, we show the uni cation of these techniques in system level trials. This includes adaptive range map generation, successive range map registration, Kalman ltering of vision and dead reckoning for improved state estimation, and real time path planning using potential ow-based methodologies. Path planning relies on the state estimate, which relies on Kalman ltering of the registered range maps, which relies on range map registration, all within an integrated system. However, this also validates each of the system
3
components, which could of course be used separately in another system. The following section presents the implementation of our vision-based rover state estimator. This includes a discussion of our high-speed texture-based adaptive range map generation algorithm in section 2.1. It also includes an overview of our implementation of a range map registration algorithm [27] in section 2.2. We detail our approach to rover state estimation via Kalman ltering of vision (the output of the range map registration algorithm) and dead reckoning in section 3. An overview of the experimental system is presented in section 4 with the results being presented in section 5. As part of the results, we discuss two navigation methodologies, reactive obstacle avoidance in section 5.1 and real-time path planning to a user designated goal in section 5.2. Finally, we present conclusions and plans for future e�orts in section 6.
2. Adaptive Range Map Generation and Vison-Based State Estimation To address the problem of robust and computationally e�cient obstacle avoidance, we present the novel application of a texture-based interest operator in conjunction with stereo correlation and triangulation to generate range maps, adaptive in re nement to both texture and distance. 2.1. Adaptive Range Map Generation
To adaptively generate a terrain map, we begin by acquiring a stereo image pair from the rover navigation cameras. A sample image pair may be seen in gure 1. 2.1.1. Wavelet Segmentation
Once the images are acquired, we compute the wavelet decomposition of each image using the standard two dimensional Harr wavelet basis [24]. The wavelet transform gives a multi-resolution view of an image with an average channel and three detail channels corresponding to horizontal (H), vertical (V), and diagonal (D) features. A
4
Ho�man, et al.
Fig. 1. Stereo camera pair with ground texture computation area highlighted.
representative wavelet decomposition from one of the stereo images is shown in gure 2. The \ground" texture is then computed in several known locations at the bottom of each image, between the rover wheels, as shown in gure 1, using a texture operator on the wavelet decompositions. We assume that the portion of the stereo images close to and in between the wheels of the rover are free of obstacles. The output of this operation is a texture signature, TS , in the space de ned by the H, V, and D channels of the wavelet decomposition [6] and, for each channel, is de ned as
TS =
l X i=0
Pn=2
j=,n=2
Pm=2
k=,m=2 jW (a+j;b+k)j
nm)
(
l
(1)
where the parameter l refers to the level to which the wavelet decomposition, W , has been computed. The summation in the numerator of equa-
tion (1) e�ectively gives the texture energy of a local neighborhood at a given level of resolution [15]. In our implementation, we use l = 2, as can be seen in gure 2. Thus, for each channel (H,V,D) in the wavelet decomposition, we sum the contributions to the texture signature from each level of the decomposition, by summing the absolute value of the thresholded wavelet coe�cients over a window of size n � m centered on (a; b) as indicated by equation (1). The values of n and m are dependent upon the current level, and the coordinates (a; b) are the image coordinates (x; y) in the wavelet coe�cient space at level l and channel (H; V; D). In our implementation, n = m = 8 at l = 0 and n = m = 4 at l = 1, and n = m = 2 at l = 2. Once we have an average H,D,V texture signature which we assume is the ground, we search the wavelet coe�cient space of the left image with a stepsize of 16 pixels in an area where we expect to nd obstacles (i.e. slightly ahead of the rover wheels), looking for points which do not match the average ground texture signature that has been previously computed. These \interesting" points are marked, as shown in gure 3. A range map computed using a stepsize of 16 will be referred to as a \Level 16" range map. Similarly, a range map computed with a stepsize of 8 will be referred to as a \Level 8" range map, and so on. This method of texture-based feature point selection is dependent on the initial \ground" signatures in that \interesting" points are ones whose signatures fall outside of the bandwidth of the safe points. As such, it is an adaptive algorithm that is robust with respect to local changes in the terrain and with respect to lighting conditions. The density of the distribution of feature points is directly tied to the search radius (stepsize) in the wavelet coe�cient space. If a dense map is needed for relatively rough terrain, a smaller stepsize is required. We are currently investigating adaptive stepsize generation based on the density of feature points returned by the algorihm (see section 2.1.4). 2.1.2. Correlation
Fig. 2. Wavelet transform showing horizontal, vertical and diagonal channels for a l = 2 decomposition with the l = 1 decomposition results shown in the upper left quadrant.
We then attempt to correlate the interesting points found in the left stereo image with their corresponding points in the right stereo image, using the fundamental matrix [28] to reduce this
Improved Rover State Estimation in Challenging Terrain search from a 2D problem to a 1D problem. Although we are using 120� eld of view lenses on the stereo camera pair, we have found that the error in using the fundamental matrix to compute a line of correspondance (rather than computing a curve of correspondance as would be expected for such highly distorted images) is on the order of approximately one pixel [31]. This experimental result is corroborated by the investigation performed in [30]. In correlating, we search along the epipolar line of left image point m1 given by Fm1, where F is the 3 � 3 fundamental matrix, and m1 is a vector in the form [ x y 1:0 ]T , where x and y are the column and row pixel locations, respec-
Fig. 3. Points of interest, Level 16.
5
tively, in the left stereo image. We assume that the cameras are reasonably aligned to the same horizontal axis, and thus limit our search vertically to �10 rows. Figure 4 details a left image point of interest and its corresponding epipolar line and search band. To account for possible errors in the epipolar geometry, we also search left and right at each point on the epipolar line by �8 columns. However, if we use cameras which can reasonably be modeled as orthographic, then this error is greatly reduced and, correspondingly, the number of columns to the right or left of the epiolar line we bother searching is also reduced. For our stereo cameras, the F matrix is 2
3
,8:907e , 06 1:159e , 03 ,7:025e , 02 4 ,1:155e , 03 2:457e , 04 1:966e , 01 5 : 6:521e , 02 ,2:082e , 01 9:532e , 01 A valid match between a left image point and its corresponding point in the right image is de ned by the greatest correlation score found during the search along the right epipolar line, larger than some threshold. To compute the correlation scores between points in the left and right image, we employ the standard sum minus average divided by standard deviation over an n � m box in each image. In this normalized de nition of correlation, the maximum correlation value is +1 (identical) and the minimum value is ,1 (totally uncorrelated). In our implementation the correlation threshold is chosen to be 0.80, following [28]. Likewise, n and m are chosen to be 7, which has become the defacto standard correlation window size [8]. The correlation score, S , between a left image point m1 and a right image point m2 is de ned as S (m1; m2) = Pn
i=,n
[I1 (u1 +i;v1 +j ),I1 (u1 ;v1 )]� j =,m [I2 (u2 +i;v2 +j ),I2 (u2 ;v2 )] p
Pm
(2n + 1)(2m + 1) �2 (I1 ) � �2 (I2 )
(2)
where Ik (u; v) is de ned by
Ik (u; v) =
Fig. 4. Correlation using the fundamental matrix.
n X m X
Ik (u + i; v + j ) [(2 i=,n j =,m n + 1)(2m + 1)]
(3)
and represents the average image intensity over a window of size (2n + 1) � (2m + 1) centered on (u; v) in image Ik , where k = 1; 2. The average
6
Ho�man, et al.
image intensity is de ned as The variable �(Ik ), in equation (2), is de ned by
�(Ik ) =
sP
n Pm 2 i=,n j =,m Ik (u; v ) , Ik (u; v )
(2n + 1)(2m + 1)
(4) and is the standard deviation in the image intensity over a window of size (2n + 1) � (2m + 1) centered on (u; v) in image Ik , where k = 1; 2. 2.1.3. Subpixel Correlation
Once we have an initial point match between the left and right images, we compute the subpixel location of the matching point in the right image, which is obtained by tting a parabola to the pixel-level correlation scores in both the row and column directions, as given by [26] �col = 2(S Scol+,S, Scol,+2S ) col, col+ col S , S row , row + �row = 2(S row, + Srow+ , 2Srow )
(5)
where Srow and Scol refer to the correlation score between a point in the left image m1 and a point in the right image m2 at position (col; row), where the maximum pixel level correlation score has been found. Scol, is the score between m1 and the point in the right image one column to the left of m2. Srow,, Scol+ and Srow+ are computed similarly. The right image row and column are then set equal to their integer value found during the pixel level correlation, plus the delta row and column found during the subpixel correlation. This procedure greatly improves the smoothness of the derived range map, with little extra computation. Using the set of matching image points computed to subpixel precision, we then triangulate to obtain 3D position information, using metrically calibrated camera models that take into account radial lens distortion [10]. 2.1.4. Adaptive Mesh Re nement
Using the computed 3D position information, we can further iteratively improve the density of our range map by returning to those interesting points
computed in the previous iteration that are found to be within a threshold \danger distance" from the rover. Searching the image over an area of Stepsize2 centered on each interesting point using a stepsize of Stepsize=2, we nd a new set of \interesting points" based on texture and compute their 3D position information, as can be seen in gure 5. In this fashion we perform what we have dubbed \adaptive mesh re nement", being somewhat akin to the process of adaptive mesh re nement in nite element analysis, in that we only bother computing the range map in areas where we care about what we are going to nd, i.e., areas that are both texturally interesting and \dangerous", or close to the rover. The density of the nal range map is user speci ed. The initial Level 16 range map is computed with a pixel stepsize of 16, which at 2 meters from the rover corresponds to approximately 26 cm between adjacent range map points for our 256 x 243 stereo image pairs. Level 8 is the next step up in density, with Levels 4, 2, and nally, 1, becoming increasingly more dense. Figure 6 shows how the range map has been computed adaptively such that the areas corresponding to the \ground" in texture are not computed. Likewise, it can be seen in the upper left corner that initially interesting points texturally are not further re ned, as they are too far away to be either accurate in distance or immediately dangerous to the rover. Figures 7 and 8 o�er some comparison between the density of the nal range maps generated, between Level 4 and Level 1. 2.1.5. Adaptive Range Map Generation Summary
We can thus summarize the procedure of adaptively generating the range map based on texture and \danger" distance as follows: 1. Obtain stereo image pair (256 x 243, 8 bit grayscale) 2. Compute wavelet transform (2D Harr basis) using the procedure given by [24]. 3. Set initial stepsize (Stepsizei = 16) for iteration i = 0 and set convergence variable MINI
Improved Rover State Estimation in Challenging Terrain
7
6. Compute subpixel matches (optional, recommended). 7. Compute 3D locations using triangulation. 8. Perform Adaptive Mesh Re nement (see below) on \dangerous" points. 9. i = i + 1. 10. If (i > MINI ) goto 5, else end.
Adaptive Mesh Re nement For each point (x,y) preserved as interesting from iteration i: 1. Search for points of interest using equation (1) between x � Stepsizei; y � Stepsizei using Stepsizei=2. 2. Add any points found to running list of new interesting points. 3. Stepsizei+1 = Stepsizei=2 Fig. 5. Points of interest, Level 8.
0.4 0.3 0.2 0.1 0
Z (m)
4. Search for points of interest using equation (1) between some max and min row and column locations known to probably contain points of interest. 5. Correlate points using equation (2) and the fundamental matrix.
Range Map, Level 4, 738 Points
0.5
−0.1 −0.2 −0.3 −0.4 −0.5 2 1 0
−0.8
−1
Y (m)
−0.6
−0.2
−0.4
0.2
0
0.4
0.6
0.8
1
X (m)
Fig. 7. Generated terrain map (Level 4). Range Map, Level 1, 11826 Points
0.5 0.4 0.3 0.2 0.1 Z (m)
0 −0.1 −0.2 −0.3 −0.4 −0.5 2 1 0
Y (m)
−1
−0.8
−0.6
−0.4
−0.2
0
0.2
0.4
0.6
0.8
X (m)
Fig. 6. Points of interest, Level 4.
Fig. 8. Generated terrain map (Level 1).
1
8
Ho�man, et al.
2.1.6. Timing and Performance
We have time tested the adaptive range map generation algorithm using the 171 image pairs gathered during our rst autonomous navigation exercise. At Level 4, the maximum time required to complete range map generation (AND path selection, as described in section 5.1) was 17 seconds (wall clock time) on a Sparc20, running as a user process, with an average time of approximately 9 seconds. At Level 8, the maximum time was approximately 5 seconds (wall clock time) on the same system, with an average time of approximately 2.5 seconds. The same code timed on a Pentium 166 Mhz processor took 7.5 seconds at Level 4, and 1.9 seconds at Level 8, as measured by the pro ler under Microsoft Visual C++. Computation time is linear in the number of points computed. The strength of the algorithm lies in the following features: � Range maps are computed selectively, only
�
� � �
for texturally interesting points, which automatically eliminates those areas where no correlation or an incorrect correlation would be found. Range maps are computed adaptively, only for points which are close enough to be accurately located and of possible near-term danger to the rover. De-warping and registering the image pairs is not required, as the epipolar geometry is used explicitly to nd matching points. Easily implementable. Low memory requirements.
2.2. Vision-Based State Estimation
At each iteration through our navigation algorithm, we compute a range map, which can be used to identify obstacles in the eld of view of the rover. We can also register these successive range maps such that they are all in a single frame of reference, e�ectively computing a global world map of the environment through which the rover is traversing. The process of registering these maps also has the advantage of providing an estimate of the rover's current state (position and orientation relative to its initial frame of reference).
2.2.1. Extraction of Inter-Frame Rotation and Translation
The algorithm we have implemented for the registration of two range maps is described in [27] and [29]. Here, a brief overview of the algorithm is presented. The interested reader is referred to [27] and [29] for additional details. This iterative registration process minimizes a performance criteria, F , given by m X
F (R; T) = Pm1 p pi d (Rxi + T; S0 ) (6) i ii =1
2
=1
which is related to the di�erence in distance between two clouds of 3D range points. In equation (6), R represents the rotation between the two range maps and T is the translation between the two range maps. Also in equation (6), the variable pi is 1 if the point xi is matched to a point on the surface S0 de ned by the second set of 3D range points, and 0 otherwise, relating to points which are visible only from one frame or the other. The variable m refers to the number of points in the rst terrain map. The function d(x; S0 ) is de ned by
d(x; S0 ) = j2fmin d(x; x0j ) 1;:::;ng
(7)
where d(x; x0 ) is the Euclidean distance between two points. We are then able to nd a set of closest point matches between the two frames where the distances between the two points in a matched pair is less than an adaptively computed maximum I . The search for closest distance tolerance Dmax points is accomplished through the use of a kdimensional binary search tree [27] for speed. In each iteration we adapt the maximum distance tolerance based on the mean � and standard deviation � of the distance between the points in each set of matched pairs which satis ed the maximum I ,1 from the previous iteradistance tolerance Dmax tion.
Improved Rover State Estimation in Challenging Terrain I based We then adaptively specify a new Dmax
I =� Dmax
Any points which do not satisfy the newly comI distance tolerance are rejected and puted Dmax the remaining matched pairs to compute the motion between the two frames are utilized. To compute the motion between the two frames, a dual quaternion methodology [25] [27] is used to solve optimally for the rotation and translation between the two frames simultaneously. Once the motion between the two frames has been determined, the computed motion is applied to the rst frame. We then iterate, nding the next set of closest point matches, updating the point matches using the statistically computed I , computing the motion distance tolerance Dmax between the two frames, and applying that motion to the rst set of points until the change in the computed motion reaches a lower threshold, or the algorithm reaches the maximum allowed number of iterations. One variable referenced above is D, which is computed to be the average distance between points and their closest neighbors in a terrain map, and is e�ectively related to the resolution of the terrain map data. The second variable, � , is computed from the point match set distance histogram. The reader is referred to [27] for a more thorough explanation of D and � , and their implications to the convergence of the algorithm. 2.2.2. Experimental Validation
We now present experimental validation of the algorithm described above, using terrain maps generated by the adaptive range map generation algorithm presented in Sections 2.1.1 - 2.1.6. Figure 9 shows a terrain map generated in one position by the rover. Figure 10 shows a terrain map generated by the rover after a nominal 10� counterclockwise rotation. Applying the range map reg-
Terrain Map 1
0.5 0.4 0.3 0.2
Z (m)
0.1 0 −0.1 −0.2 −0.3 −0.4 −0.5 2
1
0
Y (m)
−0.8
−1
−0.6
−0.2
−0.4
0.2
0
0.4
0.8
0.6
1
X (m)
Fig. 9. Range map in position 1; 12,634 points. Terrain Map 2
0.5 0.4 0.3 0.2 0.1 Z (m)
if � < D I = � + 3� Dmax else if � < 3D I = � + 2� Dmax on the following criterion: else if � < 6D I =�+� Dmax else
9
0 −0.1 −0.2 −0.3 −0.4 −0.5 2
1
Y (m)
0 −1
−0.8
−0.6
−0.4
−0.2
0
0.2
0.4
0.8
0.6
1
X (m)
Fig. 10. Range map in position 2; 12,464 points.
istration algorithm to the above two range maps, with the following initial rotation matrix R and translation vector T:
R 2 initial =
3
0:984807 ,0:173648 0:000000 4 0:173648 0:984807 0:000000 5 0:000000 0:000000 1:000000
T� initial =
�
0:000000 0:000000 0:000000 :
The nal computed rotation matrix R and translation vector T is computed to be:
10
Ho�man, et al.
Initial Registration
Initial Registration (Top) 2 1.5
0 Y (m)
Z (m)
0.5
−0.5 2
1 0.5
1 Y (m) 0 −1
0.5
0 −1
1
Final Registration
−0.5
0 0.5 X (m) Final Registration (Top)
1
−0.5
1
2 1.5
0 Y (m)
Z (m)
0.5
−0.5X (m)0
−0.5 2
1 0.5
1 Y (m) 0 −1
−0.5X (m)0
0.5
1
0 −1
0 X (m)
0.5
Fig. 11. Initial Registration vs. Final Registration; Light Points: Terrain Map 1, Dark Points: Terrain Map 2; Computed Rotation: 8.26 degrees counterclockwise.
R 2 nal =
3
0:989621 ,0:135732 ,0:047190 4 0:136498 0:990550 0:013388 5 0:044927 ,0:019690 0:998796
T� nal = � ,0:044082 ,0:026828 0:013626 : The vehicle rotation computed from R nal results in an 8:26� counterclockwise rotation which corresponds well with the observed motion of the rover, and with the commanded rotation of 10:0� counterclockwise. Figure 11 shows the initial registration between the two terrain maps, after the application of Rinitial and Tinitial to terrain map 1,
and the nal registration between the two terrain maps, after the application of R nal and T nal to terrain map 1. Recent experimental trials indicate that the initial rotation matrix and translation vector can be in error by as much as 50% before an incorrect minimum is reached. Also, the accuracy of the map registration technique is heavily dependent on the quality of the range map which in turn is a function of the stereo camera calibration. For the eld of view of the stereo camera pair, range maps are accurate to within 1-2 centimeters. A formal error analysis will be conducted to determine how this range uncertainty propagates into the nal rotation matrix and translation vector.
Improved Rover State Estimation in Challenging Terrain
3. State Estimation Due to various factors, the motion estimate that is produced by the map registration technique presented in the previous section may be in error. These factors include errors in the camera calibration from which the range maps are generated and the nite precision for which the performance criteria in equation (6) can be computed. Therefore, the vision estimate provides one means for establishing the position and orientation of the rover throughout its traverse. Likewise, the nominal wheel odometry can be utilized to estimate the rover's location. However, like the visionbased motion estimates, the dead-reckoned rover location estimates will be in error due to numerous factors including wheel slip in soft terrain, incorrectly-modeled rover kinematics, and inaccuracies due to traverse over obstacles by the rover's rocker-bogie suspension. This section describes the implementation of an extended Kalman lter methodology [2] to the problem of fusing together the rover state estimates as produced by the vision system and dead-reckoning. 3.1. Dead-Reckoned Estimates
The nominal estimates of the rover motion due to wheel odometry alone (e.g., dead-reckoning) can be described by the following state equations: 3 dX (�) 3 2 �(�) dx(�) = 6 dYd�(�) 7 = 4 RR cos sin �(�) 5 + w(�) 4 d� 5 d� R d�(�) Bu d� 2
= f (x(�); u) + w(�)
(8)
where x = [X Y �]T represents the in-plane position and orientation of the rover relative to some global reference frame, R is the nominal wheel radius, and B is half the distance between the wheel base. The independent variable, �, is de ned as (9) � = �r +2 �l where �r and �l are the absolute wheel rotations of the right and left wheels, respectively. The control variable, u is de ned as
d�r , d�l u = d� + d� r
l
(10)
11
where d�r and d�l are the di�erential wheel rotations of the right and left wheels, respectively. Finally, w(�) represents a Gaussian-distibuted, white noise process known as the process noise associated with the state equations. The process noise accounts for random errors such as wheelslippage. For a skid-steered rover, the state equations given in equation (8) are valid for all maneuvers except turn-in-place for which the independent variable, �, goes to zero and the state equations become singular. To handle this special case, � is re-de ned as � = �r ,2 �l (11) which results in the following state-equations for a turn-in-place maneuver 2
dX (�) 3 2 3 dx(�) = 6 dYd�(�) 7 = 4 00 5 + w(�) 4 d� 5 d� R d�(�) B d�
= f (x(�)) + w(�) (12) In either case, with the real-time sensing of the wheel rotations via rotary encoders, the above state equations can be numerically integrated (e.g., propagated) in real time thereby producing the dead-reckoned estimates of the rover motion. Likewise, the estimation error covariance matrix, P(�), associated with the Kalman lter is propagated in real-time by the following dP(�) = F(�)P(�) + P(�)F(�)T + Q (13)
d�
where F(�) is the Jacobian of the state equations and Q is the covariance matrix associated with the process noise. The process noise covariance matrix is assumed to be a diagonal matrix, i. e. Q = diag[QXX ; QY Y ; QZZ ], and, qualitatively, represents the con dence placed in the dead-reckoned estimates of the state. 3.2. Kalman Filter Update via Vision
As presented in section 2, the inter-frame rotation and translation of the rover can be determined (to within some level of accuracy) by resolving two successive vision-based range maps. As an output from this map registration technique, we will consider the in-plane rotation and translation
12
Ho�man, et al.
of the rover as a measurement of the rover state that will be fused together with the dead-reckoned state estimates via the Kalman lter approach. Therefore, the measurement of the rover state is 2
3
X (�i,1 ) + �X (�i ) z(�i ) = 4 Y (�i,1 ) + �Y (�i ) 5 + v(�i ) �(�i,1 ) + ��(�i ) = h(x(�i )) + v(�i ) (14) where �X , �Y , and �� are computed directly from R and T as detailed in section 2.2. Also, in equation (14), �i represents the value of � at which time a stereo pair is acquired and the map registration algorithm is completed and �i,1 is the value of � at which the previous vision-based update to the Kalman lter was computed. Also, v(�i ) represents a Gaussiandistibuted, white noise process known as the measurement noise. The update to the rover state is given by
x^(�i ) = x^(�i j�i, ) + K(�i)[z(�i ) , h(x^(�i j�i, )] (15) where the Kalman gain, K(�i ), is K(�i ) = P(�i j�i , 1)H � [HP(�i j�i , 1)H + R], (16) and where x^ refers to the Kalman ltered estimate of the rover state. In equation (16), H is the Ja1
1
T
T
1
cobian of the measurement equation given by (14) which for this case is the 3 x 3 identity matrix, I. Also, the measurement noise covariance matrix is denoted by R and is assumed to be a diagonal matrix, i. e. R = diag[RXX ; RY Y ; RZZ ], and, qualitatively, represents the con dence placed in the vision-based estimates of the state. The estimation error covariance matrix is updated as follows
P(�i ) = (I , K(�i )H)P(�i j�i, ) 1
(17)
where, in the above equation and in equation (16), P(�i j�i,1 ) represents the propagated estimation error covariance matrix produced by the integration of equation (13). Likewise, in equation (15), x^(�i j�i,1 ) represents the propagated state estimates produced by integrating forward the state
equations given either by equation (8) or by equation (12). The performance of this state estimator is presented in section 5. As with any Kalman lter application, the performance of the lter is greatly a�ected by the assumed process noise covariance matrix, Q, and the measurement noice covariance matrix, R. This is especially true for the rover case where, for example, the type of terrain (e.g., soft soil, hard-pack ground, etc.) can change the quality of the state estimates produced by dead-reckoning. Therefore, in the results presented in this paper, the state-estimate gains are de ned as s
s
s
RXX ; G = RY Y ; G = R�� GX = Q Y QY Y � Q�� XX so that the relative weight given to the deadreckoned estimates with respect to the visionbased estimate can be varied.
4. Experimental Platform 4.1. Hardware Description
The algorithms described in this paper were experimentally veri ed using NASA/JPL's Lightweight Survivable Rover (LSR) platform which utilizes a six wheeled, skid steered, rocker-bogie rover design. MicroArm-1, mounted to LSR, is a 4 degree-of-freedom robotic manipulator arm, 0.7 m at full extent, driven by 1-inch-pound torque capability piezoelectric ultrasonic motor actuators through 200:1 harmonic gear reductions. The powered multifunction end e�ector has available a close distance color imaging camera, a rotary abrading tool, and a clam-shell scoop/gripper. LSR is pictured in gure 12 and MicroArm-1 is pictured in gure 13 [23]. 4.2. Sensor Suite
LSR is out tted with a black and white stereo CCD pair with a 10 cm baseline, mounted directly beneath MicroArm-1. Each camera is equipped with a 120� eld-of-view lens. The stereo pair as mounted on LSR may be seen in gure 14.
Improved Rover State Estimation in Challenging Terrain
13
This camera pair was shown several calibration xtures in 34 di�erent positions to provide input data for a least-squares calibration technique which attempts to generate a camera model compensating for radial lens distortion [10]. Given the large eld-of-view of our cameras, radial lens distortion was quite signi cant. Other than the stereo camera pair (or deadreckoning), LSR has no method by which it may attempt to determine it's change in rotation or translation, as it is not current equipped with wheel encoders or gyro/accelerometers. However, nominal rover translation and rotation of LSR is known via the bang-bang control of the rover wheels under a no-wheel-slip assumption.
Graphics Indigo-2/VMEbus architecture. Computation is performed on the Sparc-20 using C and Java, with low level commands being sent to the LSR vehicle via the VMEbus using socket connections. Frame grabbing is accomplished using the Indigo-2 video hardware. A Java-based graphical user interface is provided to remotely initiate autonomous routines, as well as display images and data as collected by the rover to the remote scientist/operator. A block diagram of the current computing environment for the LSR vehicle is pictured in gure 15.
4.3. Computing Environment
We now present the results for the two navigation modes in which our rover currently may operate: reactive obstacle avoidance and potential
ow based path planning for navigation to a user
The computing environment for the LSR platform is currently a hybrid SUN Sparc-20/Silicon
5. Results
Fig. 12. Lightweight Survivable Rover (LSR).
Fig. 14. Stereo CCD cameras. VMEbus
Sparc SLC
Video MUX SGI Indigo 2
Sun Sparc 20
Fig. 13. MicroArm-I.
Fig. 15. System setup.
LSR
14
Ho�man, et al.
designated goal. All of the results presented in this section were carried out within the rover pit in JPL's Planetary Robotics Laboratory. The 9.1 meter x 4.5 meter rover pit is lled with a soft sand material and is populated with a variety of rock type and sizes. Throughout each run, the rover experiences signi cant wheel slip, including the occasional wheel hang-up on an obstacle. The rover also traverses over small rocks whose height is determined to be less than one rover wheel diameter. This environment is very indicative of the type of terrain that would be encountered by a rover during Martian surface operations. 5.1. Reactive Obstacle Avoidance 5.1.1. Path Selection Methodology
Once we have adaptively computed the range map, we make use of the terrain information to perform obstacle avoidance. To do so, the sum of the number of terrain points encountered when sweeping a box having an outline of the frontal area of the rover through 1.5 meters along the Y axis (directly ahead of the rover) is determined. We choose 1.5 meters as our lookahead distance because of the accuracy limitations imposed by low resolution images taken through 120� eld of view lenses. The path having both the least number of encountered points and also the least amount of required rotation is chosen. If the absolute value of the rotation requested is less than 5 degrees, then the rover proceeds forward for 5 seconds (approximately 20 cm). If the rotation is greater than +5 degrees, the rover rotates clockwise for 5 seconds, otherwise the rover rotates counterclockwise for the same period of time, which corresponds to a rotation of approximately 10 degrees. We nd that this technique gives us adequate obstacle avoidance performance. Using only current information and the above strategy may lead to oscillatory behavior during obstacle avoidance behaviors. The rover thus maintains a history of its past executed motions and initiates an oscillation-breaking maneuver (20 degree rotation) if it detects oscillatory behavior.
5.1.2. State Estimate During Reactive Obstacle Avoidance
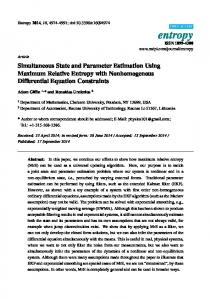
As can be seen in gure 16, the Kalman ltered vehicle state estimate is quite good after approximately a 6 meter traverse. Also in gure 16, the path labeled \vision" refers to the rover state produced by the vison-based estimate of rover inter-frame rotation and translation alone without knowledge of wheel odometry. The nal error between the ltered state and the ground truth is approximately 0.22 meters, with a maximum absolute error over the whole traverse of 0.64 meters, and a mean of 0.38 meters. The vehicle made 79 iterations through the reactive obstacle avoidance algorithm, making 20 right turns (10� nominal), 11 left turns (10� nominal), and 48 forward motions (20 cm nominal). Figure 17 details the position error of the Kalman ltered estimate with respect to the ground truth. The gains used in the Kalman lter were GX = 1:9, GY = 1:9, G� = 1:2. The ground truth in all trials is computed by selecting the cross shaped target on the top of the rover in the view provided by a 120� eld-ofview camera mounted on the ceiling of the rover workspace. This so called \sky camera" has been calibrated by presenting it with a calibration xture in multiple locations covering the oor of the workspace, and then tting a third degree polynomial to the calibration points, relating pixel location in the image with ground location. A separate curve was tted for the inverse relationship. The ground truth is accurate to within approximately 5 cm. 5.2. Potential Flow-Based Path Planning
As an alternative to simply performing reactive obstacle avoidance, we can also navigate to a user designated goal and avoid (either autonomously located or user designated) obstacles along the way. To do this, we have implemented a real-time path planner based on potential ow methodologies [7]. During each iteration of the navigation algorithm, this path-planner computes the path from the rover's current estimated position to the desired goal. Currently, we limit path planning to 2D and obstacles to be limited to cylinders or
Improved Rover State Estimation in Challenging Terrain ellipses at some speci ed angle, although arbitrarily shaped objects may be modeled using panelapproximations to the object's boundary.
15
If we consider the rover workspace as the complex plane, the potential for a plane ow at an angle � with the real axis is given by
w = ,Uze,i� :
5.2.1. Obstacle Modeling
Here we present a brief treatment of the potential
ow based path planning methodology described more fully in [7]. The interested reader is referred there for more details.
(18) The potential for a circular cylinder centered at z = X0 + iY0 with radius r in a plane ow with velocity U at an angle � with the real axis is given by 2 i� w = ,U (zei� + zr ,e z ) :
(19)
2 z = � + 4r� :
(20)
2 i� w = ,U (�e,i� + (a +4b�) e ) :
(21)
0
Finally, the ow around an ellipse with major axis a and minor axis b may be obtained using a conformal mapping as given by Applying the conformal mapping given by equation (20) to equation (19), we obtain the equation for a cylinder in the � plane, as may be seen in the following: If we then solve for � , we obtain the following equation: Fig. 16. State estimates during reactive obstacle avoidance run. 3
(22)
5.2.2. Potential Construction
Kalman Filtered Dead Reckoned 2.5
We de ne the external plane ow by the following:
2 Position Error (m)
p
whose solution describes the velocity eld around an ellipse.
Position Est. Error wrt. Ground Truth, K.F. vs. D.R.
� , (23) w = ,Uze,i�; � = tan,1 XYf ,, YX f where Xf and Yf represent the (X; Y ) goal position, and X and Y are the rover's current position.
1.5
1
0.5
0 0
� = 21 (z � z 2 , r2 ); r2 = a2 , b2
10
20
30 40 50 Time (Navigation Iterations)
60
70
80
Fig. 17. Position error (m); Kalman ltered vs. dead reckoned; reactive run.
An approximate harmonic potential solution to the continuous potential ow is achieved by the superposition of the closed form potentials for the plane ow and all of the individual obstacles added to the ow. More details on the construction of this harmonic potential are provided in [7].
16
Ho�man, et al.
5.2.3. Rover Motion
Once the harmonic potential is constructed, the u and v components of the ow can be found using the following: u = ,