IMPROVED SATELLITE TECHNIQUES FOR MONITORING .... anomalous SSTs available on the World Wide Web at NOAA/NESDIS's SST URL location:.
IMPROVED SATELLITE TECHNIQUES FOR MONITORING CORAL REEF BLEACHING A. E. Strong1, C. S. Barrientos2, C. Duda2, and J. Sapper2 1
U.S. Naval Academy & NOAA/NESDIS, Annapolis, MD 21402, USA 2 NOAA/NESDIS, Washington, DC 20233, USA
ABSTRACT Satellite-derived sea surface temperatures (SSTs) have been used to identify the areal extent of coral reef bleaching. A new, high_resolution satellite SST climatology has been developed to produce anomaly fields. These fields make it possible to quickly pinpoint regions of elevated surface temperatures throughout the Tropics. Whenever positive SST anomalies occur during the warmest months of the year, often a 1bC elevation above the monthly mean maximum accompanies bleaching. To take advantage of this finding, an experimental SST chart has been developed for the Tropics that compares presently observed SSTs to the warmest monthly mean SSTs at each location. These special anomalies, that show SSTs in excess of the highest monthly values, denote potential bleaching activity is most likely underway wherever a +1bC elevation above the monthly mean maximum exists. These new fields are shown for bleaching episodes of 1990, 1991, 1994, and 1995.
INTRODUCTION Sea surface temperatures (SSTs) are being routinely obtained from satellites operated by the U.S. National Oceanic and Atmospheric Administration (NOAA). These measurements are obtained both day and night from the Advanced Very High Resolution Radiometer (AVHRR) on all NOAA’s polar satellites and therefore permit coverage of all oceans (Strong 1992). Recently these SSTs have proven useful in delimiting suspected areas of coral reef bleaching using either a high temperature “threshold” technique (Montgomery and Strong, 1994) or using a bleaching index based on “degree heating weeks” (DHW) (Strong and Gleeson 1995; and Glynn 1996). Another technique that has been employed uses a “hot spot” observation based on satellite data (Goreau and Hayes 1994). “Hot spots,” defined by Goreau and Hayes, are simply areas of anomalously high temperature SSTs exceeding +1bC above the warmest monthly mean SST, based on climatology.
NEW SST CLIMATOLOGY FOR TROPICS Recent improvements in the SST climatology, based on using strictly satellite-derived, nighttime AVHRR SSTs (Strong and Winter 1996), are expected to make a more effective use of the “hot spot” technique for delimiting regions of suspected coral reef bleaching. These newly compiled monthly SST climatologies provide surface area resolutions at 36km, making it possible to provide a reasonable assessment closer to the coastline than from previous climatologies, whose resolutions were only 60-100km, and therefore monitoring waters closer to the reefs. While SSTs of waters immediately overlying the coral reefs will often be somewhat higher than those SSTs observed offshore by satellite, it has frequently been noted that what is observed in-situ is a constant offset by a few degrees...most commonly observed during light wind conditions (Goreau et al. 1993). Therefore, the ambient SSTs offshore must be elevated in temperature before the nearshore waters are able to rise. Maximum Monthly Mean Chart Using the newly created monthly SST climatologies based on satellite SSTs only, a single global chart was developed that represents a composite of the highest monthly mean SSTs at all grid-spot locations (36km) -- a
“monthly mean maximum” SST chart (SST-MMM). Using this new tool, it becomes more useful to quickly inspect weekly or monthly mean SSTs for “hot spot” regions. When these, “hot spots” coincide with coral reefs, coral reef bleaching should be expected, as SSTs would be indicated that are elevated in temperature by a least 1bC above what is normal throughout the entire year.
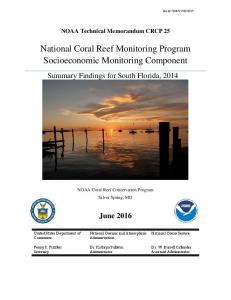
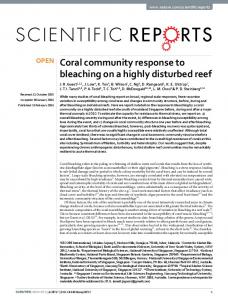
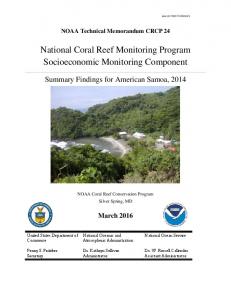
"HOT SPOTS" FROM "SST-MMM" AND ACTUAL MONTHLY MEANS Several examples using the “SST-MMM” technique are shown in the next few sections that coincide with recorded coral reef bleaching events during the last several years. 1990 Episodes in the Caribbean Monthly mean SSTs have been subtracted from the monthly mean maximum SSTs (SST-MMM) for the months of August, September, and October during 1990. Figure 1 shows these three months in a black and white depiction where white areas correspond to those surface waters that exceed the SST-MMM by at least + 1bC. Black regions within these white ocean areas show further SST elevation -- >1.5bC. From imagery generated using this technique, it can easily be observed how moderately elevated conditions above the monthly mean maximum (0bC to +0.9bC) began in the Gulf of Mexico waters overlying the Flower Gardens off the Texas coast during August 1990. These regions typically experienced light winds during this period in 1990. Hurricane “Diana” moved across the southern Gulf of Mexico during the first week of August. In the following month, these anomalously warm conditions expanded to the south into the north-central Caribbean -- centered on Jamaica. For the remainder of the 1990 period, only tropical storm “Marco” came close to this region (it moved north from Cuba during October). By the month of October, a large “hot spot” pool can be seen over the southern reaches of the Caribbean. For the Caribbean basin, October 1990 presented some of the largest positive temperature departures from normal observed since satellite SST data had been archived (1982). Coral reef bleaching was reported at many areas depicted by this “hot spot.” SST anomalies for this area, based on an older climatology, are shown for these same three months in 1990 in color by Brown and Ogden (1993). We are not aware of any bleaching that took place over this region during the Aug-Oct time period that occurred outside the areas occupied by this anomalously high temperature surface water. 1991 Episodes [TAHITI & THAILAND] Figure 2 shows the most extensive region throughout the Tropics exceeding the monthly mean maximum we have seen to date. Here anomalously high SSTs can be seen over a considerable portion of the tropical Indian and Pacific Oceans during the month of April 1991. Reports confirmed coral reef bleaching throughout the Indian Ocean at places such as Phuket, Thailand; also in the Pacific in the French Polynesian Islands, especially Tahiti. 1994 Episodes [TAHITI & BERMUDA] Again in April 1994, considerable regions of elevated SSTs were observed over portions of the Tropical Eastern Pacific that coincided with bleaching. “Hot spots” for this month are shown in Figure 3. This event is covered in greater detail by another paper in these Proceedings (Goreau, Hayes, & Strong 1996; Goreau and Hayes 1995).
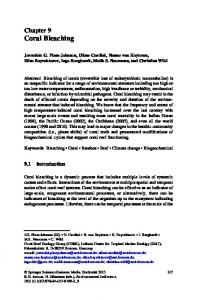
1995 Episodes in the Caribbean Once again during August, September, and October of 1995 a major bleaching event swept southward through the Gulf of Mexico into the Caribbean. This event was more severe than that of 1990 in that basin-wide average SSTs exceeded those of the event 5-years earlier, especially during September. Most notable was the “hot spot” development and persistence over the western portion of the Caribbean basin, rather than central portion as had been the case during 1990. "Hot spot" conditions are virtually continuous between Panama and Honduras during the entire period. Figure 4 presents average locations of each month’s “hot spot.” The coincidence of the extremely high SSTs with the Belizean coral reefs, marked the first time in memory that many of these reefs had experienced
bleaching, especially of this magnitude (Holden 1995). The Belizean “hot spot” was most strongly developed during the last week of September (Internet URL: http://www.noaa.gov/public_affairs/pr95/ nov95/noaa95_80.html). Tropical disturbances of the busy hurricane season of 1995, that had avoided this region during August and September, brought some relief in October, mixing warmer surface waters with cooler waters beneath the surface. Bleaching observed during 1995 occurred to some degree at virtually every site under the “hot spots” shown; even the timing of bleaching onset coincided with the weekly “hot spot” charts (not shown).
NOAA'S NEW TROPICAL SST ANOMALY CHART NOAA’s National Environmental Satellite, Data, and Information Service (NESDIS) is developing a new SST anomaly chart that hopefully will prove useful in the Tropics for assessing potential bleaching conditions. This anomaly chart is based on subtracting the weekly satellite SST fields from the new SST climatology discussed above. A daily SST climatology interpolation is being developed to be used in making weekly presentations of anomalous SSTs available on the World Wide Web at NOAA/NESDIS’s SST URL location: http://psbsgi1.nesdis.noaa.gov:8080/PSB/EPS/SST/contour.html
RESULTS & CONCLUSIONS The new satellite high-resolution climatology makes it possible to delineate anomalous pools of warm surface waters throughout all the oceans in a timely fashion. With regard to the coral reef environment, it is especially useful to know when any of these anomalously high temperature conditions occur during the warmest season. Now that a new chart has been developed from the monthly climatology series that represents the monthly mean maximum (SST-MMM) values at all ocean locations, a quick comparison is possible for assessing coral reef bleaching potential. Based on the limited success shown here, using this “hot spot” technique as a tool to correlate recent known bleaching events appears promising. Further research is planned to explore the use of such a tool with average weekly satellite SST data. A simple cumulative “hot spot” index will be examined to evaluate seasonal accumulations of bleaching stress potential at all reef sites. From bleaching events over the past few years, as illustrated in this paper, these positive SST-MMM differences appear to be quite effective as a bleaching alert product.
ACKNOWLEDGMENTS The authors wish to thank R. Hayes, T. Goreau, B. Salvat and M. Eakin for their assistance, reviews, and encouragement. The USNA/NOAA Cooperative Project in Oceanic Remote Sensing Laboratory's Alpha/VAX Computer was used to produce all the Figures used in this paper and to develop both the new satellite climatology and the SST-MMM. This facility is supported by the United States Naval Academy, NOAA/NESDIS, and the University of Miami's Rosenstiel School of Marine and Atmospheric Sciences and encouragement from those institutions is gratefully acknowledged.
REFERENCES Brown BE, Ogden JC (1993) Coral bleaching. Sci Amer. 268: 64-70 Gleeson MW, Strong AE (1995) Applying MCSST to coral reef bleaching. Adv. Space Res. 16(10): 151-154 Glynn P (1996) Coral Reef Bleaching: Facts, Hypotheses and Implications. Submitted to Global Change Biology Goreau TJ, Hayes RL, Clark JW, Basta DJ, Robertson CN (1993) Elevated sea surface temperatures correlate with
Caribbean coral reef bleaching. In: Geyer RA (Ed) “A Global Warming Forum: Scientific, Economic, and Legal Overview,” pp. 225-255, CRC Press, Boca Raton Goreau TJ, Hayes RL (1995) Coral reef bleaching in the south central Pacific during 1994. Report to Domestic Coral Reef Initiative, US Dept of State, 202pp, 54 illustrations Goreau TJ, Hayes RL, Strong AE (1996) Tracking South Pacific coral reef bleaching by satellite and field observations. Proc 8th International Coral Reef Symposium, Panama City, Panama [this issue] Goreau TJ, Hayes RL (1994) Coral bleaching and "ocean hot spots." AMBIO 23:176-180 Holden C [Ed] (1995) Reef bleaching spreads in Caribbean. In "Random Samples," Science 270:919 Montgomery RS, Strong AE (1994) Coral bleaching threatens oceans, life. EOS 75(13): 145-147 Strong AE (1992) Sea surface temperature signals from space. In Encyclopedia of Earth System Science, Ed. WA Nierenberg, Vol. 4, Academic Press, San Diego, CA, pp. 69-80 Strong AE, Winter TS (1996): High resolution monthly SST climatology. Submitted for publication
Fig. 1: Monthly mean maximum SST [SST-MMM] differences from actual monthly mean SST for August 1990(a), September 1990(b), and October 1990(c). Grey scale coding is: dark grey = negative differences; light-grey = 0bC to +1bC difference; white = +1bC to +1.5bC; black [water] > +1.5bC difference. Fig. 2: Same as Fig. 1 for April 1991. Note extensive “hot spots” [exceeds SST-MMM by A +1.0bC] over tropical Indian and Pacific Oceans. Fig. 3: Same as Fig. 1 for April 1994. Note “hot spots” over much of tropical Pacific Ocean. Fig. 4: Same as Fig. 1 for 1994: August (a); September (b); and October(c). Compare with migration of “hot spots during 1990 episode in Fig. 1.