Sep 29, 2006 - node A claims to be at a faked position Avr. Based on a greedy forwarding strategy, nodes always select the node nearest to the destination as ...
Improved Security in Geographic Ad hoc Routing through Autonomous Position Verification ¨ Tim Leinmuller and Christian Maihofer ¨
Elmar Schoch and Frank Kargl
DaimlerChrysler AG, Research Vehicle IT and Services P.O. Box 2360, 89013 Ulm, Germany
Ulm University, Department of Media Informatics 89069 Ulm, Germany
Tim.Leinmueller Christian.Maihoefer @DaimlerChrysler.com ABSTRACT Inter-vehicle communication is regarded as one of the major applications of mobile ad hoc networks (MANETs). Compared to other MANETs, these so called vehicular ad hoc networks (VANETs) have special requirements in terms of node mobility and position-dependent applications, which are well met by geographic routing protocols. Functional research on geographic routing has already reached a considerable level, whereas security aspects have been vastly neglected so far. Since position dissemination is crucial for geographic routing, forged position information has severe impact regarding both performance and security. In order to lessen this problem, we propose a detection mechanism that is capable of recognizing nodes cheating about their position in beacons (periodic position dissemination in most single-path geographic routing protocols, e.g. GPSR). Unlike other proposals described in the literature, our detection does not rely on additional hardware or special nodes, which contradicts the ad hoc approach. Instead, this mechanism uses a number of different independent sensors to quickly give an estimation of the trustworthiness of other nodes’ position claims without using dedicated infrastructure or specialized hardware. The simulative evaluation proves that our position verification system successfully discloses nodes disseminating false positions and thereby widely prevents attacks using position cheating. Categories and Subject Descriptors: C.2.0 [ComputerCommunication Networks]: General General Terms: Security, Reliability, Performance. Keywords: Vehicular ad hoc networks (VANETs), Security, Geographic Routing, Position Verification.
1.
INTRODUCTION
In the recent years, the technology of dynamic multihop ad hoc networks, usually referred to as MANETs, has
Permission to make digital or hard copies of all or part of this work for personal or classroom use is granted without fee provided that copies are not made or distributed for profit or commercial advantage and that copies bear this notice and the full citation on the first page. To copy otherwise, to republish, to post on servers or to redistribute to lists, requires prior specific permission and/or a fee. VANET’06, September 29, 2006, Los Angeles, California, USA Copyright 2006 ACM 1-59593-540-1/06/0009 ...$5.00.
Elmar.Schoch Frank.Kargl @uni-ulm.de gained a lot of interest in the research community. A number of potential application domains has emerged, each with its own individual set of properties and requirements. Wireless Sensor Networks try to network a large number of small sensor nodes, mesh networks supply rural areas with connectivity and Vehicular Ad hoc Networks (VANETs) provide cars with the capability to communicate with each other even over longer distances. For sure, inter-vehicle communication is one of the most promising future application domains. Using car-to-car communication, both passenger safety and driving comfort can be improved significantly. For example a car detecting an icy road could inform follow up vehicles and thereby prevent accidents. Another improvement in case of an accident would be that the communication network could support emergency response units to reach the location as fast as possible. In the area of business and entertainment applications, vehicles could exchange traffic flow information or allow chatting with passengers in other cars. Concerning the design of communication protocols to support such applications, two data traffic categories can be identified: • Widespread distribution of information, e.g. to notify other vehicles about an accident • Dedicated transport of data between two specific vehicles, e.g. for traffic flow requests or vehicle-to-vehicle connections. Beyond communication patterns, the envisioned applications and the vehicular ad hoc network topology have specific requirements and characteristics. Obviously, some applications require position awareness from nodes, in order to be able to indicate an incident’s location as well as to be able to decide whether or not a node should react on a received message. For instance, if a vehicle has already passed the site of an incident, the information is no longer crucial for it. Another challenge derives from the mobility of vehicles representing the network nodes. Whereas in traditional MANETs we assume rather slow node velocity (e.g. a pedestrian), speed of vehicles may exceed even 200 km/h, resulting in a highly dynamic network topology. Several research initiatives (e.g. projects like Fleetnet [5] or CarTALK [3]), both in Europe and the U.S., have already produced results in the investigation of vehicular ad hoc networks. For instance, geographic routing has been selected as routing scheme due to its compliance with application
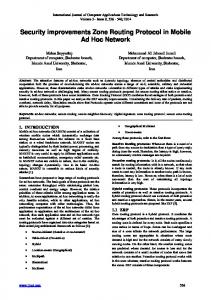
F G Avl
A
1.
J
H I
1.
K Avr
infrastructurebased
2. no special hardware
Position 1. verification approaches 2.
Figure 1: Vehicle A pretends to be at positions Avl and Avr managing to grab all data traffic along the road
dedicated measuring hardware required
1.
autonomous verification
2.
cooperative verification
infrastructureless
Figure 2: Position verification approaches design space needs and its good performance under extremely dynamic network conditions [17]. Ongoing work is now taking the next steps. One step is the effort to define common standards among car manufacturers, namely in the Car2Car Communication Consortium (C2CCC) [2] and the Vehicle Safety Communication Consortium (VSCC) [25]. Another important step is the research on security and privacy issues of VANETs, because consumers will definitely not accept vulnerable systems in their cars nor the ability to trace their itinerary. In this paper we address the security of geographic routing. Geographic routing approaches are mostly based on the same principles. Every node determines its current position by means of a positioning system such as GPS. The position is periodically broadcasted in beacon packets so that every node within the wireless transmission range is able to build up a table of neighboring nodes including their positions. Then, if a node has to forward a packet it selects the next hop out of this neighbor table, according to a predefined rule, e.g. it selects the node closest to the destination. Obviously, when a node disseminates wrong position data the routing process is influenced. Wrong position information may result from malfunction in the positioning hardware or may be falsified intentionally by attackers to reroute data. In [14] and [13], we have analyzed possible attacks and effects on routing that arise from wrong position claims. While malfunctioning nodes may degrade the performance of a system to some extent, rerouting of data through malicious nodes violates basic security goals such as confidentiality, authenticity, integrity, or accountability. A typical example scenario is shown in Figure 1, where node A claims to be at a faked position Avr . Based on a greedy forwarding strategy, nodes always select the node nearest to the destination as the next forwarding node. Assuming that F wants to send a packet to node K, it will first send the packet to its direct neighbor G. G will then forward the packet to the node nearest to the destination from which it received beacons. This seems to be Avr , so the packet ends up at node A, which can now forward, modify or discard it at will. Without node A faking its position, node H would have been selected. So A is able to intercept all upcoming traffic along the road. When A fakes an additional position Avr , thus creating a virtual clone of itself, the same argument holds for the opposite direction, so A is even able to capture all traffic in both directions. Consequently, to prevent such attacks the goal is to identify the position faking nodes and refrain from using these nodes as forwarders. Figure 2 depicts the basic design space for position verification in VANETs. Infrastructure
based position verification (branch 1.1 of the design space tree) is covered by recent work which will be discussed in section 2. In contrast to these methods, we propose and evaluate a different approach (branch 1.2), where no infrastructure is required. In this paper we focus on infrastructure-less autonomous position verification (subtree 1.2.1), where each node judges the position claims independently of others. The approach relies entirely on position information that is transmitted in regular beacon messages, assuming that every node is able to determine its own position by using a positioning system, such as GPS or GALILEO. Cooperative approaches (subtree 1.2.2) will be considered in future work. The remainder of the paper is organized as follows. After discussing related work in the next section, we describe the design of our verification system and the developed verification methods in section 3. In section 4 we present results of the simulative evaluation of these methods in order to confirm their applicability, especially under consideration of the requirements in VANET environments. Finally, we summarize the achievements of our work and conclude in section 5.
2. 2.1
RELATED WORK Geographic Routing Schemes
Routing scheme proposals for mobile ad hoc networks using the individual node position can be categorized into three main classes [17]. One of them, namely restricted, directional flooding, comprises approaches that forward packets on multiple, previously undetermined paths that exist in a defined forwarding area. For example, Location Aided Routing (LAR) [12] floods packets in a rectangular area spanned by the sender and destination position at the diagonally opposite corners. A second category of geographic routing protocols uses hierarchical approaches to forward packets. Terminodes [1] and Grid routing [4] are representatives of that category. Most geographic routing approaches belong to the third category, greedy routing. In contrast to restricted flooding, a packet is forwarded only on a single path. At each node, the next hop is selected among all neighbors closer to the packet’s destination position than the current node’s position. This implies that a node has to know all its neighbors and their respective position, which is achieved by all nodes sending periodic broadcasts of their own position. By this so called beaconing every node can build up a neighbor table and base forwarding decisions on it. In
case multiple neighbors satisfy the forwarding criterion of being closer to the packet’s final destination, several selection strategies have been proposed. The greedy-only method selects the neighbor with the smallest Euclidean distance to the destination. In contrast, Most Forward progress within Radius (MFR) [22] projects the positions of suitable neighbors onto a straight line stretched across the current node’s position and the destination’s position. Then, the neighbor with the most ”progress” on that line is chosen. Other greedy methods select the next hop randomly or by the minimal distance to the current node (Nearest with Forward Progress, NFP [7]) in order to save sending power. Obviously, all greedy methods are stuck if there is no neighbor closer to the destination’s position. The perimeter routing in GPSR [6, 11] is one proposal as recovery strategy in such situations, caching the packet until a suitable neighbor appears is another [15]. Since VANETs usually show high node mobility, CGGC explicitly exploits this network dynamics in its protocol design.
2.2
Position Verification Approaches
As already mentioned, greedy routing and most applications in VANETs depend on reliable neighbor positions. Without verification of these positions, nodes may claim falsified or altered positions and thereby could run several attacks, like node isolation or packet interception [14]. Some approaches to verify node positions take up the basics of positioning systems. They use angle or distance measurement techniques like radio signal strength or time of flight, partly in combination with challenge-response procedures to approve position claims secure and unambiguously. For instance, the verification system described in [9, 23] contains base stations building a trustworthy network. In the approach called Verifiable Multilateration, four of these base stations are involved in every position verification procedure. One after another, each of these stations measures the time between sending a challenge to the corresponding node and the arrival of the answer. Therefore a node might enlarge its actual distance to a base station by delaying the answer, but it has no possibility to reduce it (i.e. the node cannot send the answer to the challenge in advance), because the node does not know the challenge before actually having received it. In case a node delays the answer and thus enlarges the distance to one of the base stations, this is discovered by a misleading multilateration when looking at all four distance measurements. The approach can be improved by using synchronized base stations. Then only one challenge message is necessary; the distance can be measured at every involved base station simultaneously. The gain in verification speed is payed with the disadvantage that a node with sectoral antenna can send out the answers to each base station with temporal delay and so is able to trick the verification. Other approaches confine themselves to verify that a node resides within a defined region, e.g. for location based access control. The solution in [21] places so called verifiers at special locations and defines an acceptable distance for each verifier. Thus a region R can be formed by overlapping circles. The verification procedure then works as follows. First, the corresponding node n sends out a beacon containing its position, then a verifier v replies with a challenge via radio. After receiving the challenge, n has to answer via ultrasound. If the answer arrives at v
in the previously calculated time according to the defined acceptable distance for v, n is approved to be within the region R. In [24], a similar approach to [21] is proposed, with the difference that it achieves position verification simply based on logic reception of beacons. First, the verifier nodes are divided into acceptors and rejectors. The acceptor nodes are distributed over the region R which is to be controlled. Then, a closed annulus with rejector nodes is formed around the acceptors. In addition to the distinct placement, verifier nodes are synchronized among each other. Nodes send the same beacon multiple times with increasing transmission power. If a transmission of this beacon is first received by an acceptor, the position claim is accepted, if its first received by an rejector, the position claim is rejected. Summarizing related work, there are mainly two groups of position verification approaches. The first group of solutions tries to measure physical parameters like Time of Arrival (TOA), Angle of Arrival (AOA), Time Difference of Arrival or the received signal strength [9, 23, 21]. Other approaches do not rely on physical measurements but rather try to verify the position claims of other nodes based on the logical structure of the network [24]. Both groups fit into branch 1.1 in Figure 2 since they are based on an infrastructure network and both can deliver secure and reliable position verification. Despite of this advantage, usage of infrastructure and dedicated hardware are weaknesses when applied in vehicular ad hoc network environments. Additional hardware might not always be available or may be rejected by car manufacturers due to cost reasons. Using a fixed infrastructure, at least in Europe, seems almost impossible due to tremendous deployment cost and additional regular operating costs. The only measurement that does not rely on additional hardware is the signal strength, but this has proven to be very unreliable in changing environments like VANETs. The same holds for the logical-structure approach [24], which also conflicts with fast changing environments, as it needs multiple successive measurements to produce meaningful results.
3.
POSITION VERIFICATION SYSTEM
Based on the assessment of related work in the previous section and the problems found, our system approaches the position verification problem from a different side. In order to refrain from the use of specific hardware or infrastructure, we advocate the idea of a ”Position Cheating Detection System” that is similar to intrusion detection systems like the one developed to detect e.g. selfish nodes in MANETs [10]. In these systems every node uses multiple algorithms (so called sensors) to detect malicious or selfish behavior of other nodes in the network. Based on the sensors’ observations, each node calculates a trust value that determines whether other nodes are trustworthy, or should for instance be excluded from further routing decisions. Such systems can predict the trustworthiness of other nodes even when single sensors do not work fully reliable. We transfer this idea into the domain of position verification. Therefore it is necessary to find suitable sensors that can be used to detect forged position information. For the remainder of the paper, we discuss and evaluate several suggestions for such sensors. There are two classes of position verification sensors. Sensors of the first class 3 work autonomously on each node and contribute their results to
Acceptance Range 1. Threshold (ART) 1. Autonomous position 1.2.1 verification sensors
Threshold-based sensors
Map-based 2. sensor
N1
Mobility Grade 2. Threshold (MGT)
N2
3. Maximum Density Threshold (MDT)
N5 N6
Overhearing 3. sensor
Ar
Figure 3: Autonomous position verification sensors overview // node A receives beacon b from node B // b.Source. . .address of node B // A.T. . .neighborship table of node A // ∆Max. . .maximum acceptance range threshold (01) A.recv(b) (02) if distance(b.Position, A.Position) ≤ ∆Max; (03) if b.Source ∈ / A.T (04) add(b.Source, b.Position) to A.T; (05) else A.T[i].Position := b.Position; (06) else (07) reduce trust level of B; (08) ignore b;
Figure 4: Acceptance Range Threshold (ART) pseudo code
the node’s overall local trust rating of neighbors. The second class includes all sensors that work in cooperation with other nodes, thus requiring additional communication between the nodes. In this paper, we will concentrate on autonomous sensors. All sensors suggested have the benefit that they rely only on information that the routing layer delivers anyway, so there is no additional message exchange and no extra hardware or infrastructure involved. We further assume that the nodes in the VANET use a location-based routing protocol like the one described in [15], which implies that a node has means to determine its current position, e.g. by using a (D)GPS receiver. In the routing protocol, location information is distributed between nodes by means of position beacons. In order to prevent abuse of the verification system, beacons need to be signed and timestamped by their sender. When a node receives a position beacon from another node claiming to be at a certain position, the sensors get active to verify if this claim is likely to be correct or not. Next we describe how autonomous sensors can reach this goal (see Figure 3 for an overview). An evaluation of the effectiveness is examined in section 4.
3.1 3.1.1
Autonomous Position Verification Acceptance Range Threshold
The Acceptance Range Threshold (ART) sensor is based on the observation that all radio networks used in VANETs have a maximum communication range where packets sent by a node B can still be received by a node A. Based on the radio properties, we define a maximum acceptance range
N3
Av N7
Figure 5: example
N4
Acceptance Range Threshold (ART)
threshold ∆M ax. Figure 4 describes the behavior of node A when receiving the beacon from node B. By discarding position beacons from nodes claiming to be at a distance larger than ∆M ax away from a receiving nodes’ current position, we avoid many types of attacks. Using this simple method, a malicious node for instance, cannot easily collect all outgoing traffic of another node by pretending to be at a better forwarding position – i.e. nearer to remote targets – than potential other nodes nearby. The consequences are shown in Figure 5. Position beacons from node A, being at the real position Ar but claiming to be at position Av will be rejected by nodes N1 through N3 as the ART is exceeded. On the other hand, nodes N6 and N7 do not receive the beacons from A anyway. This mechanism is also capable of preventing routing loops caused by position information in many greedy routing strategies [14].
3.1.2
Mobility Grade Threshold
The Mobility Grade Threshold (MGT) sensor is based on the assumption that nodes can move only at a welldefined maximum speed. This may be the general speedlimit on streets (plus a bonus for speeding cars) or the maximum walking speed of persons. When receiving a beacon, nodes also record a timestamp. Then, upon the reception of subsequent beacons from the same node, it is checked whether the average speed of the node between the two positions in the two beacons exceeds the MGT. If so, the beacon is discarded. Figure 6 describes the actions taken by node A when receiving a beacon from node B. A potential motivation for the MGT sensor is demonstrated in Figure 7. We assume that a rational attacker A (again located at position Ar ) promiscuously listens the communication channel for packets he would like to intercept. If node M forwards packet P1 to node N , A receives it as well, but cannot prevent further forwarding, because A is not in the route. However, A may instantly send a beacon with a virtual position Av1 that N will likely select as next forwarder for P1 . The only constraint is to be faster than the forwarding process at N . A similar kind of attack has already been introduced for topology-based routing protocols in [8]. Using this method, A is able to
// node A receives beacon b from node B // b.Source. . .address of node B // A.T. . .neighbor-table of A // n. . .entry in neighbor-table // Vmax . . .maximum speed // t. . .current time // n.Time. . .time of last beacon from n (01) A.recv(b) (02) if b.Source ∈ / A.T (03) add (b.Source, b.Position) to A.T; (04) return; (05) n := find b.Source in A.T; (06) speed := distance(b.Pos, n.Pos)/(t−n.Time); (07) if speed ≤ Vmax (08) n.Position := b.Position; (09) n.Time := t; (10) else (11) reduce trust level of B; (12) ignore b;
Figure 6: Mobility Grade Threshold (MGT) pseudo code
N
M
Av1
Ar
P1 P2
L K Mobility
Grade
Threshold
(MGT)
intercept all nearby packets assuming it is capable of taking in new positions as often as required. For example, shortly after setting its position to Av1 , A may set it to Av2 in order to intercept another packet P2 . This uncontrolled position hopping is detected by the MGT sensor. However, whereas the sensor detects rapid changes in a node’s alleged position, it cannot detect gradual changes of a node’s position claim towards a wrong direction.
3.1.3
Maximum Density Threshold
Similar to the last sensor, this sensor is based on the assumption that only a restricted number of physical entities (e.g. cars) can reside in a certain area. For example, cars have certain physical dimensions preventing too many of them to be on the same road segment. This sensor defines a Maximum Density Threshold (MDT) which, when exceeded, rejects further position beacons for this area. It aims at preventing so called Sybil attacks, where a node creates a large number of virtual nodes in order to collect all traffic in a certain area [19]. Additionally, vehicle speed could be taken into consideration because higher vehicle speeds usually result in lower node densities.
D
N
Av L Ar
P1 P2
Figure 8: Position claim overhearing example
3.1.4
Map-based Verification
Here, we assume that cars include navigation systems where street maps are accessible by the position verification system. Upon receiving a beacon, the system can check whether a neighboring car pretends to be at a location that is not likely, e.g. off the streets, in houses, etc. Map-based verification reduces the set of valid positions and serves for instance to detect faulty operation of an others vehicles’ positioning system, that is continuously broadcasting offroad positions in its beacon messages.
3.1.5
Av2
Figure 7: example
M
Position Claim Overhearing
Overhearing is a concept introduced by Marti et al. [16] where nodes use the so-called promiscuous mode to capture packets that are sent by nodes in reception range but are addressed to other nodes. Whereas Marti et al. use this concept to detect packet dropping and to control forwarding behavior of nodes, we use it to verify position information. As shown in Figure 8, there are two cases where overhearing is useful (again, Ar represents the real position of node A, whereas Av denotes the position, A pretends to be in its beacon messages). In the first case, node M forwards packet P1 to node A. Later M overhears P1 being sent to node L which is at an inferior position (with regard to the routing metric) compared to A. This indicates that A may have forged its position Av . In the second case, node M overhears the transmission of packet P2 from N to A, although given the last position of A known to M and the Mobility Grade Threshold, A should not be in reach of N . Again this indicates that A may have forged its position Av . Whereas the earlier sensors are quite reliable, the overhearing sensor gives only indications that position information may have been forged. There are valid cases where the overhearing sensor will wrongly detect nodes to spoof positions. So the overhearing sensor might only be used in combination with other sensors, as the ones described previously.
3.2
Combination of Verification Results
The accumulation of observations over time and different sensors is required to provide a decision, whether a node should be regarded as being malicious or not. Also having in mind that observations from some sensors are more reliable than observations from others, we use a trust model that provides the capabilities to consider observations from differently weighted sensors during a certain period of time. The mathematical model derives from the one presented in [18].
We denote the n-th observation of sensor s by σns , then, the trust model can be described as follows: • All nodes store trust values r ∈ [−1; 1] for all direct neighbors. r = 0 is equivalent to neutral trust, r ∈ (0; 1] means a node is trustworthy and r ∈ [−1; 0) means no trust. • Every observation σns is stored with weight factor ws and timestamp tsn . • On the arrival of a new observation, the trust value for a neighboring node is recalculated according to the collected observations for this node. • All observations are stored for a maximum time T and discarded afterwards. The weight factor ws of an observation σns is chosen according to the reliability of the providing sensor, e.g. observations from a more reliable sensor like ART can be regarded as more valuable than observations from a less reliable one like MGT sensor. Besides, observations may also be weighted dynamically, for instance depending on traffic situation or the current scenario. The timestamp tsn of an observation σns is used to calculate the observation’s time factor wt(t, tsn ), �
wt(t, tsn )
=1−
t − tsn T
�x
(1)
where x denotes the exponential aging factor of the observations. x = 1 corresponds to a linear aging process, values x > 1 are equivalent to a more than linear aging process of the respective observation. Finally, the trust value rt of a neighbor node at a time t is calculated by multiplying the available observations by their weight factor and their time factor, then summarizing the results and at the end normalizing to [−1; 1], X
rt = i∈S
wi
X j∈Ni
wt(t, tij )
1 i σj −1
(2)
where S denotes the number of sensors s, and Ns the number of collected observations by sensor s. Detected violations are weighted higher than normal behavior, thus once a falsified position information is detected, it takes several correct beacon messages to compensate the trust level. Nodes with a negative rating are not used for forwarding.
3.3
Weaknesses and Attacks
Analyzing our position verification system, we found that there are still some weaknesses that might be improved in further versions. Consequently, a smart attacker might find ways to fool the position verification. This section gives an overview over all of these aspects starting with weaknesses and improvements. One drawback of the current solution is that it uses only hard thresholds. While the applied thresholds were found in simulations to be suitable for most scenarios, there might be conditions where the thresholds are not strict enough. For instance, think of ART, which limits the maximum range of signals. If we choose the ART value for a general scenario, we need to set it to the maximum communication
range of the radio technology used in a free open space. For IEEE 802.11 WLAN, 300m should be a reasonable value. But if the same technology is used for example in a narrow city center where a lot of buildings would block the signals, the same 300m might never be reached in reality. Allowing spoofed positions 300m away from the correct position might then be enough for reaching the attackers goal, e.g. capturing traffic, as all the other nodes available for forwarding are much nearer. A solution for this problem is to choose adaptive thresholds, that are set according to the location conditions. If for example all neighbors are within 50m range, a node being away 150m might be more suspicious as in a setting where also other nodes are 100m to 150m away. This can be expressed by varying the sensor rating σns between the allowed range of +1 and −1. In the first case the rating might be set to −0.5 whereas in the second case a rating of +0.5 could be appropriate. The details on how to set the thresholds and ratings are subject of future research. Another area for improvements might be the forwarding decision. Currently nodes that have a negative rating are not used for forwarding. One might make a finer distinction where there are groups of nodes that have e.g. ”no trustworthiness”, ”limited trustworthiness” and ”full trustworthiness”. In the trust system, this might correspond to ratings ranging from [−1; − 13 ), [− 13 ; 13 ), and [ 13 ; 1]. Normally only fully trustworthy nodes are chosen in all forwarding decisions. If no such nodes are available, nodes with limited trustworthiness can be chosen as an alternative whereas not trustworthy nodes are never used. This could help improve the packet delivery ratio in networks with low node density. We assume that all details of the verification system are also known to a potential attacker that might try to misuse the system for attacks. So, a straightforward attack would be the dissemination of spoofed beacons to reduce the rating of other nodes. This could be prevented by signing position beacons, for instance by using public/private key pair based signatures or other schemes that are based on MACs or hashchains. Another attack could be the jamming or manipulation of the location detection of each node. If for instance GPS is jammed or manipulated, the cars cannot effectively determine their own position and can send no or only false beacons. This kind of DoS attacks is nevertheless no specific attack against the position verification system and is beyond the scope of this paper. If the ART is known, malicious nodes may decide to avoid the position verification system by staying just within the ART. As already explained, depending on the distribution of nodes and the reception conditions, this may allow malicious nodes to capture traffic. One solution that mitigates this attack is the use of adaptive thresholds as outlined above. One might also correlate the claimed position with the received signal strength indicator that most radio technologies provide. This way unreasonable position claims within the ART range may also be identified. As already mentioned earlier, a MGT sensor might be fooled by a node slowly changing its pretended position towards a destination without exceeding maximum mobility grade. There is no way to detect this kind of behavior with the MGT sensor. However, as we assume additional sensors like ART to be in place, the effects of this attack are limited.
Parameter Link-/MAC-Layer Transmission range (m) Number of sent messages Simulations per parameter set City scenario Number of nodes Length of square node field ⇒ node density (nodes/km2 ) Max. node velocity (m/s) Pause times (s) Mobility model Simulation time (s) Highway scenario Number of nodes Lanes per direction Road length (km) Simulation time (s)
Value IEEE 802.11 250 100 20 100 1000 – 4000m 6,25 – 100 50 0.0 Random Waypoint 40 ∼ 350 2 ∼ 12 120
4.1.2
Maliciously acting nodes are implemented according to the following model: • Whenever a malicious node is about to send a beacon message to announce its present position, it selects a random position with maximum distance of 500m to its actual position and applies this position to the beacon. • Whenever a malicious node gets a data packet, depending on the simulation setup, it either forwards the packet correctly according to the protocol rules or it drops the packet. In other words, falsifying the position is the method to intercept packets which then may be examined and forwarded for eavesdropping reasons or even be dropped to disconnect routes.
4.1.3 Table 1: Simulation parameters overview The MDT sensor might be attacked by creating faked nodes within a target area, thus exceeding the MDT limit. Normal nodes in the same area could get assigned bad ratings by surrounding nodes. A potential solution would be to require beacons to be authorized by a trusted third party (e.g. signed with a certificate). Under this assumption, a node can only fake one position per time. However, requiring beacons to be authenticated has large impact on node privacy and required infrastructure, which is out of scope for this paper. Furthermore, the last of the presented sensor mechanisms, overhearing, might also be the goal of attacks. As overhearing is in general very inaccurate, this should only be used as trigger for other sensors. This way the effects of attacking overhearing are limited. Another drawback of the presented solution is that each node has only a local view that might not be enough to reliably identify all position faking nodes. Cooperative schemes will be the logical next step. But these systems will also introduce additional overhead and more potentially exploitable weaknesses.
4.
SIMULATIVE ANALYSIS
4.1 Simulation Environment For the evaluation of the presented verification techniques, we implemented the acceptance range threshold (ART) and mobility grade threshold (MGT) sensors as well as the trust system in the ns-2 simulator (ns-2.27). Furthermore, we created a model for maliciously acting nodes.
4.1.1
Routing
As routing method we used a greedy based approach, which selects the neighbor closest to the destination as next hop for a packet. In case no suitable next hop is available, the recovery strategy is based on caching, i.e. packets are stored locally until either a suitable neighbor is reachable or until the node is forced to drop the packet due to packet queue overflow (see [15]).
Attacker Model
Verification System
The trust system is implemented according to the model presented in subsection 3.2. It is used in all nodes in order to assign certain trust levels to a node’s direct neighbors. The initial trust value for a previously unknown neighbor node is neutral (i.e. 0). Every received beacon message is evaluated by the verification sensors and depending on the results, the trust level of the corresponding neighbor is increased or decreased. During our simulations, we assigned the ART sensor a weight of 5 and the MGT sensor a weight of 3. In the forwarding process, only nodes with a neutral or positive trust level (i.e. [0; 1]) are considered, nodes with a negative level (i.e. [−1; 0)) are disregarded. Therefore position faking nodes should receive no more packets to forward.
4.1.4
Mobility and Traffic Scenario
The simulation scenario has to consider mainly two parameters, data traffic and node mobility. As data traffic, 100 messages are transmitted from a random source node to a random destination node. Those messages are created between simulation time t = 0s and t = 30s. Concerning node mobility in VANETs, we distinguish between urban areas and rural roads or highways. Whereas urban traffic is rather complex and undirected, the movements on roads outside of cities like on highways or on freeways can be considered nearly one-dimensional. In [20], the authors have found that urban traffic can be modeled with random waypoint movements, therefore we use this model for city environments. For non-urban roads, simulation traffic scenes stem from the DaimlerChrysler FARSI driver behavior simulator. This tool generates realistic vehicle movements on highways, in our case on a 12km part of highway consisting of two lanes per direction, with an average of six nodes per lane and kilometer. Further simulation parameters are listed in Table 1. The following subsections will discuss our simulation results and evaluate the detection capabilities of our decentralized position verification system.
4.2
Simulation Results
The effectiveness of the position verification system can be assessed both, with external indicators as well as with internal results of the trust system. External indicators would be for instance the average delivery ratio of the
100
25 Received packets by malicious nodes
Delivery success ratio (%)
90 80 70 60 50 40 30 20 10 1000
Normal forwarding 10% faking and dropping 10% faking and dropping, with checks 1500
2000 2500 3000 Network size (m x m)
3500
10% faking nodes 10% faking nodes, with checking
20
15
10
5
0 1000
4000
1500
2000 2500 3000 Network size (m x m)
3500
4000
Figure 9: a) Effects of position faking and the trust system on delivery ratio and b) average number of received packets at a malicious node 1
1
0.9
0.9
0.8
0.8 0.7
0.6
Detection rate
Detection rate
0.7 10% faking, with ART 10% faking, with MGT 10% faking, both ART and MGT
0.5 0.4
0.5 0.4
0.3
0.3
0.2
0.2
0.1
0.1
0 1000
1500
2000 2500 3000 Network size (m x m)
3500
4000
10% faking, with ART 10% faking, with MGT
0.6
0 100
150 200 250 300 350 400 450 Maximum distance between real and faked position (m)
500
Figure 10: a) Detection rate of the trust system, once depending on network Size (left) and b) once depending on different position faking intensities system, or the number of forwarded packets by malicious nodes. These values indirectly reflect the operation of the trust system. On the other hand, we are also able to monitor directly the trust levels that are assigned to malicious nodes by ordinary nodes throughout the simulation run. In this case, we obtain a direct evaluation of the trust system.
4.2.1
City Environment
Figure 9a shows the successfully delivered messages in dependence of the network size. Note that varying the network size while keeping the number of nodes constant is equivalent to varying the node density. We observe that the number of successful messages is decreased significantly when position faking nodes also drop received messages immediately. Note that by using message dropping at malicious nodes we are able to highlight the number of intercepted messages by these nodes. With the trust system applied, the position faking nodes are detected by normal nodes and therefore are no longer selected as forwarders for packets. This results in an increased rate of successfully delivered messages. However, the use of the trust system cannot reach the delivery ratio without malicious nodes since the effective node density is also decreased when malicious nodes are excluded from the forwarding process. This observation can also be seen in Figure 9b, where
we analyze the same simulations from another perspective. Here, the average number of messages that a malicious node has received is shown. We see that this number reduces nearly to zero when the verification system is applied, thus, we effectively exclude malicious nodes to the cost of lower network density. To clarify the observed effects on delivered messages and forwarded packets, we next look at the internal values of the verification system. Figures 10a and 10b show the effectiveness of the trust system sensors by measuring the rate of successful detections of position faking nodes. The detection rate is calculated as follows. At the end of a simulation run, all non-faking nodes are checked for their trust levels of position faking nodes, if they encountered any during their movements. If a normal node n has met a position faking node p and judged it as not trustworthy (i.e. trust level is < 0), this is considered as successful detection. In contrast, if a normal node evaluated a position faking node as trustworthy (trust level ≥ 0), this is counted as failed detection. Finally, the detection rate is calculated as the quotient of the number of successful detections over the sum of successful and failed detections. In Figure 10a we can see that the simple ART sensor yields superior detection rates, whereas the MGT sensor does not provide satisfying results when used alone. But
0.12
0.9 0.8
Detection rate with 10% faking False positives with 10% faking
0.7
0.08
0.6 Ratio
False Positives
0.1
1
10% faking nodes, with ART 10% faking nodes, with MGT 10% faking, with ART and MGT
0.06
0.5 0.4
0.04
0.3 0.2
0.02
0.1
0 1000
0
1500
2000 2500 3000 Network size (m x m)
3500
4000
10
15
20
25 30 35 Maximum node velocity (m/s)
40
45
50
Figure 11: a) False positives with different detection sensors, b) detection rate and false positives with different node velocity grades when combined, the trust system can make use of the advantages of both sensors. We continue the investigation of the results of the ART sensor, by varying the deviation of faked positions compared to the real positions of the faking nodes. In Figure 10b, the position faking nodes are restricted to choose their faked position up to a given maximum distance to the real position. As expected, it shows that smaller distances are harder to detect by the ART sensor. Another important value when evaluating a trust systems is the number of false positives. The rate of false positives is given by the number of nodes accidentally considered as position faking (false detection) over the sum of both, correct and false detections. Figure 11a shows that the false positives increase with larger network size, though staying on a rather low level. With respect to the special requirements on routing in VANETs, we also have to examine the effectiveness of our detection approach under varying node velocities. In Figure 11b, we observe a slight degradation of detection and an increased number of false positives of about 7% with the maximum velocity of 50m/s. But nevertheless the detection system is still working on an affordable level. While the performance decrease is foreseeable due to less stable node topology in higher velocity scenarios, the trust system could be adapted to consider node speeds and therefore avoid decreased detection capabilities.
4.2.2
Highway Scenario
As we have seen in the problem description in section 1, falsified positions can have even more severe effects on routing in quasi-linear highway scenarios (see also [13]). Because the vehicles’ directions are predictable, the direction of packets is also predetermined. This can be used by an attacker to intercept and drop almost all passing packets only by adequately giving a falsified position. The simulation results as shown in Figure 12a approve this statement. For instance, if 10% of all nodes falsify their position and consequently drop intercepted packets, the overall delivery success ratio degrades from about 80% down to less than 20%. With an activated verification system, the degradation for 10% of falsifying nodes stays marginal. To evaluate more extreme situations, we have increased the number of malicious nodes up to 50%. While the per-
formance of the verification system keeps detecting around 96% to 98% of malicious nodes, the delivery success ratio decreases notably with increasing number of malicious nodes. This can be explained by the false positive detections depicted in Figure 12b. The number of erroneously classified attackers increases significantly with higher attacker penetration. This leads to a lower density of ordinary nodes with the effect of decreasing delivery ratio. Additionally, we can see from Figure 12b that dropping messages by a malicious node has no influence on the detection mechanisms. As already mentioned in the previous section, we see the effectiveness of the verification system in the increased delivery success ratio. With Figure 12b showing the detection rate as an internal characteristic of the verification system, we can attest that the linear node distribution does not have any impacts on the system. Detection rates reside clearly at over 90% both in city and highway scenarios.
5.
CONCLUSIONS
We have developed mechanisms to detect and mitigate the influence of falsified position information in geographic routing protocols. In contrast to other position verification approaches, we do not rely on special hardware to measure signal strengths or time-of-flight, nor do we rely on a preinstalled infrastructure networks. In order to improve reliability of position information, our goal is to quickly estimate the trustworthiness of the position claims of neighbored nodes. The selected mechanisms will not prevent malicious nodes entirely from using falsified position information, however, they will drastically limit the choice of fake positions that will not be detected by our system (i.e. fake positions must meet all criteria as opposed by the deployed sensors, for instance they must reside within a node’s wireless transmission range). Consequently the possibilities for attackers using faked positions are significantly reduced. We discussed advantages and drawbacks, respectively vulnerabilities of our detection techniques. We have presented simulation results for the developed autonomous sensors, which look very promising. Further work will enhance the simulation scenarios and implement more sensors. In particular, our main focus for the future will be the investigation of cooperative position verification approaches. The
100
1
80
0.99
0.35
60
40 Faking only Faking and dropping Faking, with ART Faking dropping, with ART
20
0.98
0.1
0.95
10
20 30 Number of malicious nodes (%)
0.15
0.97
0.96
0 0
0.2
False positives
0.25 Detection rate
Delivery success ratio (%)
0.3
40
50
Detection rate of ART, faking−only attackers Detection rate of ART, faking dropping attackers False positives, ART, faking−only attackers False positives, ART, faking dropping attackers 10
15
20 25 30 35 40 Number of malicious nodes (%)
0.05
45
50
0
Figure 12: Highway scenario: a) delivery success ratio and b) detection rate and false positives ideas we are currently evaluating are based on proactive or reactive exchange of neighbor data to do consistency checks on the gathered information. If for example different nodes have recorded highly differing positions for the same neighbor, this strongly indicates some spoofing attempt. Both approaches will allow us to significantly enhance the reliability of geographic routing approaches in Vehicular Ad Hoc Networks.
6.
REFERENCES
[1] Blazevic, L., Giordano, S., and Boudec, J. L. Self organized terminode routing. Technical Report DSC/2000/040, Swiss Federal Institute of Technology, 2000. [2] C2C-CC. Car2Car Communication Consortium. http://www.car-to-car.org/. [3] CarTalk 2000. CarTalk 2000. http://www.cartalk2000.net, 2004. [4] Couto, D. S. J. D., and Morris, R. Location proxies and intermediate node forwarding for practical geographic forwarding. Tech. Rep. MIT-LCS-TR-824, MIT Laboratory for Computer Science, June 2001. ¨ fer, C., and Hartenstein, H. [5] Franz, W., Wagner, C., Maiho FleetNet: Platform for Inter-Vehicle Communications. In Procedings of 1st International Workshop on Intelligent Transportatin (WIT’04) (Hamburg, Germany, Mar. 2004). [6] Giordano, S., Stojmenovic, I., and Blazevie, L. Position based routing algorithms for ad hoc networks: a taxonomy. IEEE Communications Magazine 40, 7 (July 2001), 128–134. [7] Hou, T.-C., and Li, V. Transmission Range Control in Multihop Packet Radio Networks. IEEE Transactions on Communications 34, 1 (Jan. 1986), 38–44. [8] Hu, Y.-C., Perrig, A., and Johnson, D. B. Rushing attacks and defense in wireless ad hoc network routing protocols. In Proceedings of the ACM Workshop on Wireless security (WISE) (San Diego, CA, USA, 2003), pp. 30–40. ˇ [9] Hubaux, J.-P., Capkun, S., and Luo, J. The Security and Privacy of Smart Vehicles. IEEE Security and Privacy 4, 3 (2004), 49–55. [10] Kargl, F., Klenk, A., Schlott, S., and Weber, M. Advanced Detection of Selfish or Malicious Nodes in Ad Hoc Networks. In Proceedings of 1st European Workshop on Security in Ad-Hoc and Sensor Networks (ESAS 2004) (Sept. 2004), Springer Verlag, pp. 152–165. [11] Karp, B., and Kung, H. Greedy Perimeter Stateless Routing for Wireless Networks. In Proceedings of the Sixth ACM/IEEE International Conference on Mobile Computing and Networking (MobiCom 2000) (Boston, USA, Aug. 2000), pp. 243–254. [12] Ko, Y., and Vaidya, N. Location-aided routing (LAR) in mobile ad hoc networks. In Proceedings of the Fourth ACM/IEEE International Conference on Mobile Computing and Networking (MobiCom 1998) (1998), pp. 66–75. ¨ller, T., and Schoch, E. Greedy routing in highway [13] Leinmu scenarios: The impact of position faking nodes. In Proceedings
[14]
[15]
[16]
[17]
[18]
[19]
[20]
[21]
[22]
[23]
[24]
[25]
of Workshop On Intelligent Transportation (WIT 2006) (Mar. 2006). ¨ller, T., Schoch, E., Kargl, F., and Maiho ¨ fer, C. Leinmu Influence of Falsified Position Data on Geographic Ad-Hoc Routing. In Proceedings of the second European Workshop on Security and Privacy in Ad hoc and Sensor Networks (ESAS 2005) (July 2005). ¨ fer, C., Eberhardt, R., and Schoch, E. CGGC: Cached Maiho Greedy Geocast. In Proceedings of 2nd Intl. Conference Wired/Wireless Internet Communications (WWIC 2004) (Frankfurt (Oder), Germany, Feb. 2004), vol. 2957 of Lecture Notes in Computer Science, Springer Verlag. Marti, S., Giuli, T. J., Lai, K., and Baker, M. Mitigating routing misbehavior in mobile ad hoc networks. In Proceedings of the 6th annual international conference on Mobile computing and networking (2000), pp. 255–265. Mauve, M., Widmer, J., and Hartenstein, H. A Survey on Position-Based Routing in Mobile Ad-Hoc Networks. IEEE Network 1, 6 (Dec. 2001), 30–39. Michiardi, P., and Molva, R. CORE: a collaborative reputation mechanism to enforce node cooperation in mobile ad hoc networks. In Proceedings of the IFIP TC6/TC11 Sixth Joint Working Conference on Communications and Multimedia Security (Deventer, The Netherlands, The Netherlands, 2002), Kluwer, B.V., pp. 107–121. Newsome, J., Shi, R., Song, D., and Perrig, A. The Sybil Attack in Sensor Networks: Analysis and Defenses. In Proceedings of IEEE International Conference on Information Processing in Sensor Networks (IPSN 2004) (Apr. 2004). Saha, A. K., and Johnson, D. B. Modeling mobility for vehicular ad-hoc networks. In Proceedings of the first ACM workshop on Vehicular ad hoc networks (VANET ’04) (2004), ACM Press, pp. 91–92. Sastry, N., Shankar, U., and Wagner, D. Secure verification of location claims. In Proceedings of the 2003 ACM workshop on Wireless security (WiSe’03) (2003), ACM Press, pp. 1–10. Takagi, H., and Kleinrock, L. Optimal transmission ranges for randomly distributed packet radio terminals. IEEE Transactions on Communications 32, 3 (Mar. 1984), 246–257. ˇ ´n, L., and Hubaux, J.-P. SECTOR: secure Capkun, S., Buttya tracking of node encounters in multi-hop wireless networks. In Proceedings of the 1st ACM workshop on Security of ad hoc and sensor networks (SASN 2003) (2003), ACM Press, pp. 21–32. Vora, A., and Nesterenko, M. Secure location verification using radio broadcast. In Proceedings of 8th International Conference on Principles of Distributed Systems (OPODIS 2004) (2004), Springer Verlag. VSCC. US Vehicle Safety Communication Consortium. http: //www-nrd.nhtsa.dot.gov/pdf/nrd-12/CAMP3/pages/VSCC.htm.