Improved Simulation of Flow Regime Transition in Sewers: Two-Component Pressure Approach Jose G. Vasconcelos1; Steven J. Wright2; and Philip L. Roe3 Abstract: Operational problems and system damage have been linked to the flow regime transition between free surface and pressurized flow in rapidly filling stormwater and combined sewer systems. In response, emphasis has been placed on the development of numerical models to describe hydraulic bores and other flow phenomena that may occur in these systems. Current numerical models are based on rigid column analyses, shock-fitting techniques, or shock-capturing procedures employing the Preissmann slot concept. The latter approach is appealing due to the comparative simplicity, but suffers from the inability to realistically describe subatmospheric full-pipe flows. A new modeling framework is proposed for describing the flow regime transition utilizing a shock-capturing technique that decouples the hydrostatic pressure from surcharged pressures occurring only in pressurized conditions, effectively overcoming the cited Preissmann slot limitation. This new approach exploits the identity between the unsteady incompressible flow equations for elastic pipe walls and the unsteady open-channel flow equations, and the resulting numerical implementation is straightforward with only minor modifications to standard free surface flow models required. A comparison is made between the model predictions and experimental data; good agreement is achieved. DOI: 10.1061/共ASCE兲0733-9429共2006兲132:6共553兲 CE Database subject headings: Transient flow; Pipes; Simulation; Sewers; Open channel flow.
Introduction Under normal circumstances, storm and combined sewers transport water through partially full pipes in an open-channel regime. Flow conditions within the sewers may be significantly altered during intense rain events as the pipes transition to a pressurized full-pipe condition with the air at the pipe crown often expelled by a hydraulic bore propagating on the free surface flow. The motivation to study this type of flow transition comes from operational problems observed in stormwater systems associated with rapid filling events. Reported problems include the geysering through vertical shafts and structural damages resulting from surges and waterhammer pressures, as described by Guo and Song 共1990兲 in the Chicago TARP system and by Zhou et al. 共2002兲 in the drainage system of Edmonton, Canada. In addition to these issues, the return of the drained water to grade may have serious impacts in terms of public health and environmental impact, particularly in cases of combined sewer systems. Historically, different numerical techniques have been em1
Ph.D. Candidate, Dept. of Civil and Environmental Engineering, Univ. of Michigan, 1351 Beal Ave., Ann Arbor, MI 48109. E-mail:
[email protected] 2 Professor, Dept. of Civil and Environmental Engineering, Univ. of Michigan, 1351 Beal Ave., Ann Arbor, MI 48109 共corresponding author兲. E-mail:
[email protected] 3 Professor, Dept. of Aerospace Engineering, Univ. of Michigan, 1320 Beal Ave., Ann Arbor, MI 48109. E-mail:
[email protected] Note. Discussion open until November 1, 2006. Separate discussions must be submitted for individual papers. To extend the closing date by one month, a written request must be filed with the ASCE Managing Editor. The manuscript for this paper was submitted for review and possible publication on October 7, 2004; approved on September 15, 2005. This paper is part of the Journal of Hydraulic Engineering, Vol. 132, No. 6, June 1, 2006. ©ASCE, ISSN 0733-9429/2006/6-553–562/$25.00.
ployed to predict flow in the open-channel and pressurized regimes, and no existing technique is fully satisfactory for both. However, both regimes can coexist in complex drainage systems, and their significantly different characteristics present challenges to the numerical description of the flow regime transition. First, the celerity of free-surface flow waves can be between 2 and 3 orders of magnitude smaller than acoustic waves observed in pressurized flows. Second, while pressurized flows can occur with negative gauge pressures, such is not possible in the free-surface flow regime. Finally, especially for systems with multiple inflow points, the possibility exists for multiple flow regime transitions to occur simultaneously and numerical methods that rely on the distinction between free surface and pressurized flow regions become extremely difficult to implement. It is desirable to be able to compute such events rapidly, to provide real-time information for storm management. This requires describing the fluid dynamics with simple one-dimensional models. Previous work of this kind is exemplified by the works of Wiggert 共1972兲, Song et al. 共1983兲, and Cunge et al. 共1980兲. Each one of these different model formulations proceeds from a fundamentally different approach and leads to general approaches that can be classified as rigid column, full-dynamic, or Preissmann slot models. While each of these different techniques is successful in describing a limited set of possible flow behaviors, each one has particular limitations. The following subsections describe each one of these approaches in more detail. Rigid Column Models This class of flow regime transition models is exemplified by the works of Wiggert 共1972兲, Hamam and McCorquodale 共1982兲, Li and McCorquodale 共1999兲, Zhou et al. 共2002兲, and Vasconcelos and Wright 共2003b兲, among others. These models solve an ordinary differential equation 共ODE兲 based on a momentum balance JOURNAL OF HYDRAULIC ENGINEERING © ASCE / JUNE 2006 / 553
in a rigid column represented by the pressurized portion of the flow. In each time step, the ODE is solved and the velocity of the rigid column is then updated. The location of the pressurization front is obtained using the continuity equation across the moving interface. To calculate the free-surface portion of the flow, some models use the method of the characteristics 共MOC兲 technique while Li and McCorquodale 共1999兲 also assume rigid column behavior beneath an air pocket where free surface flow occurs. These models are conceptually simple, and relatively easy to implement. More recent approaches have expanded the applicability of these models by including some interactions between the air and water phases within the sewers. Yet, the use of these models may be restricted by a number of limitations. First, one has to assume the occurrence of a pipe-filling bore. As mentioned previously, a rapid filling pipe event may occur without resulting in the flow regime transition; i.e., a hydraulic bore may form without filling the conduit. In such cases, some other type of numerical model would be required. Second, in some cases the pressure surges observed at interior points within the pressurized zone may exceed the corresponding value at the system limits, and this behavior cannot be captured by a rigid column model. Finally, interactions between the pressurization front and other waves present in the system cannot be described in detail. Among these interactions is the reversal of the pressurization front, as described by Cardle and Song 共1988兲.
preserved regardless of the pressure in the cross section, allowing for the introduction of surcharge pressures in the pressurized portions of the flow
c=
冑
g
Apipe Tslot
共1兲
The slot width Tslot can be sized to match the assumed celerity c in the pressurized portion of the flow, according to Eq. 共1兲, in which g = gravity acceleration and Apipe = cross-sectional area of conduit. In most cases, Tslot dimension is arbitrarily chosen based on numerical considerations. Because one set of equations is employed throughout the system, there’s no need to track the pressurization front, which can instead be “captured” as shock waves and bores in conservative “shock-capturing” methods 共Toro 2001兲. Unlike the full-dynamic models, Preissmann slot models can simulate, with minimum numerical diffusion, moving bores that do not close the pipe cross section. On the other hand, they are limited by the fact that pressurized flows can sustain subatmospheric pressures. In such models, if the piezometric head drops below the pipe crown in a given location, free-surface flow would develop. This is not physically possible unless appropriate ventilation is available at that point in the pipeline, and thus these models are not appropriate to the description of low pressure wave propagation.
Full-Dynamic Models These models are exemplified by Song et al. 共1983兲, Cardle and Song 共1988兲, Guo and Song 共1990兲, among others. These models exploit the similarities between the Saint-Venant equations and the equivalent mass and momentum equations for closed pipes. A shock-fitting technique approach is implemented in which the free surface and pressurized flow regimes are solved using equations that are appropriate to the particular regime. The location of the pressurization front is determined at each time step by solving a set of nonlinear equations based on mass and momentum conservation across the pressurization bore. These models represent an improvement over the rigid column models in the sense that they are able to simulate potentially more complex interactions between the bore and other existing waves. Additionally, the numerical discretization allows for description of transient pressure fluctuations that may occur within the pressurized flow. However, there are also limitations with this approach. First, the rapid filling problem may result in a bore that does not close the pipe cross section. The MOC applied to open channel flow cannot predict the propagation of bore fronts without excessive numerical diffusion. It is also possible in real stormwater systems that multiple pressurization fronts could develop. The tracking/calculation of each front may then become challenging, and the only way to avoid this issue is by adopting a shockcapturing approach instead of the shock-fitting alternative. Preissmann Slot Models The models for the flow regime transition based on the Preissmann slot concept are exemplified by the works by Cunge et al. 共1980兲, Garcia Navarro et al. 共1994兲, Capart et al. 共1997兲, Ji 共1998兲, Trajkovic et al. 共1999兲, Vasconcelos and Wright 共2004兲, among others. The introduction of a hypothetical slot at the top of the pipe to simulate the pressurization was originally suggested by Preissmann in 1961. The slot assures that the free surface is 554 / JOURNAL OF HYDRAULIC ENGINEERING © ASCE / JUNE 2006
Motivation and Objectives The usefulness of any numerical simulation is determined by two basic choices. These are the mathematical model adopted to describe the flow, and the numerical method used to solve the model. The choices must be individually sound, mutually compatible, and driven by the practical objectives. Our objectives here are to assess the capacity of the system to function in normal operation, and also to predict its response to unusual events, such as sudden flooding that causes the pipes to run full. When this “pressurized regime” occurs, the celerity of water waves in the pipe may change by more than 1 order of magnitude. Not only are the waves faster, but much stronger and more destructive. It is important that the model predict this, and also that the method can represent strong, sudden changes, cleanly and accurately. If the flow regime does not change, then the classical MOC, augmented by a shock-fitting routine, gives excellent results. However, modern shock-capturing methods give results that are almost as good 共Toro 2001兲. They have the advantages of dealing automatically with any number of shock waves and their interactions, and of dealing with either flow regime and adapting automatically to any change of regime. Such an approach is often applied to the mathematical model derived from the Preissmann slot concept. We apply it here to a slightly more general idea that allows the pipe to run full but with subatmospheric pressures if necessary. The numerical method selected to implement the model must also be a good one. Inferior methods often smear out the discontinuities in the flow, thereby underestimating their impact. To remedy this, one must use fine grid sizes and small time steps, pushing up the cost of the computation. It is not unknown for researchers to regain larger time steps by employing unrealistically small celerities in the mathematical model. These are not paths we intend to pursue. We have chosen a conservative finitevolume method in which each interface flux is computed by solv-
ing a Riemann problem. Such methods are well studied and are standard in many applications. Computationally, in the specific context of the sewer-filling problem, these methods yield highly satisfactory solutions in either the free-surface or fully pressurized regimes. Problems are encountered only with the wave that accompanies the change of regime. Mathematically, this is merely a compressive shock, similar to the ones that appear within a single regime, but it is one across which the celerity changes greatly, locally creating a strongly nonlinear problem. It is known from the literature on gas dynamics that if the change in wave speed across a shock is large compared with the speed of the shock itself, then oscillations are created locally, which then propagate away from the shock and contaminate other parts of the solution. The phenomenon is purely numerical in origin, and broadly understood, although a general cure is so far wanting. If we apply the standard methods without modification, we do indeed observe strong numerical oscillations of this kind. In this work, we have devised a semiempirical cure that seems to work quite well. The objective of this study is to present a new approach to the rapid pipe filling problem that addresses some of the limitations of current models for the solution of flow regime transition problems. The primary objective is to provide a general solution approach that can be applied along the entire pipeline without having to keep track of pressurization fronts, since this is a potentially difficult task in typical stormwater systems with complex geometries and multiple inflow points. This new approach is based on modifications to the mass and momentum equations to expand the range of applicability to simulate flows with subatmospheric pressure heads as well as flow regime transition problems. Because it has shock capturing properties, there is no need to track the pressurization front as required by rigid column or fulldynamic models. The foundations of this new approach are conceptually simple, allowing for straightforward adaptation of current mass and momentum equations solvers to simulate freesurface transient flows. The following sections present the details of the proposed model. This approach is referred to as the twocomponent pressure approach 共TPA兲.
of the water in the cross section, and with the shallow water assumptions, it generates a triangular pressure distribution normal to the pipe cross section. For simplicity, this term is herein referred to as hydrostatic pressure. The second pressure term should appear only as the flow if in the pressurized regime. If these two pressure terms are computed independently in pressurized regions of the flow, surcharge pressure variations will not affect the hydrostatic pressure term, and consequently the flow depth. The key issue is how to include the second pressure term in the formulation, and this is achieved by assuming that the unsteady pressurized flow is incompressible and an elastic behavior for the pipe walls. For incompressible pressurized pipe flows, the mass and momentum equations are 共Wylie and Streeter 1993兲 共3a兲
At + VAx + AVx = 0 AVt + AVVx + 共A/兲Px = gA sin ␣ − f
A兩V兩V 2D
in which V = flow velocity; ␣ = angle with the horizontal; f = Darcy–Weisbach friction factor; = water density; and P = pressure. After some manipulations, and assuming sin ␣ ⬵ S0, we obtain At + Qx = 0
共4a兲
Qt + Q2/Ax + gAhx = gA共So − S f 兲
共4b兲
in which h = piezometric pressure head of the flow Eq. 共4兲 is identical in form to the nonconservative version of the Saint-Venant equations 共Sturm 2001兲, obtained when the pressure term is derived in terms of the flow depth h instead of hc. That suggests that a numerical model able to solve open-channel flows should also be able to simulate incompressible pressurized flows, provided that the celerity is appropriately adjusted for each flow regime and that the additional surcharge pressure force is included. Now, adding ghAx to both sides of Eq. 共4兲 and expressing it in a quasilinear form results in
ជ + AU ជ = Sជ U t x
Methodology For prismatic channels, without lateral inflow or outflow, the Saint-Venant equations for open channel flows may be expressed in a vectorial, conservative form
ជ + Fជ 共U ជ 兲 = Sជ 共U ជ兲 U t x
冋册
ជ= A , U Q
冤
冥
Q ជ 兲 = Q2 Fជ 共U , + gAhc A
ជ兲= Sជ 共U
共2a兲
冋
0 gA共So − S f 兲
册 共2b兲
in which A = cross-sectional area of water flow; Q = water flow rate; hc = distance between the free surface and the centroid of the flow cross-sectional area; S0 = bed slope; and S f = energy slope 共given by Manning equation in this implementation兲. The inability of Preissmann slot models to simulate subatmospheric flows cannot be avoided since the formulation computes the hydrostatic and surcharge pressures in a single term in the momentum equation. This limitation can be addressed by decoupling the two expected pressure forces acting on a given cross section of the flow. The first pressure term is due to the presence
共3b兲
冤
0
共5a兲 1
A P 2Q A= −Q + A2 A A 2
冥
共5b兲
The distinction between the open-channel flow regime and the incompressible pressurized flow regimes is only noticeable in the term 共A / 兲共 P / A兲 in matrix A. For the open channel flows, this term is the square of the celerity of the open-channel waves, as demonstrated below, with Ts as the free surface width A共h兲 =
冕
h
Ts共y兲dy Þ A共h兲 = Ts共h兲h
0
p = gh ⬖
A共h兲 A P =g = c2 Ts共h兲 A
共6兲
In cases of incompressible pressurized flows when the pipe behavior is assumed elastic, the expression 共A / 兲共 P / A兲 also represents the celerity of the pressurized pipe flow, also referred as the acoustic wave speed a. The general expression for the celerity of unsteady pressurized flows is 共Wylie and Streeter 1993兲 JOURNAL OF HYDRAULIC ENGINEERING © ASCE / JUNE 2006 / 555
⌬P c2 = a2 = ⌬A ⌬ + A
A ⌬P with ⌬ = 0 Þ c2 = ⌬A
ជ + Fជ 共U ជ 兲 = Sជ 共U ជ兲 U t x 共7兲
The importance of this discussion is to establish the complete identity between the mass and momentum equations of openchannel flows and incompressible pressurized pipe flows with the elastic pipe wall assumption. It is important to point out that the structural similarity between the open-channel and pressurized flows celerity is not possible if the water compressibility is considered in the analysis. The strategy now is clear: use elasticity assumption as a computational tool that will add the required pressure force component necessary to describe the flow in pressurized mode. As result, during pressurized flows, the flow area A will be allowed to exceed the original pipe cross-sectional area Apipe. Going back to Eq. 共7兲 interpreting ⌬P as the pressure force expected only in pressurized flow conditions, and isolating for the correspondent pressure head expected only in pressurized flow conditions hs, we obtain hs =
a2 ⌬A g Apipe
冋册
ជ= A , U Q
共8兲
In the above equations, ⌬A represents the corresponding variation of the flow area from the pipe area Apipe, given by ⌬A = A − Apipe. The acoustic wave speed a is a parameter that is hard to determine in actual sewer flows, since it is dependent on a number of complex factors, such as the air distribution within the pressurized flow. Preissmann slot-based models assume a constant value for a throughout the pressurized flow region, and the same approach is followed in the TPA model. An important consequence of Eq. 共8兲 is that the value of ⌬A can be either positive or negative. For low pressure waves, when ⌬A becomes negative, the corresponding value of hs will drop below zero, thus reproducing negative pressure waves without changing the flow depth. We point out that the magnitude of ⌬A is much smaller than the pipe cross-sectional area, effectively not influencing the continuity equation. In order to deal with low pressure waves, it is crucial to determine if a given location has contact with the atmosphere for it will affect the calculation of hs and hc. In the case of a low pressure transient passing through an interior point without contact to the atmosphere, the value of hs will be decreased to satisfy the momentum balance. One can visualize this as a “shrinkage” of the cross section due to the negative gauge pressure wave. If, on the other hand, the low pressure transient reaches a location where there’s contact with the atmosphere through a ventilation shaft or the flow regime transition interface, then the value of hs is set to zero, and the required pressure drop happens by decreasing hc which results in free surface flow. The actual intrusion of air into a previously pressurized flow region is a two-phase flow problem and cannot be computed accurately by this new method or any of the other methods previously discussed. The additional pressurization term will be a function of the increase in flow area and effective celerity in the pressurized portion of the flow. Indeed, the introduction of hs as defined in Eq. 共8兲 into the fluxes of the momentum equation gives rise to a term in the form of a2⌬A. After decoupling the pressure terms, the modified version of the mass and momentum equations is very much similar to the original conservative form of the openchannel flow equations, modified just by the addition of gAhs in the momentum flux 556 / JOURNAL OF HYDRAULIC ENGINEERING © ASCE / JUNE 2006
冤
冥
Q ជF共U ជ 兲 = Q2 , + gA共hc + hs兲 A
共9a兲
ជ兲= Sជ 共U
冋
0 gA共So − S f 兲
册
共9b兲 This minimal change in the original equations allows for straightforward adjustment of current open-channel flow solvers to handle the possibility of flow regime transition and subatmospheric pipe flows. The above equations are solved in this study with the Roe first order upwind scheme and the solutions of some applications are compared with experimental data. The following subsection describes the characteristics of the numerical scheme used.
Roe Scheme Applied to Modified Mass and Momentum Equations A finite volume approach was used, in which the Riemann problem was solved approximately across each of the internal interfaces using the Roe first order upwind scheme. This requires the calculation of the fluxes on either side of the interfaces as well the contribution of the wave that crosses the control volume. Following Macchione and Morelli 共2003兲, the updated value for the ជ are provided by quantities U
冋
ជ n+1 = U ជ n − ⌬t 共Fជ n + Fជ n兲 − U i+1 i 2⌬x +
冋
⌬t ជ n 共Fi−1 + Fជ ni 兲 − 2⌬x
共j兲 兺j 兩共j兲兩共␦w共j兲兲i+1/2rជi+1/2
共j兲 兺j 兩共j兲兩共␦w共j兲兲i−1/2rជi−1/2
册
册
+ ⌬tSជ ni 共10兲
In the above equation n⫽time index. The values of the approximate values of the eigenvalues 共j兲 and the corresponding eigenvectors rជ共j兲 for A and Q across the interface require first the computation of the so-called Roe averages across each of the interfaces 共i , i + 1兲. Finally, 共␦w共j兲兲 j+1/2⫽strength of the wave that crosses the interface 共i , i + 1兲 ¯A 冑 i+1/2 = Ai+1Ai
共11a兲
冑Ai+1Qi + 冑AiQi+1 ¯ Q i+1/2 = 冑Ai+1 + 冑Ai
共11b兲
冑
¯ci+1/2 =
¯ci+1/2 =
g
冑
g
Ii+1 − Ii Ai+1 − Ai
if Ai+1 ⫽ Ai
1/2共Ai+1 + Ai兲 1/2共Ts共i+1兲 + Tsi兲
if Ai+1 = Ai
共11c兲
共11d兲
in which Ts = width of the free surface. In Eq. 共11兲, the value of Ii is determined as follows. In a given cell i in which there is free surface flow, only the hydrostatic pressure contributes toward Ii. Otherwise, if cell i is currently under pressurized flow regime, both the hydrostatic pressure and the pressure term based on hs from Eq. 共8兲 contributes toward Ii Ii = Aihc,i
共12a兲
Ii = Apipe共hc,i + hs,i兲
共12b兲
With these values calculated, the approximate eigenvalues and eigenvectors across interfaces 共i , i + 1兲 are obtained with the equations ¯ ¯共1兲 = Q + ¯c, ¯A
rជ
共1兲
=
1 ¯ 共1兲 T 关1 兴 , ¯ 2c
¯ ¯共2兲 = Q − ¯c ¯A
rជ 共2兲 =
共13a兲
1 ¯ 共2兲 T 关1 兴 ¯ 2c
共13b兲
Finally, the strength of the wave crossing the interface between cells 共i , i + 1兲, measured in terms of the variations ␦w at the interface 共i , i + 1兲, can be obtained with the equation
冋
冉
␦w共1兲共2兲 = ± 共Qi+1 − Qi兲 + −
冊
¯ Q i+1/2 ± ¯ci+1/2 共Ai+1 − A1兲 ¯A i+1/2
册 共14兲
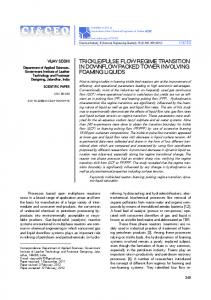
Model Results An assessment of the ability of the new TPA to model the rapid filling pipe problem was conducted by comparing the model predictions with two cases for which experimental data are available. In the first case, a flow regime transition was generated by introducing inflow in a horizontal pipeline partially filled with water, creating a pipe filling bore. In the second case, the center portion of this pipeline was raised, and flow was removed from one pipe end, generating negative piezometric head in the central portions of the pipe. The laboratory apparatus used in this study was constructed from a 9.4 cm diameter, 14.33 m long transparent acrylic pipeline so that flow regime transitions can be observed visually. Flow is either admitted or withdrawn from an acrylic box with sides 0.25 m ⫻ 0.25 m and height of 0.31 m 共relative to the pipe invert兲 at one end of the pipeline. This will be referred to as the upstream end of the system for consistency. A cylindrical acrylic surge tank with a diameter of 0.19 m was installed at the opposite 共downstream兲 end of the pipeline. The spill level in the surge tank was much higher than the fill box level such that no flow is lost from the system through the surge tank. This apparatus has been used in investigations on large surges resulting from sudden flow introduction 共Vasconcelos and Wright 2003a兲. To ensure consistency of the data collected, three repetitions were made for each flow condition studied. The following data were collected in each experimental run 共distances measured from upstream end兲: 1. Pressure at 9.9 m: measured with piezo-resistive pressure transducer 共6,895 Pa兲, manufactured by ENDEVCO, located at the bottom of the pipe; 2. Flow velocity at 9.9 m: measured with an acoustic Doppler velocimeter 共ADV兲, manufactured by SONTEK; 3. Pressure at 14.1 m: measured with piezo-resistive pressure transducer 共6,895 Pa兲, manufactured by ENDEVCO, located at the bottom of the pipe; and 4. Water level in the surge tank: recorded with a digital video camera, at 30 frames/ s.
Fig. 1. Representation of experimental apparatus used in rapid filling pipe experiments
Simulation of Rapid Filling Pipe Events In these experiments a predetermined water level, below the pipe crown, was set in the horizontal pipeline, and the system was allowed to come to rest. Flow was suddenly admitted through an inflow pipe by means of a two-way valve with an initial steady state flow produced at the desired discharge with the water initially being wasted. The preselected discharge was adjusted with valves and metered with a Venturi meter. In order to avoid potential complications associated with air entrainment in the inflow, the discharge end of the inflow pipe was submerged in the fill box. The flow was initiated by switching of a two-way valve and generated a hydraulic bore in the pipeline, which travels toward the surge tank. When the bore arrives at the surge tank, the water level increases, typically well above the spill level in the fill box. The water level in the fill box increases and it eventually starts spilling while inertial oscillations continue in the surge tank. Eventually, a new steady state condition is achieved after the oscillations in the surge tank have been damped by system losses, and all the inflow admitted at the fill box overflows at the same location. A sketch of the physical model is shown in Fig. 1. Since the air initially present in the system has the potential to affect the measurements, a few changes in the apparatus were made to control the air release from the system. A gate was installed at the downstream end of the pipeline and a ventilation tower was installed just upstream of it. The gate projects below the initial water surface and ensures that no air escapes through the surge tank, avoiding air bubbling through the surge tank which would make the measurement of surge tank water surface elevations difficult. To ensure that the air phase will not pressurize as it is expelled from the system by the pressurization bore, a ventilation tower with 3.2 cm diameter was installed upstream of the gate. Previous investigations 共Vasconcelos and Wright 2003a兲 indicated that this ventilation configuration ensures that no air pressurization would occur during rapid filling experiments. The numerical simulations using the TPA model described in the previous section were performed up to the time when the pressurization bore arrives at the riser and oscillations start to occur at that location. To match the conditions of the experiments, the inflow rate was set to 3.1 L / s and the initial water level was 7.3 cm 共78% of pipe diameter兲, with no initial velocity throughout the pipe. The value for the Manning rugosity was assumed to be n = 0.012, and the Courant number was set at 0.95. Unless otherwise stated, the number of computational cells used was 400, which resulted in a ⌬x around 3.6 cm. While the celerity for the free surface portion is determined with Eq. 共1兲, the choice of the corresponding value for the presJOURNAL OF HYDRAULIC ENGINEERING © ASCE / JUNE 2006 / 557
Fig. 2. Comparison between velocity measurements with ADV and model predictions for rapid filling pipe experiments
surized portion of the flow is not straightforward. First, it is likely that the resulting celerity is dependent on particular flow conditions during the rapid filling event, particularly the distribution of air bubbles left behind the pressurization front due to air entrainment in strong bores. The literature 共e.g., Wylie and Streeter 1993兲, suggests that celerity could range between 20 and 1,250 m / s depending on the air content and on the absolute pressure head in the system. For this study, the value selected for the celerity in the pressurized portion was 25 m / s; this value was selected to minimize postshock oscillations generated in the numerical solution. A discussion regarding these oscillations is provided later in this section. The particularities of the apparatus require the numerical treatment of the boundary conditions including the application of appropriate continuity, energy, and compatibility equations. The unknowns at the upstream end are the discharge, the flow area at the first computational cell, and the water level in the fill box. There are three equations available: the C− characteristic equation, obtained with data from Cells 1 and 2 from the previous time step; the energy equation between the fill box and the first cell; and the continuity equation applied to the fill box. This set of equations is solved iteratively until convergence. Similarly, at the downstream end, the unknowns are the discharge and flow area at the last cell, and the water level in the surge tank. The equations solved are the energy equation between the last node and the surge tank, the C+ characteristic equation, and continuity. An iterative process is also used here to achieve convergence. A comparison between the velocities measured at the 9.9 m station with the ADV and the model prediction is shown in Fig. 2. Due to the small time step used, only the results at every tenth time step are plotted. Initially there is no velocity in the system, with the bore arrival causing a sudden jump in the velocity. The velocity increases slightly after the bore passage, and then exhibits long period oscillations, which correspond to the inertial oscillations at the surge tank. The model captures the bore arrival time with good precision. The velocity behind the pressurization bore and the subsequent long period oscillations are reasonably described but the model underpredicts the damping of the velocity for subsequent oscillations, probably due to the underestimation of energy losses. Li and McCorquodale 共1999兲 also have reported that damping of the transient pressures are smaller than the ex558 / JOURNAL OF HYDRAULIC ENGINEERING © ASCE / JUNE 2006
Fig. 3. Comparison between pressure head variation measured with pressure transducers and model predictions at 9.9 m station for rapid filling pipe experiments
perimental observations if a constant steady friction factor was used in their model. The writers pointed out that when the friction was increased by a factor of 20, the observed damping matched their experimental observations. Measurements of the pressure head variation at the 9.9 m station with the corresponding model prediction are shown in Fig. 3. The figure shows the pressure head jump as the bore arrives and the pressure continues to increase at a slower rate after the bore passage. When the bore arrives at the surge tank, it impacts at the gate positioned before the surge tank causing a strong pressure pulse, which diminishes in a few seconds. The pressure subsequently increases as the water level rises in the surge tank. The model prediction is generally accurate with regard to the bore arrival time and jump in the pressure behind the bore. There are postshock pressure oscillations in the predictions which are stronger than the actual pressure oscillations. The model does not simulate the pressure pulse caused by the impact of the bore at the downstream gate since that effect is not included in the boundary conditions, so the strong oscillations resulting from this impact are not present in the model predictions. The model predictions of the maximum pressure as the water level increases at the surge tank are overpredicted by 7%, and this result could again be related to underestimation of energy losses. The pressure measurements at the 14.1 m station and the TPA model predictions 共data not shown兲 show that there is no pressure increase while the bore advances through the pipe, indicating that the air escapes freely from the system. The model predicts the bore arrival time at the surge tank correctly. The results of the surge tank water level variation obtained with the camcorder and the model prediction 共data not shown兲 have the same qualitative behavior as the pressure measurements at the 14.1 m station.
Simulation of Negative Piezometric Pressure Flows The second flow configuration simulated has no direct relationship with flow regime transition problems, but it serves to demonstrate the ability of the TPA model to simulate full pipe flows with negative gauge pressures. In order to create conditions in which negative pressure heads would occur, the center portion of
Fig. 4. Changes in experimental apparatus to generate flows with negative piezometric gauge pressures
the pipeline was raised. The first half of the pipe was set with an upward slope of approximately 2.0%, and the second half has a corresponding downward slope. The pipe was elevated approximately 0.15 m at the center compared with the ends. The experiment was performed by filling the system to a level of 0.30 m at the fill box and the system allowed to come to rest. Then a siphon was suddenly initiated at the fill box, causing an outflow that resulted in a decrease in water level at that end. After some time, the water level in the fill box decreased to a level that created subatmospheric pressures at the center portion of the pipeline. Eventually, when the water level dropped below the pipe crown at either end of the system, a more complex flow pattern developed, characterized by the intrusion of finite volume air cavities, as described by Baines 共1991兲. That flow configuration is outside of the scope of this work, since it would require a twophase flow model to be simulated. A sketch of the experimental setting and the procedure is shown in Fig. 4. The velocity and pressure at the 9.9 m station were measured during these experiments, along with the pressure at the 14.1 m station. For the numerical simulation the celerity was set at 300 m / s, based on experimental measurements of pressure pulse propagation between the two pressure transducers in a separate experiment. The outflow was assumed constant and a value of 0.45 L / s was estimated by observing the change in water volume over time. The remaining parameters were the same as in the previous example. The measured velocities at the 9.9 m station with corresponding model predictions are shown in Fig. 5. It is noticed that the model captures the general behavior of the velocity oscillations very well. The experimental data show a faster decay of the velocity amplitudes in the oscillations. We speculate that this may de due to the assumption of outflow uniformity, which may not be so accurate, or even problems with energy loss estimation. Forty seconds after flow initiation, there’s a marked discrepancy between the predicted and measured velocities due to the intrusion of air cavities in the model simulation. This condition constitutes a two-phase flow configuration that cannot be correctly modeled with the TPA model. The experimental data show that this intrusion actually occurred a little later, at 42.5 s. The model predictions and experimental measurements of the pressure at the 14.1 m station are compared in Fig. 6. Very good agreement is noticed in the initial 40 s, and the lack of agreement after this is caused by the intrusion of air cavities in the pipe, which cannot be modeled with the TPA model. The same comments are applicable to the predicted and measured pressures at the 9.9 m station 共not shown here兲.
Fig. 5. Comparison between velocity measurements with ADV and model predictions for negative piezometric flow experiments
Numerical Oscillations in Flow Regime Transition Simulations As previously discussed, numerical postshock oscillations behind the bore separating the free surface and the pressurized flow regions were observed in the numerical simulations. First-order upwind methods are designed so that, when they are applied to problems with only one unknown 共scalar problems兲, any captured discontinuities are oscillation free. Nevertheless, when the schemes are applied to systems of equations with several unknowns, oscillations are frequently observed. In gas dynamics this problem was first noted by Woodward and Colella 共1984兲 who gave an heuristic explanation. Several subsequent investigations 共for example Arora and Roe 1997 have stressed that the phenomenon does not occur if the governing equations are linear 共such as acoustic waves兲 because the various wave families then
Fig. 6. Comparison between pressure head variation measured with pressure transducers and model predictions at 14.1 m station for negative piezometric flow experiments JOURNAL OF HYDRAULIC ENGINEERING © ASCE / JUNE 2006 / 559
Fig. 7. 共a兲 Effect of grid discretization on postshock oscillations in numerical predictions and 共b兲 effect of acoustic wave speed on advance of pipe filling bore after attenuation of numerical oscillations. Pressure head profiles at T = 7.0 s for rapid filling pipe example.
do not interact, and each wave behaves in a “scalar” fashion. The severity of the problem can be related to the degree of nonlinearity in the system. Any realistic model of rapid pipe filling is highly nonlinear, since wave speeds change substantially as soon as the pressurization occurs. One would expect that numerical oscillations would be observed, and that they would become more severe as the celerity assumed in the pressurized region is increased. Indeed, oscillations have been reported from models based on the Preissmann slot concept 共Trajkovic et al. 1999; Vasconcelos and Wright 2004兲. That these oscillations have a purely mathematical origin is demonstrated by the results in Fig. 7共a兲. As the numerical mesh is refined, the amplitude of the oscillations is almost unaffected, but their spatial extent is reduced, because roughly the same number of computational cells is affected. These observations regarding the nature of these postshock oscillations are in agreement with the work by Arora and Roe 共1997兲. According to the writers, the discrete representation of the shock structure in shock capturing models is approximately periodic in time. Oscillations associated with the shock would form with period T = ⌬x / Vs and wavelength ⌬x / Vs, where Vs⫽shock velocity and ⫽speed of the wave carrying the oscillations. This is in close agreement with the observed oscillations in the current simulations of bores causing flow regime transition. The origin of these oscillations is in the solution method of the Riemann problem across the discontinuity. The linearization of the shock gives rise to nonvanishing waves formed at the shock that contaminates the numerical solution. According to the writers, some possible solutions for these oscillations would be the use of adaptive grids with dissipative schemes, nonphysical viscosities, or subcell resolution approaches. None of these approaches are totally satisfactory for the flow regime transition problem. The current investigation suggests that the most important parameter to determine the strength of the numerical oscillations is the celerity in the pressurized portion of the flow. Higher celerities generally resulted in oscillations with higher amplitudes. Since the surcharge term gAhs in the momentum equation depends on a2, high celerity values would cause this term to attain a higher magnitude than the other momentum flux terms. The problem is worsened by the marked difference in the celerities across the pressurization front. As discussed previously, there is a great deal of uncertainty in the value for the celerity in the pressurized portion of the flow. Experimental measurements indicate that pressurized wave celer560 / JOURNAL OF HYDRAULIC ENGINEERING © ASCE / JUNE 2006
ity may exceed hundreds of meter/second in some cases, yet current shock capturing models tend to avoid the use of high values for celerities. For instance, Garcia-Navarro et al. 共1994兲 simulated a flow in a closed rectangular pipe, and used a slot width of 0.01 m, which yields a celerity of 8.6 m / s. Capart et al. 共1997兲 and Trajkovic et al. 共1999兲 used a slot width of 10% of the circular pipe diameter, resulting in celerities that would vary between 2 and 20 m / s for the common range of sewer/tunnel dimensions. The use of such small values for the celerity is usually motivated by the resulting increase in the time step of computations. It also helps to mask the problem of the numerical oscillations across pipe-filling bore fronts, since the discontinuity in the magnitude of the celerities across the shock is reduced. However, in cases when closed pipe transient waves are expected in the problem, the choice of low celerities may cause severe underestimation of transient pressures, severely impairing the design accuracy of the storm system. Previous approaches to deal with these numerical oscillations in Preissmann slot models include a gradual transition in the free surface width between the pipe crown and the slot. The development of new approaches to attenuate the influence of these numerical oscillations is currently under investigation. These techniques include the application of numerical filtering to the results, change of the discretization stencil used in the finite volume computation, and the creation of new flux functions. In this paper a numerical filtering technique is used to attenuate the oscillations from the solution. This filtering can be achieved by implementing a convolution between the discrete distribution of the dependent variables A and Q in a given time and filtering function. By definition, the convolution of two functions f and g is given by fⴱg=
冕
L
f共x兲g共L − x兲dx
共15兲
0
in which f = either the discrete spatial distribution A共x兲 or Q共x兲 for a given time step; and g = discrete filtering function. The selection of g is based on the minimization of the high frequency numeric oscillations that appear behind the pressurization front. To reduce the computational effort of the convolution calculation, a discrete fast Fourier transform 共FFT兲 technique is applied 共Press et al. 1989兲. This convolution can be applied at each time step, and results in the introduction of some numerical diffusion in the results. Different three-point filter functions were tested, and the filter with values 0.050, 0.9000, and 0.050 was applied with good
results in removing most of the high frequency oscillations. Fig. 7共b兲 illustrates the effect of the application of the numerical filter to the rapid filling pipe example. In this figure, three pressure head profiles are plotted for T = 7.0 s and different assumed values for the acoustic wave speed 共25, 50, and 100 m / s兲. As expected, the advance of the inflow front is not affected by the different values of a used. Noticeable oscillations are still present with the results of a = 100 m / s. In general, the filter attenuates the numerical oscillations successfully, while generating some numerical diffusion in the advancing front. The drawback of this filtering approach is the increased computational effort, on the order of 60%. In summary, one additional complication for the simulation of the flow regime transition problems is the formation of postshock oscillations whenever the flow regime transition coincides with the bore. These oscillations are stronger for large discontinuities between the pressurized and free-surface wave celerities, but the use of fine grids tends to limit the zone of influence of such oscillations. To keep these oscillations small, lower values for the celerity within the pressurized portion of the flow may be used, but that may compromise the accuracy of the simulations if pressurized transients are expected. A technique based on the filtering of these numerical results is used and the results indicate its efficiency in attenuating the oscillations.
Conclusions This study investigates the problem of flow regime transition in stormwater systems. Several numerical models have been developed to date to describe this problem, but none are fully satisfactory. Among the limitations, rigid column and full dynamic models require the location of the pressurization front at each time step and this can be particularly troublesome in systems with multiple inflow points. That difficulty is avoided by Preissmann slot models, but their ability to simulate the propagation of low pressure waves is limited. The objective of the present study was to develop a model that does not require the computation of the front location, but is able to simulate both high and low pressure waves with equal precision. This is precisely what the two-component pressure approach model accomplishes. The fundamental change in the mathematical model is to decouple the hydrostatic pressure term from the pressure term that appears only in the pressurized flow regime. In this work, this decoupling is promoted by assuming an elastic behavior for the pipe, which allows for a direct relationship between the additional storage gained in the pressurized flow regime and the resulting pressurization head. Other mechanisms to establish this relationship can be applied, but regardless of the selected method the resulting pressure term will be a function of the gain in storage ⌬A and the celerity a in the pressurized flow regime. The simplicity of the concept allows for straightforward adaptation of this proposed approach to current free-surface flow solvers. A numerical model using a first order Roe solver was implemented to solve the resulting equations. The model predictions compared well with experiments simulating the rapid filling of a horizontal pipeline. Similar comparisons with experiments in a modified pipeline that experienced subatmospheric pressures were also made and good agreement was observed in the model predictions. This appears to validate the proposed model, but further investigations are planned in order to compare the predictions
of the TPA model with different numerical models currently in use. There are still some challenges with regard to this model that will require further investigation. Although the occurrence of postshock oscillations appears to be inevitable in shock-capturing models such as this one, it is possible that a clever numerical solution can attenuate the magnitude of such oscillations. It is also planned to incorporate the effect of air phase pressurization in the analysis in a manner consistent with the implementation by Vasconcelos and Wright 共2004兲.
Acknowledgment The authors would like to acknowledge the support of the CNPq, a Brazilian Government entity committed to the development of science and technology, which has provided a fellowship to support the Ph.D. studies of the first author.
References Arora, M., and Roe, P. L. 共1997兲. “On postshock oscillations due to shock capturing schemes in unsteady flows.” J. Comput. Phys., 130共1兲, 25–40. Baines, W. D. 共1991兲. “Air cavity as gravity currents on slope.” J. Hydraul. Eng., 117共12兲, 1600–1615. Capart, H., Sillen, X., and Zech, Y. 共1997兲. “Numerical and experimental water transients in sewer pipes.” J. Hydraul. Res., 35共5兲, 659–670. Cardle, J. A., and Song, C. S. S. 共1988兲. “Mathematical modeling of unsteady flow in storm sewers.” Int. J. Eng. Fluid Mech., 1共4兲, 495– 518. Cunge, J. A., Jr., F. M. H., and Verwey, A. 共1980兲. Practical aspects of computational river hydraulics, Pitman, London. Garcia-Navarro, P., Priestley, A., and Alcrudo, F. 共1994兲. “Implicit method for water flow modeling in channels and pipes.” J. Hydraul. Res., 32共5兲, 721–742. Guo, Q., and Song, C. S. S. 共1990兲. “Surging in urban storm drainage systems.” J. Hydraul. Eng., 116共12兲, 1523–1537. Hamam, M. A., and McCorquodale, J. A. 共1982兲. “Transient conditions in the transition from gravity to surcharged sewer flow.” Can. J. Civ. Eng., 9, 189–196. Ji, Z. 共1998兲. “General hydrodynamic model for sewer/channel network systems.” J. Hydraul. Eng., 124共3兲, 307–315. Li, J., and McCorquodale, A. 共1999兲. “Modeling mixed flow in storm sewers.” J. Hydraul. Eng., 125共11兲, 1170–1180. Macchione, F., and Morelli, M. A. 共2003兲. “Practical aspects in comparing the shock-capturing schemes for dam break problems.” J. Hydraul. Eng., 129共3兲, 187–195. Press, W. H., Flannery, B. P., Teukolsky, S. A., and Vetterling, W. T. 共1989兲. Numerical recipes in Pascal, Cambridge University Press, Cambridge, U.K. Song, C. S. S., Cardle, J. A., and Leung, K. S. 共1983兲. “Transient mixedflow models for storm sewers.” J. Hydraul. Eng., 109共11兲, 1487– 1504. Sturm, T. 共2001兲. Open channel hydraulics, 1st Ed., McGraw–Hill, New York. Toro, E. F. 共2001兲. Shock-capturing methods for free-surface shallow flows, Wiley, New York. Trajkovic, B., Ivetic, M., Calomino, F., and DIppolito, A. 共1999兲. “Investigation of transition from free surface to pressurized flow in a circular pipe.” Water Sci. Technol., 39共9兲, 105–112. Vasconcelos, J. G., and Wright, S. J. 共2003a兲. “Laboratory investigation of surges formed during rapid filling of stormwater storage tunnels.” Proc., 30th IAHR Congress, IAHR, Thessaloniki, Greece. Vasconcelos, J. G., and Wright, S. J. 共2003b兲. “Surges associated with air JOURNAL OF HYDRAULIC ENGINEERING © ASCE / JUNE 2006 / 561
expulsion in near-horizontal pipelines.” Proc., FEDSM03—4th ASME-JSME Joint Fluids Engineering Conf., Honolulu. Vasconcelos, J. G., and Wright, S. J. 共2004兲. “Numerical modeling of the transition between free surface and pressurized flow in storm sewers.” Innovative modeling of urban water systems, Monograph 12, W. James, ed., CHI Publications, Ontario, Canada. Wiggert, D. C. 共1972兲. “Transient flow in free-surface, pressurized systems.” J. Hydraul. Div., Am. Soc. Civ. Eng., 98共1兲, 11–27.
562 / JOURNAL OF HYDRAULIC ENGINEERING © ASCE / JUNE 2006
Woodward, P., and Colella, P. 共1984兲. “The numerical simulation of twodimensional fluid flow with strong shocks.” J. Comput. Phys., 54, 115–173. Wylie, E. B., and Streeter, V. L. 共1993兲. Fluid transients in systems, Prentice-Hall, Upper Saddle River, N.J. Zhou, F., Hicks, F. E., and Steffler, P. M. 共2002兲. “Transient flow in a rapidly filling horizontal pipe containing trapped air.” J. Hydraul. Eng., 128共6兲, 625–634.