Improved software engineering decision support through automatic argument reduction tools Tim Menzies West Virginia University
[email protected]
James Kiper, Miami University,
[email protected]
Martin S. Feather, Jet Propulsion Laboratory, California Institute of Technology,
[email protected]
Abstract Some of the most influential decisions about a software system are made in the early phases of the software development life cycle. Those decisions about requirements and design are generally made by teams of software engineers and domain experts who must weigh the complex interactions among requirements and the associated developmental and operational risks of those requirements. Some of these early life cycle decisions are more influential, or perhaps fateful, to subsequent software design and development than are others. When debating about complex systems with a large number of options, humans can often be slower than an AI system at identifying the clusters of key decisions that give the most leverage. By focusing a group of human domain experts or software engineers on these key decision clusters, more time can be devoted to these pivotal decisions and less time is wasted on irrelevancies.
1 Introduction In early phases of a system development, many crucial decisions about software are taken. In the process of requirements elicitation and analysis, it is common for clients to request much more than can be afforded - either because of budgetary constraints, time limitations, or other issues like safety concerns. That is, there are risks associated with requirements. (In this context, we take a broad definition of 0 SEDECS2003: the 2nd International Workshop on Software Engineering Decision Support (part of SEKE2003); June 20 2003 http:// www.ksi.edu/seke/seke03.html.Date April 21, 2003. WP ref: 03/sekew/star1. URL:http://menzies.us/pdf/03star1v4. pdf
risk - anything that gets in the way of satisfying a requirement.) There are often many things that can be done to lower the risk, and thus increase the chances of meeting requirements. Preventative measures (e.g., training, adherence to coding standards) may reduce the likelihood of risks arising in the first place. Any verification of validation activity (e.g., requirements reviews, analysis and testing) that detects the presence of defects in time to allow for their correction also serve to reduce risk. Each of these risk reducting actions which from now on we will refer to as “mitigations” - has a cost associated with it (e.g., cost of training; time taken to perform reviews). In a typical system development, the sum total cost of all possible mitigations far exceeds the resources available. There is thus the need to pick from among these mitigations to emerge with a judicious selection that cost-effectively reduces risk. Two factors make this challenging - firstly, many of the key decisions must be made early in the life cycle, when detailed information is lacking; secondly, requirements, risks and mitigations can be numerous and interrelated in convoluted ways. This renders the selection of mitigations a 0 This work was sponsored by the NASA Office of Safety and Mission Assurance under the Software Assurance Research Program led by the NASA IV&V Facility and conducted at the University of Miami, West Virginia University (partially supported by NASA contract NCC20979/NCC5-685) and at the Jet Propulsion Laboratory, California Institute of Technology (under a contract with the National Aeronautics and Space Administration). The JPL work was funded by NASA’s Office of Safety and Mission Assurance, Center Initiative UPN 323-08. That activity is managed locally at JPL through the Assurance and Technology Program Office. The second author’s research is also supported in part by National Science Foundation Grants CCR-0204139 and CCR-0205588. Reference herein to any specific commercial product, process, or service by trade name, trademark, manufacturer, or otherwise, does not constitute or imply its endorsement by the United States Government or the Jet Propulsion Laboratory, California Institute of Technology.
difficult task, one that requires the involvement of human experts, but for which unaided human decision making is ineffective. Decision support tools are essential to aid experts to make these selections. The focus of this paper is on an AI-based approach that promises to extend the capabilities of the decision support mechanisms in current use.
DDP assertions are either: • Requirements (free text) describing the objectives and constraints of the mission and its development process; • Weights (numbers) associated with requirements, reflecting their relative importance; • Risks (free text) describing events that can damage requirements; • Mitigations: (free text) describing actions that can reduce risks; • Costs: (numbers) effort associated with mitigations, and repair costs for correcting Risks detected by Mitigations; • Mappings: directed edges between requirements, mitigations, and risks that capture quantitative relationships among them. The key ones are impacts, each one of which is a quantitative estimate of the proportion of a requirement that would be lost should a risk occur, and effects, each one of which is a quantitative estimate of the proportion by which a risk would be reduced were a mitigation to be employed (the ontology is also able to capture the phenomenon of a mitigation making some risks worse). • Part-of relations structure the collections of requirements, risks and mitigations;
2 Imagine the Scene ... A team of NASA’s top experts are debating options on some complex deep space mission. The mission is in its early planning stages so few of the details are fixed. The science team wants to add a new instrument package to the mission. But the propulsion experts are already worried about the payload mass and any addition worries them. Also, the electronics team members are worried about the added stress to power consumption and heat production on the on-board systems. A spirited discussion follows in which each team tries to explain the costs and benefits of their various proposals. In the midst of this heated debated, a screen flickers. The AI system monitoring the debate produces a visual display of the several clusters of alternate decisions, each of which meets cost restrictions and satisfies requirements to an acceptable level. The visualization of these clusters helps the team to realize that some sets of decisions, although feasible, do not fit their development organization. Simultaneously, the automated monitoring system has just realized that of the dozens issues remaining, a resolution on (e.g.) four matters makes debates about most of the other issues redundant. The AI system presents to the team a decision cluster- a set of useful alternative decisions. The team finds that it has consensus on two of those decisions, so those are quickly adopted. These two decisions greatly reduce the space of remaining discussions and the group finishes their debates in time for lunch.
Figure 1. DDP’s ontology it is hard to gather together these experts for more than a very short period of time. • The DDP tool supports a graphical interface for the rapid entry of the assertions. Such rapid entry is essential, lest using the tool slows up the debate. • Assertions from the experts are expressed in using an ultra-lightweight decision ontology (e.g. see Figure 1). The ontology must be ultra-lightweight since:
3 The DDP Tool
– Only brief assertions can be collected in short knowledge acquisition sessions. – If the assertions get more elaborate, then experts may be unable to understand technical arguments from outside their own field of expertise.
The above scene is not science fiction- some of the technology has already been developed, and applied to spacecraft technonogies for use in NASA missions. At JPL, the “Defect Detection and Prevention (DDP)” tool [3] is in use to organize interactive knowledge acquisition and decision making sessions with spacecraft experts. The DDP tool provides an ontology for representing these requirements, risks, and mitigations, and for reasoning about them. The process by which DDP is emploed is as follows:
The result of these sessions is a network of influences connecting project requirements to risks to possible mitigations. A (highly) stylized version of that network is shown in Figure 2. The ontology of Figure 1 may appear too weak for useful reasoning. However, in repeated sessions with DDP, it has been seen that the ontology is rich enough to structure and guide debates between NASA experts. For example, DDP has been applied to over a dozen applications to study
• 6 to 20 experts are gathered together for short, intensive knowledge acquisition sessions (typically, 3 to 4 half-day sessions). These sessions must be short since 2
Fitness
global optima
0.9
require4
fault2 0.4
0.3
local optima
0.4 fault3 require1
0.9
require3
fault1
- 0.3
1
- 0.1 1 require2 require5
action1
1 1
- 0.1 action2 action3
1
1 action4 1 action5
start
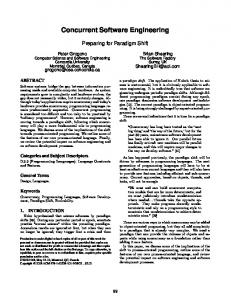
Figure 3. Simulated annealing, an example. Faces denote requirements; Toolboxes denote mitigations;
Further, at these meetings, some non-obvious significant risks have been identified and mitigated. Lastly, DDP can be used to document the information and decision making of these studies. Hence, DDP, although not mandated, remains in use at JPL:
Skulls denote risks; Conjunctions are marked with one arc; e.g. require1 if require2 and require3. Disjunctions are marked with two arcs; e.g. fault1 if fault2 or fault3.
• not only as a group decision support tool (as it was designed to do); • but also a design rationale tool to document decisions.
Numbers denote weights; e.g. action5 reduces the contribution of fault3 to fault1, fault1 reduces the impact of require5, and action1 reduces the negative impact of fault1. Oval denotes structures that are expressible in the latest version of the JPL semantic net editor (under construction).
That is not to say DDP cannot be improved.
4 Improving DDP
Figure 2. A semantic net of the type used at JPL [4].
4.1 Improving DDP with Simulated Annealing Optimizing risk mitigations means minimizing costs while maximizing benefits. That is, it is a classic optimization problem. A commonly-used search technique for such optimization is simulated annealing [7], illustrated in Figure 3. Simulated annealing is a kind of hill-climbing search for finding a good solution. A simple hill-climber searches in the neighborhood of the best solution found to date, and jumps to a new solution whenever one is found that improves upon the best to date. Hill-climbing can miss globally optimal solutions since it can’t move to a near-by higher peak if, to do so, means traveling down-hill across a valley. Simulated annealing avoids this problem using a “jump” factor that is a function of a “temperature” variable. At high “temperatures”, simulated annealing can sample more of the local terrain since it can jump up-hill or down-hill, that is, it is not constrained to only jumping to solutions that improve upon the best found to date. As the search proceeds and the “temperature” cools, simulated annealing makes down-hill jumps less and less frequently. Eventually, the jumping mechanism “freezes” and simulated annealing completes its search like a simple hill climber.
advanced technologies such as • • • • • • • • • • •
a computer memory device; gyroscope design; software code generation; a low temperature experiment’s apparatus; an imaging device; circuit board like fabrication; micro electromechanical devices; a sun sensor; a motor controller; photonics; and interferometry.
In those studies, DDP sessions have led to cost savings exceeding $1 million in at least two instances, and lesser amounts (exceeding $100,000) in some others. The DDP sessions have also generated numerous design improvements such as savings of power or mass, and shifting of risks from uncertain architectural ones to better understood (and hence more predictable and manageable) design ones. 3
expert judgment. Although such judgments are typically quite good (and are the best measure available), they cannot be assumed to be completely accurate. Thus, other sets of decisions, that are judged to meet the objective function at a slightly lower level, may have other properties that make them more desirable.
Benefit (attainment of requirements)
Optimal attainable for $1,000,000 or less
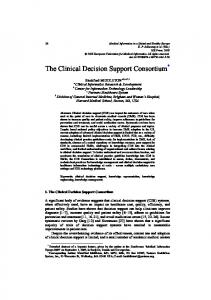
For example, if there are 100 decisions to be made (perhaps 100 mitigating activities that the project manager may do to assure product quality), there are 2100 possible sets of decision that could be taken. Of these, it would not be surprising for the simulated annealing to identify 1000 that are within 2% of the optimal value of the objective function. To ask a project manager or management team to chose among these 1000 may be a daunting task. We have been experimenting with various clustering strategies to reduce the complexity of this decision. As seen in Figure 5, this large number of decisions may be collected into a much smaller of clusters. Each cluster has the property that all its members share 95% of the decision.
Cost ceiling of $1,000,000
Cost
With this visualization, the human experts can now choose the cluster that best fits the characteristics of their development organization. That is, if the management team is aware that their team is especially strong in formal specification, but much weaker in model checking, then they would choose a cluster that includes more formal specification activities rather than model checking activities.
Figure 4. A simulated annealing run on a DDP dataset.
A simulated annealing capability is now part of the DDP tool [2]. This gives automated support for the difficult choices that project managers have to make among possible mitigations needed to reduce risk to acceptable levels. It is common in systems being developed at JPL for expert to identify 50 to 100 risks to requirements, and 50 to 100 mitigating actions that can be taken to reduce these risks to acceptable levels. Making a binary choice for each of 50 mitigations gives a search space of size 250 . A simulated annealing algorithm can search this space in a few minutes to give an adequate solution, or can be run for several hours to give a near optimal solution. An example of simulated annealing run on a DDP dataset is shown in Figure 4. In a typical JPL system development, such a search could be conducted overnight, between DDP sessions. This would provide the session participants the additional information that they need to finish the requirements and/or high level design.
4.3 Improving DDP with the TAR2 Tool
In a typical use of DDP, experts sketch out mappings between requirements, risks, and mitigations then search for the cheapest mitigations that most reduce risks. As discussed previously, this search can be overwhelming large. Figure 6.A shows the results of 50,000 runs with DDP for one spacecraft technology design study with 99 possible mitigations; i.e. 299 ≈ 1030 possibilities. This space is far too large to explore thoroughly. In each run, a random set of mitigations were selected each time. Note the huge range of possible costs and benefits. 1030 seems a dauntingly large number of options to explore. Fortunately, our TAR2 contrast set learner [6, 8–12] has shown that a heated discussion on most of the risk mitigations would be a complete waste of time. A contrast set learner finds the differences in variable settings seen in different situations. For example, an analyst could ask a contrast set leaner “what are the differences between people with Ph.D. and bachelor degrees?”. TAR2 differs from other contrast set learners such as TARZAN [13] and STUCCO [1] in that it searches for the smallest contrast set that most separates preferred and undesired behavior.
4.2 Improving DDP with Clustering When searching a complex space of decision options, simulated annealing produces a near-optimal solution. That is, after a large number of steps of the simulated annealing algorithm, a set of decisions is discovered that meets the objective function, and meets it more closely than any other decision set checked. However, it should be noted that the data of this search space is generally produced by 4
300 250
Benefit
200 150 100 50 0 400,000
700,000 Cost
1,000,000
Figure 6.A: Before. Here, one dot is one project plan; i.e. one possible setting to the 99 risk mitigation options.
300 250
Benefit
200 150 100 50 0 400,000
700,000 Cost
1,000,000
Figure 6.B: After. Results from applying the constraints learnt by the TAR2 contrast set learner.
Figure 6. An application of TAR2. X-axis= “cost” = sum of the cost of selected risk mitigations (lower is better). Y-axis= “benefit”= requirements coverage, less the effects of risk (more is better)
4.3.1 Inside TAR2 TAR2 searches for a strong select statement that most changes the ratio of classes. To understand the concept of a strong select statement, consider the log of golf playing behavior seen in Figure 7. In that log, we only play lots of 6 golf in 5+3+6 = 43% of the cases. To improve our game, we might search for conditions that increases our golfing frequency. Two such searches are shown in the bottom of Figure 7. In the case of outlook=overcast, we play lots of golf all the time. In the case of humidity ≥ 90, we only play lots of golf in 20% of the cases. The net effect of these two select statements is shown in Figure 8. The WHERE statements within a select statement can contain conjunctions of arbitrary size. Exploring all such conjunctions manually is a tedious task. TAR2 automatically finds the strongest select statements; i.e., the statement that most selects for preferred behavior while most discouraging undesirable behavior. TAR2 calls this strongest select statement the “treatment” since it is a recommended action for improving the current situation. TAR2’s configuration file lets an analyst search for the best select statement us-
Figure 5. Clusters of mitigations. In actual use, the identifiers are short descriptive phrases for each mitigation. These are shortened to fit this display, and to hide any details of the project. The shading indicates the number of solutions in the cluster that include that mitigation. The darker the shading, the more solutions that include it.
5
outlook sunny sunny sunny rain rain rain rain rain sunny sunny overcast overcast overcast overcast
temp(o F) 85 80 72 65 71 70 68 75 69 75 83 64 72 81
humidity 86 90 95 70 96 96 80 80 70 70 88 65 90 75
windy? false true false true true false false false false true false true true false
class none none none none none some some some lots lots lots lots lots lots
The goal of TAR2 is to improve the mean and reduce the variance in the behavior of a system. Figure 6.A shows 50,000 runs with DDP using mitigations compatible with the constraints learnt by TAR2. Comparing Figure 6.A withFigure 6.B, we see that the variance in behavior has indeed been greatly reduced while decreasing mean costs and increasing mean benefits. TAR2 generated Figure 6.B using only a small subset of the available risks mitigations. TAR2 made recommendations on only 13 rd of the 99 mitigations available in this DDP models. Further details on this use of TAR2 on a DDP dataset are found in reference [5].
SELECT class FROM original WHERE outlook= ’overcast’
SELECT class FROM original WHERE humidity >= 90
lots lots lots lots
none none none some lots
4.3.3 Drawbacks with TAR2 Figure 6.B shows that it is possible to use DDP models to optimize risk mitigation actions for complex systems, using only a small subset of the available options. However, in two aspects, the TAR2 experiment was a failure: • The hiding problem. TAR2’s output can hide important details. Recall from Figure 6.B that there exists a cluster of results that are the best TAR2 can find. While any point in those clusters are the best TAR2 can offer, adjacent points in the cluster may represent very different mitigations, some of which are more acceptable to the users than others. We intend to explore the hiding problem using the clustering methods shown above. • The runtime problem: TAR2 is too slow. The DDP model had to be executed 50,000 times to learn the constraints that generated Figure 2b. This runtime is too long to support interactive argument support. Worse still, bigger DDP models would take even longer to execute. Perhaps another method, like simulated annealing, might be better than TAR2.
Figure 7. Attributes that select for golf playing behavior. baseline
outlook = overcast
humidity ≥ 90
6 4 2 0
6 4 2 0
6 4 2 0
5
3
6
0
LEGEND:
0
4
none
some
3
1
1 lots
Figure 8. Changes to golf playing behavior from the baseline.
5 Is Simulated Annealing Better Than TAR2?
ing conjunctions of size 1,2,3,4, etc. Since TAR2’s search is elaborate, an analyst can automatically find the best and worst possible situation within a data set. For example, the select statements seen in Figure 8 were learnt by TAR2 and show the best and worst possible situation for playing lots of golf.
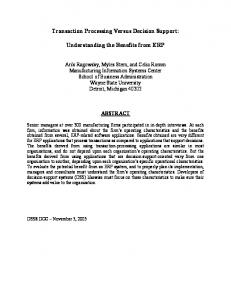
Figure 9 compares TAR2 and simulated annealing. At each round X (shown on the x-axis), simulated annealing or TAR2 was used to extract key decisions from a log of runs of a DDP model. A new log is generated, with the inputs constrained to the key decisions found between round zero and round X. Further rounds of learning continue until the observed changes on costs and benefits stabilizes. It is insightful to compare the results from TAR2 and simulated annealing:
4.3.2 TAR2 and DDP TAR2 processed Figure 6.A by dividing the known outputs into “preferred” and “undesired” regions (here, “preferred” means lower costs and higher benefits and “undesired” means not preferred). With knowledge of that division, TAR2 learnt a set of constraints that select for the preferred outcomes while avoiding the undesired regions.
• As seen in Figure 9, simulated annealing and TAR2 terminate in (nearly) the same cost-benefit zone. • Simulated annealing did so using only 40% of the data needed by TAR2; i.e. while TAR2 needed 50,000 runs 6
We have also introduced some clustering abilities into DDP. This allows a visual representation of sets of decisions that are that are self-similar within each cluster, and significantly distinct between cluster. In a parallel development, we have been exploring the use of machine learning to identify those critical decisions that have an especially strong impact on cost and effectiveness.
costs tar2 sa
950000
750000
550000
6.1 Future Work: STAR1= simulated annealing + TAR2
BaselineOne Two Three Four Five Final Round benefits 300
In the future, we plan to explore additional ways of modeling Requirements and risk early in the lifecycle, to more completely integrate this existing set of tools, and to further test this integrated package on actual projects at JPL or other NASA laboratories. For example, the directed search of SA needs less data than TAR2, but in doing so, we lose the main advantage of TAR2; i.e. no drastic reduction in the space of options. Perhaps we can get the best of both approaches. Our research is exploring combining the advantages of TAR2 (the selection of a small number of critical decisions) with SA (faster, directed search and an exploration of a larger space of possibilities). The “jumps” in simulated annealing are generated by mutating the best solution seen so far. In traditional SA, these mutations are selected at random. In our proposed approach, we would run a contrast set learner in parallel with the SA to build up a probability profile on settings that were most associated with worse solutions. The mutation sub-routine of the SA would then be modified to avoid mutations that include settings from the worst solutions. Our analogy for this process is that of a rocket flying down towards some preferred solution. SA is the gravity that pulls the rocket down faster while the contrast set learning is the booster than thrusts the rocket away from undesired situations. Specifically, our goals are:
250
200 tar2 sa
150 Baseline One
Two Three Four Round
Five
Final
Figure 9. Comparison of TAR2 and simulated annealing.
of DDP, the simulated annealing method needed only 20,000. • The bad news is that, while TAR2 proposed constraints on 33% of the mitigations, simulated annealing proposed actions on 100% of the mitigations. Such a result is consistent with the nature of simulated annealing- this search is a global search through all options. Hence, it tends to propose solutions to a large part of the model. In summary, the directed search of simulated annealing needs less data than the random search of TAR2, but in doing so, we lose the main advantage of TAR2; i.e. no drastic reduction in the space of options.
• Implement STAR1, a combination of SA (or other AI search algorithms) and TAR2, and integrate the result with DDP • Tune the STAR1 such that it such that it terminates in < 10 seconds (i.e. in time to interact with some active debate on some part of a DDP model). • Augment this integrated tool (STAR1) with a decision clustering tool • Improve the modeling of risk in DDP through probability distributions • Test this supplemented version of DDP during live debates on system options by JPL analysts.
6 Conclusions and Future Work Our current work has produced a set of tools to support decisions that need to be made by software engineers early in the software development life cycle. The DDP tool supports a model of requirements, risks (things that may cause requirements not to be attained), and mitigations (activities to reduce these risks.) This tool has been supplemented with an automated search mechanism (simulated annealing) that automates the process of finding near optimal sets of decisions in the large space of possible mitigating actions. 7
References
[11] T. Menzies and Y. Hu. Just enough learning (of association rules): The tar2 treatment learner. In Journal of Data and Knowledge Engineering (submitted), 2002. Available from http://menzies.us/ pdf/02tar2.pdf.
[1] S. Bay and M. Pazzani. Detecting change in categorical data: Mining contrast sets. In Proceedings of the Fifth International Conference on Knowledge Discovery and Data Mining, 1999. Available from http://www.ics.uci.edu/˜pazzani/ Publications/stucco.pdf.
[12] T. Menzies, D. Raffo, S. on Setamanit, Y. Hu, and S. Tootoonian. Model-based tests of truisms. In Proceedings of IEEE ASE 2002, 2002. Available from http://menzies.us/pdf/02truisms.pdf.
[2] S. Cornford, J. Dunphy, and M. Feather. Optimizing the design of end-to-end spacecraft systems using risk as a currency. In IEEE Aerospace Conference, Big Sky Montana, pages 9–16, March 2002.
[13] T. Menzies and E. Sinsel. Practical large scale whatif queries: Case studies with software risk assessment. In Proceedings ASE 2000, 2000. Available from http://menzies.us/pdf/00ase.pdf.
[3] S. Cornford, M. Feather, and K. Hicks. Ddp a tool for life-cycle risk management. In IEEE Aerospace Conference, Big Sky, Montana, pages 441–451, March 2001. [4] M. Feather, H. In, J. Kiper, J. Kurtz, and T. Menzies. First contract: Better, earlier decisions for software projects. In ECE UBC tech report, 2001. Available from http://menzies.us/ pdf/01first.pdf. [5] M. Feather and T. Menzies. Converging on the optimal attainment of requirements. In IEEE Joint Conference On Requirements Engineering ICRE’02 and RE’02, 9-13th September, University of Essen, Germany, 2002. Available from http://menzies. us/pdf/02re02.pdf. [6] Y. Hu. Treatment learning, 2002. Masters thesis, Unviersity of British Columbia, Department of Electrical and Computer Engineering. In preperation. [7] S. Kirkpatrick, C. D. Gelatt, and M. P. Vecchi. Optimization by simulated annealing. Science, Number 4598, 13 May 1983, 220, 4598:671–680, 1983. [8] T. Menzies, E. Chiang, M. Feather, Y. Hu, and J. Kiper. Condensing uncertainty via incremental treatment learning. In T. M. Khoshgoftaar, editor, Software Engineering with Computational Intelligence. Kluwer, 2003. Available from http://menzies. us/pdf/02itar2.pdf. [9] T. Menzies and Y. Hu. Reusing models for requirements engineering. In First International Workshop on Model-based Requirements Engineering, 2001. Available from http://menzies.us/ pdf/01reusere.pdf. [10] T. Menzies and Y. Hu. Agents in a wild world. In C. Rouff, editor, Formal Approaches to Agent-Based Systems, book chapter, 2002. Available from http: //menzies.us/pdf/01agents.pdf. 8