4938–4943 Nucleic Acids Research, 2000, Vol. 28, No. 24
© 2000 Oxford University Press
Improved statistical methods reveal direct interactions between 16S and 23S rRNA Scott T. Kelley*, Viatcheslav R. Akmaev1 and Gary D. Stormo2 Department of Molecular, Cellular and Developmental Biology, University of Colorado, Boulder, CO 80309-0347, USA, 1Genzyme Corporation, 1 Mountain Road, PO Box 9322, Framingham, MA 01701, USA and 2Department of Genetics, Washington University Medical School, 660 South Euclid, Box 8232, St Louis, MO 63110, USA Received August 4, 2000; Revised October 11, 2000; Accepted October 25, 2000
ABSTRACT Recent biochemical studies have indicated a number of regions in both the 16S and 23S rRNA that are exposed on the ribosomal subunit surface. In order to predict potential interactions between these regions we applied novel phylogenetically-based statistical methods to detect correlated nucleotide changes occurring between the rRNA molecules. With these methods we discovered a number of highly significant correlated changes between different sets of nucleotides in the two ribosomal subunits. The predictions with the highest correlation values belong to regions of the rRNA subunits that are in close proximity according to recent crystal structures of the entire ribosome. We also applied a new statistical method of detecting base triple interactions within these same rRNA subunit regions. This base triple statistic predicted a number of new base triples not detected by pair-wise interaction statistics within the rRNA molecules. Our results suggest that these statistical methods may enhance the ability to detect novel structural elements both within and between RNA molecules. INTRODUCTION The two main RNA components of the ribosome, 16S and 23S rRNA, have long been thought to directly interact across the interface of the two ribosomal subunits (1–3). The two subunits of the ribosome perform protein translation in a highly coordinated manner, suggesting that many intermolecular interactions occur between the subunits. Several molecular studies have uncovered regions of the 16S or 23S subunit that are directly connected (from cross-linking studies) or are protected from chemical modification by association with the opposite subunit (1,2,4–6). The most direct connection was discovered by Mitchell et al. (5), who cross-linked nucleotides 1408–1411 and 1518–1520 of 16S rRNA to nucleotides 1912–1920 of 23S rRNA. More recently, Merryman et al. (7,8) completed a comprehensive study on the effects of subunit association on
the accessibility of nucleotides in 16S and 23S rRNA. Using a series of chemical probes the authors produced an extensive map of sites in 16S and 23S of Escherichia coli that are chemically protected by association with the opposite ribosomal subunit (i.e. 16S with the 50S subunit and 23S with the 30S subunit). This broad evidence of subunit association, along with previous evidence of direct contact between the 16S and 23S rRNA, suggests that interactions between the ribosomal RNA molecules are an important aspect of ribosome structure and function. In order to determine which specific nucleotides might be involved in such intermolecular interactions, we utilized recently developed comparative analysis techniques to identify bases that show significant co-variation between the two rRNA molecules (9,10). Comparative analyses have proven very effective at uncovering secondary and tertiary structure within numerous RNA molecules (11–15) and similar principles should apply to the study of co-variation between RNA molecules (16). In this study we employed improved methods of comparative analysis that directly incorporate phylogenetic information in the prediction of interactions. Several authors have pointed out that phylogenetic information should help improve the prediction of interactions because it increases the signal to noise ratio by identifying the number of truly independent evolutionary changes (17–19). In a previous paper we demonstrated that incorporation of phylogenetic information enhanced the prediction of interactions over standard comparative analyses, which are already quite effective (9). Using these refined techniques we examined the nucleotides identified by Merryman et al. (7,8) as being at the interface of the two subunits and therefore potentially interacting. Such predictions not only indicate which particular nucleotides co-vary between the rRNAs, but also which regions of the two molecules might interact in three-dimensional space. Indeed, our statistical analysis predicted a number of nucleotides that may interact across the subunit interface and recent crystallography studies of the entire ribosome allowed us to verify that several of these co-varying nucleotides lie in close proximity of one another (20). Finally, the new computational techniques also enabled us to predict novel base triples within both 16S and 23S rRNA.
*To whom correspondence should be addressed. Tel: +1 303 735 1808; Fax: +1 303 492 7744; Email:
[email protected]
Nucleic Acids Research, 2000, Vol. 28, No. 24 4939
MATERIALS AND METHODS Data set Sequence alignments of 16S and 23S rRNA were downloaded from the Internet (21,22). The database of these sequences can be accessed at URL http://rrna.uia.ac.be/. We collected 16S and 23S sequences from 144 different species belonging to a diverse array of bacteria, eukarya and archaea. We excluded the mitochondrial sequences from the analyses, because they were missing several of the regions identified at the interface by Merryman et al. (7,8). From each of the sequences we selected 10 regions, five from 16S and five from 23S rRNA, that were identified as protected by subunit association. We included not only the nucleotides they identified directly, but also some surrounding nucleotides, so that in most cases the regions corresponded to known stem structures. This gave us a ‘positive control’ to test whether our techniques were able to recover known interactions in the stem regions of 16S and 23S rRNA. In 16S rRNA the regions we used corresponded to the following nucleotide positions in E.coli: 240–280, 670–730, 764–820, 890–910 and 1408–1500. In 23S rRNA the regions corresponded to the following E.coli nucleotide positions: 640–680, 700–740, 870–910, 1680–1750 and 1910–1960. Phylogenetic methods Details of the statistical methods used in this paper were presented in two previous publications (9,10). In those papers we developed two statistics to predict interacting bases, Hij and Rij, and showed that, because they incorporate phylogenetic information, they perform better than standard mutual information (MI) methods. Hij is the more robust of the two statistics and would be the method of choice except that it is computationally intensive and requires too much time to calculate for all of the potentially interacting pairs. Thus, we used the easily calculated Rij statistic to identify the most likely interacting pairs, which are then tested more rigorously using Hij. We also used a parsimony approach, using the program MacClade v.3.01 (23), to verify that the positions at which our methods predicted interactions had, in fact, changed multiple times on the phylogenetic tree. Given a phylogenetic tree and the character states for each taxon (leaf) of the tree (in this case the nucleotide bases at each position in the sequence), the program reconstructs the ancestral states at each node of the tree using the parsimony criterion (23). One of the outputs in the program is the ‘tree length’ for each position in the sequence, which is a calculation of the minimal number of changes that must have occurred at every position given the tree. In this way we demonstrate that interactions with significant Hij values have also changed multiple times. This is similar to the approach of other researchers who verify that two positions have changed together at least twice before accepting the correlation. The third statistic we employed detected simultaneous correlations among three nucleotides. Base triples have been predicted and experimentally verified in a number of RNA molecules, including 23S rRNA, type I and II tRNA and group I introns, showing that they are an important and common RNA structural motif (24). Previous studies showed that Sijk was adept at predicting known triple interactions and distinguishing these correlations from other types of interactions (10).
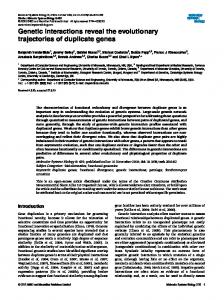
Figure 1. Distribution of pair-wise correlation values. (A) Histogram of Rij statistic results for all pair-wise combinations of nucleotides in potentially interacting regions of 16S and 23S rRNA, with the number of comparisons truncated at 100. The histogram includes values for combinations both within and between molecules. Values for known base pairs within 16S and 23S are shown in red. Other potentially interacting positions with Rij values less than –10 are shown in blue. (B) MI values for the same set of pair-wise combinations (truncated at 50) with values for known base pairs shown in red. For both figures the gray values represent other pair-wise combination scores (from the nearly 47 000 comparisons made).
RESULTS AND DISCUSSION Rij statistic results For the statistical analysis we removed positions that were >95% conserved or where ≥15% of the sequences had deletions. This left 143 and 164 variable positions in 16S and 23S rRNA, respectively. Rij statistics were computed for all possible pairs of these positions using the program CgHKY (9). The total number of pair-wise comparisons was 46 971, of which 23 452 were intermolecular. A histogram of the results is presented in Figure 1A.
4940 Nucleic Acids Research, 2000, Vol. 28, No. 24
To test the reliability of our methods we first determined how many of the known interactions within 16S and 23S rRNA were accurately predicted. Previous work indicated that an Rij value of 0 was a reasonable threshold with which to detect truly correlated positions (9). There are 105 known pairs (not counting the positions that we ignored because they are too highly conserved or contain too many gaps) and 92 of them (88%) have Rij > 0 (Fig. 1A). If we use a threshold of –10 for Rij, all but nine of the known pairs are found (i.e. there were nine false negatives). The nine ‘true pairs’ we did not predict did not form pairs in many of the sequences in the data set, a fact which explains their low correlation values. There are 102 additional pairs with Rij > –10 (dark blue in Fig. 1A), of which 94 are intermolecular and represent potential interactions between the subunits. The other eight intramolecular pairs (Rij > –10) are not found in the basic secondary structure, but may represent parts of base triples (Table 2) or possible false positives. The fact that we were able to predict most of the recognized stem structure using only 144 sequences, with most of the values greatly exceeding 0, indicated the general reliability of this approach for predicting nucleotide interactions. Compared with the Rij statistic MI does not perform nearly as well (Fig. 1B). Hij statistic results After finding the most likely candidate nucleotide positions for intermolecular interaction using the Rij statistic, we then tested the significance of these results with the more rigorous Hij statistic. Hij utilizes phylogenetic information more effectively than Rij and also approximates a χ2 distribution with 9 degrees of freedom (9). Given 23 452 intermolecular pair-wise comparisons, we set the Hij significance threshold at 106 comparisons and the threshold for significance would have been much more stringent. With typical secondary structure prediction one can apply additional information to detect intramolecular interactions, such as the expectation that base pairs will usually exist in antiparallel helices. However, for the intermolecular interactions we did not have such expectations and could not apply such constraints. If there were reasonably long helices formed between the subunits, such obvious motifs would most likely have already been identified. Instead, we expected to find isolated pairs, perhaps interacting as base triples or other complex structures. The 12 intermolecular pairs with highest values of Hij are shown in Table 1. Three of these exceed the value of 36 and
Figure 2. Histogram of Hij statistic values for a set of ∼300 intra- and intermolecular interactions, all with Rij values greater than –10. The dotted line indicates the Hij critical value of 36 for P < 0.00004 (see text for explanation). Values for both inter- and intramolecular base pairs are shown in red.
have P < 10–5 of occurring by chance. A few others have somewhat lower Hij values in the range where false positives might be expected, but they still remain plausible because they have P values in the range occupied by several of the known base pairs (Fig. 2). Although we have strong statistical evidence of intermolecular correlations, we acknowledge the possibility that the high Hij values are artifacts of the rRNA alignments that we used. However, after manually constructing alternative alignments, particularly for the 1450 region of 16S rRNA, we were unable to find any better alignments. The correlation values of the alternative alignments were always less and there was no obviously better way to construe the alignment given the current structural models. Therefore, we trust the alignments we used and are confident that the Hij statistic has identified truly correlated positions. Nature of predicted intermolecular interactions Figure 3 illustrates the six best candidates for intermolecular interactions according to our methods (Table 1). The highest co-variation scores we uncovered in our analyses corresponded to nucleotides on the penultimate stem of the 16S rRNA (Fig. 3). Recently published crystal structure information reveals that this stem region runs vertically along the 30S subunit body at the interface of the subunits and is certainly the most prominent feature of the subunit interface (20). The crystal structure information also places the helical region around position 1700 of 23S rRNA in close proximity to the 16S penultimate stem (20). Thus, we find significance in the fact that the two highest values in our co-variation analyses predict interactions between the 16S penultimate stem and the 1700 region of 23S rRNA (Table 1 and Fig. 3). The current crystal structure is not of high enough resolution to determine whether these nucleotides directly interact, but the predictions are at least plausible given this information. The types of interactions shown in Figure 3 do not appear to be standard Watson–Crick base pairs. Instead, most of them appear to be more complicated motifs between sets of base pairs. Although models of such interactions are not currently
Nucleic Acids Research, 2000, Vol. 28, No. 24 4941
Table 1. Rij and Hij values for predicted intermolecular interactions between nucleotides in 16S and 23S rRNA Number
Interactions
Steps
16S
23S
1
1460
1706
2
1459
1748a
False positives
Hij
Pos 1
Pos 2
P value
0.52
51.21
26
13