Accepted Manuscript Title: Improved structure stability, optical and magnetic properties of Ca and Ti co-substituted BiFeO3 nanoparticles Author: Vijay Kumar Satyendra Singh PII: DOI: Reference:
S0169-4332(16)31202-8 http://dx.doi.org/doi:10.1016/j.apsusc.2016.05.163 APSUSC 33356
To appear in:
APSUSC
Received date: Revised date: Accepted date:
17-2-2016 2-5-2016 30-5-2016
Please cite this article as: Vijay Kumar, Satyendra Singh, Improved structure stability, optical and magnetic properties of Ca and Ti co-substituted BiFeO3 nanoparticles, Applied Surface Science http://dx.doi.org/10.1016/j.apsusc.2016.05.163 This is a PDF file of an unedited manuscript that has been accepted for publication. As a service to our customers we are providing this early version of the manuscript. The manuscript will undergo copyediting, typesetting, and review of the resulting proof before it is published in its final form. Please note that during the production process errors may be discovered which could affect the content, and all legal disclaimers that apply to the journal pertain.
Improved structure stability, optical and magnetic properties of Ca and Ti co-substituted BiFeO3 nanoparticles Vijay Kumar and Satyendra Singh Special Centre for Nanoscience, Jawaharlal Nehru University, New Delhi-110067, India
Corresponding author: Tel.: +91-11-26738782; E-mail address:
[email protected]
1
Graphical abstract:
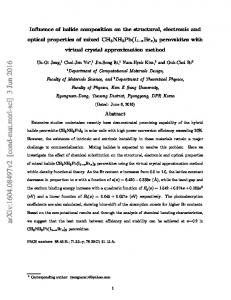
(a) UV-visible absorption spectra and (b) Tauc’s plots to determine the band gap of the Bi1xCaxFe1-xTixO3
nanoparticles for x = 0 (S1), 0.05 (S2), 0.10 (S3), 0.15 (S4), 0.20 (S5) and 0.25
(S6), respectively (c) Variation of band gap with x for Bi1-xCaxFe1-xTixO3 nanoparticles.
2
Highlights
First report on synthesis of Bi1-xCaxFe1-xTixO3, nanoparticles (0 ≤ x ≤ 0.25) Ca and Ti co-substitutions control the formation of secondary phases and improved the stability of perovskite phase Strong absorption of visible light with a small optical band gap (1.77 – 2.26 eV) Improved Mr and Hc due to the release of the latent magnetization locked within the toroidal spin structure
May be useful for data storage, spintronics and optoelectronics.
3
Abstract We report the optical and magnetic properties of single-crystalline Ca and Ti co-substituted bismuth ferrite, Bi1-xCaxFe1-xTixO3, nanoparticles, synthesized by a facile sol–gel methodology in the compositional range wherein 0 ≤ x ≤ 0.25. X-ray diffraction (XRD) and transmission electron microscopy (TEM) investigations show that all samples possess a rhombohedrally distorted perovskite structure with space group R3c. Ca and Ti co-substitution controls the formation of secondary phases and improved the stability of perovskite phase of BiFeO3. The average particle size was estimated by Williamson Hall plot, confirmed by TEM, and found to be 61, 52, 48, 43, 41 and 39 nm of Bi1-xCaxFe1-xTixO3 for x = 0, 0.05, 0.10, 0.15, 0.20 and 0.25, respectively. The UV-visible absorption study r e v e a l the strong absorption of visible light with a small optical band gap (1.77 – 2.25 eV) for 0 ≤ x ≤ 0.25 indicates a possibility of utilizing for photocatalytic activities. The magnetic study at room-temperature displays the improved magnetization and coercive field in Bi1-xCaxFe1-xTixO3 nanoparticles due to the release of the latent magnetization locked within the toroidal spin structure of BiFeO3.
Keywords: Nanostructured Materials, Ferroelectrics, Sol-gel Processes, Magnetization, Microstructure, Transmission electron microscopy, TEM
4
Introduction Multiferroics are the novel class of next-generation multifunctional materials, which display simultaneously two or all three primary ferroic properties i.e., ferroelectricity (or antiferroelectricity), ferromagnetism (or antiferromagnetism), and ferroelasticity in the same phase [1-3]. Recently, they have gained increasing scientific and technological attention due to their multi-functionality for many device applications in spintronics, data storage, microelectronic devices, transducers, ultrafast optoelectronic devices, sensors, etc [3-6]. Among all identified single-phase multiferroics, BiFeO3 (BFO) is the most promising material for practical device application because it displays the coexistence of ferroelectric and G-type antiferromagnetic ordering well above room temperature [7-10]. It has a high Curie temperature (Tc = 1103 K) and a high Neel temperature (TN = 643 K).
It has a rhombohedrally distorted
perovskite structure described by the space group R3c at room temperature [2, 11]. The distorted perovskite structure with FeO6 octahedra leads to the coupling of ferroelectricity and magnetism. In BiFeO3, the ferroelectric ordering arises from the relative displacement of cations induced by the 6s2 lone pair electrons of Bi3+ ions while the G-type antiferromagnetic ordering arises due to indirect exchange interactions between Fe3+ ions through O2- ions [5, 12-13]. In BFO ceramics, G-type antiferromagnetic ordering superimposed with cycloid spin structure leads to a net-zero magnetization. Some other drawbacks also exist with BFO such as high-leakage current, low remnant polarization and high dielectric loss which are needed to be addressed for device applications [14]. To overcome these problems and also to improve the multiferroic properties of BFO, numerous attempts have been made recently, such as substitutions at Bi and Fe sites [1518]. Among various kinds of substitutions reported at Bi-site in BFO, the Ca substitution
5
enhanced magnetoelectric coupling and also an increase in TN was observed with an increase in Ca content [19-20]. While Ti substitution at Fe-site can not only improved the leakage current problem significantly but also improved the magnetization in BFO [21-22]. In order to study the effect of Ca and Ti co-substitution on the properties of BFO, there are few reports in ceramics /bulk form [14, 23-24] but to the best of our knowledge there is no report on the effect of Ca and Ti co-doing on the optical and magnetic properties of BiFeO3 nanoparticles. In the present work, we report the structure stability, optical and magnetic properties of Bi1-xCaxFe1-xTixO3 nanoparticles synthesized by sol–gel methodology in the compositional range wherein 0 ≤ x ≤ 0.25.
Materials and methods The Bi1-xCaxFe1-xTixO3 nanoparticles with x = 0.00, 0.05, 0.10, 0.15, 0.20 and 0.25 (named as S1, S2, S3, S4, S5 and S6, respectively) were synthesized by the facile sol–gel methodology as explained in details elsewhere [25]. The Bi1-xCaxFe1-xTixO3 precursor solutions were prepared using high purity bismuth nitrate pentahydrate, Bi(NO3)3.5H2O (HiMedia, 98%), ferric nitrate nonahydrate, Fe(NO3)3.9H2O (HiMedia, 98%), calcium acetate monohydrate,Ca(CH3COO)2. H2O (HiMedia, 99.0%) and titanium butoxide, C16H36O4Ti (Sigma-Aldrich, 97%) dissolved in 2methoxy ethanol (Sigma-Aldrich, 99%), and acetic acid. The bismuth nitrate pentahydrate, ferric nitrate nonahydrate, calcium acetate monohydrate and titanium butoxide were dissolved in 2methoxyethanol separately in required stoichiometry at room temperature, then mixed together with a magnetic stirrer for 30 min to obtain homogenous Bi1-xCaxFe1-xTixO3 precursor solutions without any precipitate. A few drops of acetic acid was used to stabilize titanium butoxide solution prepared in 2-methoxyethanol. The Bi1-xCaxFe1-xTixO3 precursor solutions were dried 6
under IR lamp at 100 -150 oC in agate mortar until the solvent evaporates. The as-obtained final brownish color dried powders were calcined at 650 °C for 1 hour in the muffle furnace with heating rate 3 °C/min to obtain well nanocrystalline Bi1-xCaxFe1-xTixO3 powders. The crystallographic phase of all the samples were examined by powder x-ray diffraction (XRD) using a Rigaku MiniFlex 600 X-ray diffractometer (XRD) with CuKα radiation (λ= 1.54 Å) operating at 40 kV and 15 mA. All XRD data were recorded in 2θ range from 20 to 80 o at a scan rate of 2 degree per minute with step size 0.02o. The morphology, microstructure and crystallinity of the nanoparticles was studied by transmission electron microscope (TEM) (JEOL 2100F) operated at an accelerating voltage of 200 kV. For TEM analysis, samples were dispersed in ethanol using ultrasonicator and a drop of the dispersed solution was dropped on a carbon coated copper grid, which was dried carefully. The compositional analysis of as-synthesized nanoparticles was performed by energy-dispersive X-ray spectroscopy (EDX) attached with scanning electron microscope SEM (Zeiss EVO40). The absorbance spectroscopy was carried out on UV–vis spectrophotometer (PG instruments Ltd., T90+, UK) in the range from 300 to 900 nm. The magnetization (M) measurements as a function of an applied magnetic field (H) were performed at room-temperature using a physical property measurement system (PPMS, Cryogenics limited, USA) in the H of maximum ± 5 T. Results and Discussion Fig.1. show the room-temperature XRD profiles of Bi1-xCaxFe1-xTixO3 samples S1, S2, S3, S4, S5, and S6, respectively calcined at 650 oC. The peaks are sharp, narrow and well defined for all the samples, confirming that the all samples are of high quality with good crystallinity at long range. The observed diffraction peaks in XRD patterns could be indexed to a distorted rhombohedral perovskite crystal structure with space group R3c (JCPDS card no- 01-071-2494). 7
A small impurity phase Bi2Fe4O9 have been detected in XRD profile for the sample S1 may be because of both cation and anion vacancies, which is the general problem with BFO [26]. Such impurity was suppressed in Ca and Ti co-substituted samples (S2 - S6) as no such impurity peaks are present in XRD profiles. One can see that (104) and (110) reflections are well separated for S1 sample (Fig. 2.) indicating rhombohedral structure (space group R3c). It seems that these doublet peak start merging towards a single peak as Ca and Ti content increases, indicating the transformation from rhombohedral towards orthorhombic phase as observed earlier [24] but doublet nature is observed upto x ≤ 0.25 samples indicates the coexistence of rhombohedral and orthorhombic phases [27]. This may be due to the increase in the lattice distortion in the Ca and Ti co-substituted samples because of the difference in the atomic radius of substituents and host cations. The shifting of XRD peaks towards higher 2θ value with increasing the doping (as shown in the Fig. 2.) indicate the decrease in lattice constants as Ca and Ti get substituted in the BFO lattice. We have used these XRD data to evaluate average crystallite size and lattice strain induced in samples may be due to crystal imperfection and distortion using the Williamson-Hall equation [28]: βhklCosθhkl = kλ/D + 4εSinθhkl
(1)
where k, θhkl, D, ε, λ and βhkl are the shape constant (0.9), angle of reflection, average crystallite size, micro-strain, wavelength of Cukα radiation (1.5405 Å) and full width at half-maxima of the XRD peak in radian, respectively. The shape constant k depends on the how the width is determined, the shape of the crystal, and the size distribution. The value of k is usually taken as 0.9 for nanoparticles. Since βhkl includes both the instrumental and sample dependent effects, it is essential to collect a diffraction profile from a standard material like silicon to determine the
8
instrumental broadening [29]. The instrumental broadening was corrected, corresponding to the peaks of the sample using the relation:
βhkl= [(βhkl)2measured - (βhkl)2instrumental]1/2
(2)
The average crystallite size and induced strain were estimated using the equation (1) by plotting 4Sinθhkl along the x-axis and βhklCosθ along the y-axis for as-prepared nanoparticles as shown in Fig.3. We could not find βhkl for all diffraction peaks due to the overlapping of two or more peaks. From the linear fit to the data, the average crystallite size was estimated from the yintercept, and the lattice strain ε, from the slope of the linear fit. The average crystallite size and lattice strain are 58.5 (± 37.97 %), 49.8 (± 8.99 %), 46.5 (± 27.85 %), 41.3 (± 2.59 %), 39.5 (± 11.77 %), 38.1 (± 5.45 %) nm and 0.0014 (± 40.84 %), 0.0022 (± 8.09 %), 0.0027 (± 20.80 %), 0.0024 (± 2.43 %), 0.0025 (± 2.82 %), 0.0026 (± 5.29 %) for samples S1, S2, S3, S4, S5, and S6, respectively. Thus, it appears that the average crystallite size and lattice strain are varying nonmonotonic as a result of Ca and Ti co-substitution. The
transmission
electron
microscopy
(TEM)
was
employed
to
study
the
microstructural evolution of the samples S3 and S4. The typical TEM micrographs of an individual nanoparticle and randomly oriented nanoparticles of the samples S3 and S4, respectively are shown in Fig. 4a-b, respectively, show the particle size distribution and the shapes of the particles. The shape and the size of the as-synthesized nanoparticles are not uniform as can be seen the micrographs (Fig. 4a-b). The average particle size estimated from micrographs for the samples S3 and S4 came out to be about 49 and 44 nm, respectively which is good agreement as calculated from the XRD analysis. The inset of Fig. 4a shows the selected 9
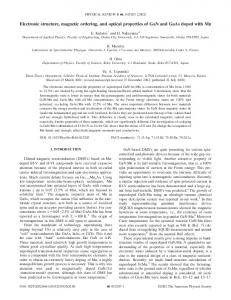
area electron diffraction (SAED) pattern of an individual nanoparticle of sample S3. The presence of sharp diffraction spots in the SAED pattern indicates high purity, well-developed, single crystalline nature of nanoparticles. It should be noted that the SAED pattern obtained from various areas of the sample also show akin sharp diffraction spots. Fig. 4c shows the SAED pattern of randomly oriented nanoparticles of sample S4. The circular interference fringes in the SAED clearly indicate the polycrystalline nature of sample S4 due to the random orientation of the nanoparticles. The diffraction rings could be indexed as (012), (104/110), (006/202), (024) and (116/122) planes, indicating that nanoparticles has a rhombohedral perovskite structure like BFO, which is consistent with the XRD results. Fig. 4d-e shows the high resolution TEM (HRTEM) micrographs taken on a portion of an individual nanoparticle of sample S3 & S4 respectively. The presence of well-resolved lattice fringes in HRTEM micrographs indicate that the nanoparticles are free from defects and show a high degree of crystallinity. The distance between the parallel interference fringes are about 2.82 Å, and 2.77 Å corresponding to the wellrecognized lattice d-spacing of the (104/110) atomic planes for samples S3 & S4 respectively, which agrees well with the value as calculated from the XRD data. The energy dispersive X-ray spectroscopy (EDS) was employed to determine the composition of as synthesised nanoparticles. The EDS profile (recorded by SEM, equipped with EDS) of Bi1-xCaxFe1-xTixO3 nanoparticles for x = 0.10 is shown in Fig. 5. The EDS profile reveals the presence of expected signals from Bi, Fe, Ca, Ti and O elements present in the nanoparticles. We have not observed any other peaks in EDS profile indicating the high purity of the nanoparticles. The presence of Au peaks in EDS profile is due to the gold because a thin layer of gold was deposited on the sample to reduce the charging effect. The EDS spectra was
10
taken at three different positions and the average atomic ratios of Bi, Fe, Ca, Ti and O elements were found very close to the nominal composition, within the instrumental accuracy. To study the effect of Ca and Ti co-doping on the optical properties of BFO, UV-visible spectroscopy was performed for all the samples. Fig. 6a show the absorption profiles in the range of 300–900 nm for Bi1-xCaxFe1-xTixO3 samples S1, S2, S3, S4, S5, and S6, respectively. The absorption profiles display a strong transition in the 450–650 nm range due to electronic transitions involving charge transfer from valence band O 2p states to conduction band Fe 3d states [30]. Such transitions indicate that Bi1-xCaxFe1-xTixO3 nanoparticles may absorb a higher percentage of visible light. The absorption edge for S1 is shifted towards lower wavelength side with increases substitution concentration, demonstrating the blue shift, which is an indication towards the increase in band gap. From the absorption profiles, the optical band gap values for all nanoparticles were calculated using Tauc’s relation for direct band gap [30]: (αhν)2 = A(hν - Eg)
(3)
where α , h, υ , Eg, and A are absorption coefficient, Planck constant, frequency of light, band gap, and A is the proportionality constant, respectively. The optical band gap of these nanoparticles can be acquired from the plots of (αhν)2 versus hν (photon energy), as shown in the Fig. 6b. This plot gives the optical band gap, Eg, by extrapolating the straight portion of (αhν)2 against hν plot to the point α = 0, intersecting the x-axis as shown in Fig. 6b. The values of the band gap determined for sample S1, S2, S3, S4, S5 and S6 are found 1.77, 1.82, 1.96, 2.08, 2.14 and 2.25 eV, respectively. The band gap of Bi1-xCaxFe1-xTixO3 nanoparticles increases linearly from 1.76 to 2.25 eV with increase Ca and Ti co-substitution (as shown in Fig. 6c). A similar increase in the band gap was observed earlier in yttrium doped BiFeO3 nanoparticles [31] and is 11
also supported by the first-principle calculations [32]. This small band gap range of Bi1-xCaxFe1xTixO3
nanoparticles indicates a possibility of utilizing more visible light for photocatalytic
activities.
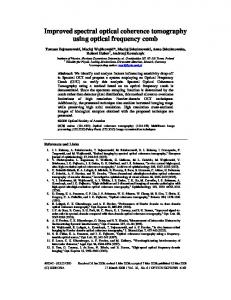
To examine the magnetic behavior of as-synthesized Bi1-xCaxFe1-xTixO3 nanoparticles at roomtemperature, magnetic measurements were carried out on these samples using a physical property measurement system (PPMS). Fig.7 shows the variation in magnetization (M) as a function of the applied magnetic field (H) with a maximum H of ± 5 T for Bi1-xCaxFe1-xTixO3 samples S1, S2, S3, S4, S5, and S6, respectively while the derived magnetic parameters are summarized in Table I. As evident from Fig.7 and table 1, the magnetic response observed for as-synthesized nanoparticles of Bi1-xCaxFe1-xTixO3 exhibit improved magnetization suggesting that the spiral spin structure of BiFeO3 gets suppressed with increasing doping of Ca and Ti and may be destroyed completely for S5. As a result, the remnant magnetization Mr values increases gradually from S1 to S5 and shows maximum value Mr ≤ 0.112 emu/g for S5. The observed magnetic behaviour in Bi1-xCaxFe1-xTixO3 nanoparticles may have a number of contributions [33] such as (i) the magnetization increases because Ca and Ti co-substitution in BFO suppresses the spin cycloid to release the latent magnetization; (ii) the large surface to volume ratio of nanoparticles may enhance the magnetization because of the increase in spin canting at the surface of nanoparticles; (iii) the magnetization may decrease with the decrease in oxygen octahedra tilt angle because it decreases the Dzyaloshinky–Moriya interaction which is responsible for the spin canting, and
(iv) the magnetization may also decreases with
nonmagnetic Ca and Ti substitutions as these substitutions break the magnetic superexchange interaction among the Fe3+ cations. As shown in table 1, the remnant magnetization (Mr) increases from S1 to S5 because of the dominant contribution from the first two factors over last 12
two while it decreases for S6 due to dominance of the last two factors over the first two as discussed above.
Conclusions Single-crystalline Bi1-xCaxFe1-xTixO3 nanoparticles were successfully synthesized by sol-gel in the compositional range wherein 0 ≤ x ≤ 0.25. The crystalline nature, structure and morphology of as-synthesized nanoparticles were studied by XRD and TEM. Optical study shows that the band gap of Bi1-xCaxFe1-xTixO3 nanoparticles increases 1.77 to 2.25 eV as x increased from 0 to 0.25, indicating their usefulness as a photocatalysts. Our magnetic measurement results show the improved magnetic behavior by releasing the latent magnetization from melting of the spin cycloid. The optical and magnetic results of Bi1-xCaxFe1-xTixO3 nanoparticles indicate that these nanostructures may be used for data storage, spintronics and optoelectronics.
Acknowledgement We acknowledge the Advanced Instrumentation Research Facility (AIRF) and School of Physical Sciences, JNU, New Delhi for extending the characterization and measurement facilities. S. Singh acknowledges the Department of Science and Technology (PURSE-II) and University Grants Commission (Project # 33, UPE-II), Government of India for financial support. V. Kumar acknowledges the award of the junior research fellowship of UGC, India.
13
References [1]. H. Schmid, Multi-ferroic magnetoelectrics, Ferroelectrics, 162 (1994) 665-685. [2]. M. Fiebig, Revival of the magnetoelectric effect, J. Phys. D: Appl. Phys. 38 (2005) R123R152. [3]. W. Eerenstein, N. D. Mathur, J. F. Scott, Multiferroic and magnetoelectric materials, Nature. 442 (2006) 759- 765. [4]. G. Catalan, J. F. Scott, Physics and Applications of Bismuth Ferrite, Adv. Mater. 21 (2009) 2463-2485. [5]. R. Ramesh, N. A. Spaldin, Multiferroics: progress and prospects in thin film, Nat. Mater. 6 (2007) 21- 29. [6]. N. A. Spaldin, S.-W. Cheong, R. Ramesh, Multiferroics: past, present and future, Phys. Today. 63 (2010) 38-43. [7]. W. Kaczmarek, Z. Pajak, Differential thermal analysis of phase transitions in (Bi1-xLax)FeO3 solid solution, Solid State Commun. 17 (1975) 807- 810. [8]. D. Khomskii, Classifying multiferroics: Mechanisms and effects, Physics. 2 (2009) 20. [9]. J. T. Heron, D. G. Schlom, R. Ramesh, Electric field control of magnetism using BiFeO3based heterostructures, Appl. Phys. Rev. 1 (2014) 021303. [10]. A. Singh, A. Senyshyn, H. Fuess, S. J. Kennedy, D. Pandey, Magnetic transitions and sitedisordered induced weak ferromagnetism in (1-x)BiFeO3-xBaTiO3, Phys. Rev. B. 89 (2014) 024108. [11]. A. Singh, V. Pandey, R. K. Kotnala, D. Pandey, , Direct Evidence for Multiferroic magnetoelectric Coupling in 0.9BiFeO3–0.1BaTiO3, Phys. Rev. Lett. 101 (2008) 247602.
14
[12]. T. J. Park, G. C. Papaefthymiou, A. J. Viescas, Y. Lee, H. Zhou, S. S. Wong, Compositiondependent magnetic properties of BiFeO3-BaTiO3 solid solution nanostructures, Phys. Rev. B. 82 (2010) 024431. [13]. C. Ederer, N. A. Spaldin, Weak ferromagnetism and magnetoelectric coupling in bismuth ferrite, Phys. Rev. B. 71 (2005) 060401. [14]. P. Kumar, M. Kar, Effect of structural transition on magnetic and optical properties of Ca and Ti co-substituted BiFeO3 ceramics, J. Alloy Compd. 584 (2014) 566–572. [15]. D. Haiyang, C. Zhenping, L. Tao, L. Yong, Microstructure and properties of Sm-substituted BiFeO3 ceramics, J. Rare Earth. 30 (2012) 1123–1128. [16]. V.R. Reddy, D. Kothari, A. Gupta, S.M. Gupta, Study of weak ferromagnetism in polycrystalline multiferroics Eu doped bismuth ferrite, Appl. Phys. Lett. 94 (2009) 082505. [17]. V.A. Khomchenko, D.A. Kiselev, J.M. Vieira, L. Jian, A.L. Kholkin, Effect of diamagnetic Ca, Sr, Pb, and Ba substitution on the crystal structure and multiferroic properties of the BiFeO3 perovskite, J. Appl. Phys. 103 (2008) 024105. [18]. F.Z. Qian, J.S. Jiang, S.Z. Guo, D.M. Jiang, W.G. Zhang, Multiferroics Properties of Bi1xDyxFeO3
nanoparticles, J. Appl. Phys. 106 (2009) 084312.
[19]. G. Catalan, K. Sardar, N. S. Church, J. F. Scott, R. J. Harrison, and S. A. T. Redfern, Effect of chemical substitution on the Néel temperature of multiferroic Bi1−xCaxFeO3, Phys. Rev. B. 79 (2009) 212415. [20]. V. A. Khomchenko, D. A. Kiselev, E. K. Selezneva, J. M. Vieira, A. M. L. Lopes, Y. G. Pogorelov, J. P. Araujo, A. L. Kholkin, Weak ferromagnetism in diamagnetically-doped Bi1 xAxFeO3
(A = Ca, Sr, Pb, Ba) multiferroics, Mater. Lett. 62 (2008), 1927-1929.
15
−
[21]. I. O. Troyanchuk, N. V. Tereshko, A. N. Chobot, M. V. Bushinsky, K. Barner, Weak ferromagnetism in BiFeO3 doped with titanium, Physica B. 404 (2009) 4185- 4189. [22]. M. Kumar, K. L. Yadav, Study of room temperature magnetoelectric coupling in Ti substituted bismuth ferrite system, J. Appl. Phys. 100 (2006) 074111 [23]. Q. Q. Wang, H. J. Zhao, X. M. Chen, Low-temperature dielectric behavior of BiFeO3modified CaTiO3 incipient ferroelectric ceramics, J. Appl. Phys. 111 (2012) 126101 [24]. Reetu, A. Agarwal, S. Sanghi, Ashima, N. Ahlawat, Improved dielectric and magnetic properties of Ti modified BiCaFeO3 multiferroic ceramics, J. Appl. Phys. 113 (2013) 023908. [25]. S. Singh, S. B. Krupanidhi, Perovskite phase transformation in 0.65Pb(Mg1/3Nb2/3)O30.35PbTiO3 nanoparticles derived by sol-gel, J. Appl. Phys. 111 (2012) 024314. [26]. R. Palai, R.S. Katiyar, H. Schmid, P. Tissot, S.J. Clark, J. Robertson, S.A.T. Redfern, G. Catalan, J.F. Scott, β-phase and γ-β metal-insulator transition in multiferroic BiFeO3, Phys. Rev. B. 77 (2008) 014110. [27]. D.V. Karpinsky, I.O. Troyanchuk, J.V. Vidal, N.A. Sobolev, A.L. Kholkin, Enhanced ferroelectric, magnetic and magnetoelectric properties of Bi1−xCaxFe1−xTixO3 solid solutions, Solid State Commun. 151 (2011) 536–540 [28]. A. Weibel, R. Bouchet, F. Boulc’h, P. Knauth, The Big Problem of Small Particles: A Comparison of Methods for Determination of Particle Size in Nanocrystalline Anatase Powders, Chem. Mater. 17 (2005) 2378-2385 [29]. M. Muneeswaran, P. Jegatheesan, M. Gopiraman, I. S. Kim, N.V. Giridharan,Structural, optical, and multiferroic properties of single phased BiFeO3, Appl Phys A. 114 (2014) 853–859.
16
[30]. P. S. V. Mocherla, C. Karthik, R. Ubic, M. S. R. Rao, and C. Sudakar, Tunable bandgap in BiFeO3 nanoparticles: The role of microstrain and oxygen defects, Appl. Phys. Lett. 103 (2013) 022910. [31]. A. Mukherjee, S. M. Hossain, M. Pal, S. Basu, Effect of Y-doping on optical properties of multiferroics BiFeO3 nanoparticles, Appl. Nanosci. 2 (2012) 305–310. [32]. Z. Zhang, P. Wu, L. Chen, J. L. Wang, Systematic variations in structural and electronic properties of BiFeO3 by A-site substitution, Appl. Phys. Lett. 96 (2010) 012905. [33]. V. Mishra, V. Kumar, S.Singh, Structural, optical and magnetic properties of multiferroic (1−x)BiFeO3 - xPbTiO3 nanoparticles, J. Alloy Compd. (2015), 10.1016/j.jallcom.2016.04.122.
17
Figure Caption Fig.1. XRD profiles of Bi1-xCaxFe1-xTixO3 nanoparticles for x = 0 (S1), 0.05 (S2), 0.10 (S3), 0.15 (S4), 0.20 (S5) and 0.25 (S6), respectively. Fig. 2. XRD profiles showing the shifting in the highest intensity peak of Bi1-xCaxFe1-xTixO3 nanoparticles for x = 0 (S1), 0.05 (S2), 0.10 (S3), 0.15 (S4), 0.20 (S5) and 0.25 (S6), respectively. Fig. 3. Williamson Hall plot for Bi1-xCaxFe1-xTixO3 nanoparticles with x = 0 (S1), 0.05 (S2), 0.10 (S3), 0.15 (S4), 0.20 (S5) and 0.25 (S6), respectively. Fig.4. (a-b) TEM micrographs of an individual nanoparticle and randomly oriented nanoparticles of the samples S3 and S4, respectively, The inset of (a) shows the SAED pattern of an individual nanoparticle of sample S3, (c) SAED pattern of randomly oriented nanoparticles of sample S4, (d-e) HRTEM images of S3 and S4, respectively. Fig. 5. EDX profile of Bi1-xCaxFe1-xTixO3 nanoparticles for x = 0.10. Fig. 6. (a) UV-visible absorption spectra and (b) Tauc’s plots to determine the band gap of the Bi1-xCaxFe1-xTixO3 nanoparticles for x = 0 (S1), 0.05 (S2), 0.10 (S3), 0.15 (S4), 0.20 (S5) and 0.25 (S6), respectively (c) Variation of band gap with x for Bi1-xCaxFe1-xTixO3 nanoparticles. Fig.7. M-H plots for Bi1-xCaxFe1-xTixO3 nanoparticles for x = 0 (S1), 0.05 (S2), 0.10 (S3), 0.15 (S4), 0.20 (S5) and 0.25 (S6) respectively. The insets (S1 to S6) depict magnified plot.
18
Table 1: Derived magnetic parameters from M-H plot of Bi1-xCaxFe1-xTixO3 nanoparticles at room temperature. Mr stands for remnant magnetization. Hc represents the derived coercivity. Ms is the magnetization observed at H = 5 T. Mr
Hc
Ms
(emu/g)
(Tesla)
(emu/g)
S1
0.048
0.018
0.583
S2
0.077
0.551
0.501
S3
0.088
0.635
0.554
S4
0.096
0.468
0.619
S5
0.112
0.528
0.634
S6
0.076
0.449
0.617
19