Lisandro Lovisolo & Renata C. C. de Souza
Improvement of Objective Image Quality Evaluation Applying Colour Differences in the CIELAB Colour Space
[email protected]
Lisandro Lovisolo FEN/DETEL-PEL Universidade do Estado do Rio de Janeiro Rio de Janeiro, Brazil
[email protected]
Renata C. C. de Souza FEN/DETEL-PEL Universidade do Estado do Rio de Janeiro Rio de Janeiro, Brazil
Abstract Objective full-reference image quality algorithms are often designed considering the luminance component of images. In this work perceived colour distance is employed in a simple and functional way in order to improve these full-reference image quality algorithms. The difference between colours in the CIELAB colour space is employed as perceived colour distance. This quantity is used to process images that are to be feed to full-reference image quality algorithms. This image processing stage consists of identifying the image regions or pixels that are expected to be perceived identically by a human observer in both the reference image and the image having its quality evaluated. In order to verify the validity of the proposal, objective scores are compared with subjective ones for public available image databases. Despite being a very simple strategy, the proposed approach was effective to improve the agreement between subjective and the SSIM (Structural Similarity Index Metric) objective score. Keywords: Image Quality Evaluation, Color Spaces.
1. INTRODUCTION Great part of image quality evaluation metrics has been proposed to evaluate achromatic images. This has occurred mainly due to the fact that the spatial resolution of the HVS (Human Visual System) is better for the achromatic (L) channel than for color channels [1]. However, the majority of image applications deal with colorful and not achromatic images. As image capture devices and displays are climbing to a new level (higher luminance, higher contrast ratio, and wider color gamut [2]), the role of color in the ambit of image quality and rendering is growing [2]. The most reliable way of assessing image quality is by means of subjective evaluation, since human observers are the ultimate receivers in most applications [1]. The Mean Opinion Score (MOS) is a reliable and widely used method for subjective quality evaluation obtained from a number of observers [1]. However, for most applications, this method is inconvenient, as it cannot be used in real-time. Due to that, image quality evaluation metrics have been developed. There are different kinds of objective image quality metrics, in this work one considers full-reference metrics, for which both the distorted image (the one to be evaluated) and the original one (reference image) must be available. Visual image systems work defining color in three dimensional spaces like the RGB, YCbCr, Lab, etc, [3]. While objective metrics are often defined and optimized for the luminance component, there are some previous work that have combined quality scores in the three different color channels of an image for providing one score that is more closely related to subjective ones [4]. A different approach is followed. One focuses on improving the objective evaluation of color images that is provided by traditional full-reference objective metrics that were developed considering just
International Journal of Image Processing (IJIP), Volume (5) : Issue (3) , 2011
236
Lisandro Lovisolo & Renata C. C. de Souza
image luminance. The main idea is to process the image to be evaluated before it is actually fed to the objective evaluation system, aiming at obtaining an objective score that is more close to the subjective one. The improvement is achieved, by using the concept of Just Noticeable Difference (JND) between colors [3]. The JND concept comes from the definition of the CIELAB color space [3] which is defined with a perceptually uniform measure for color differences in mind [3]. This color space was established by the CIE (Commission internationale de l'éclairage) based on MacAdam’s Ellipses theory [5]. The area inside each ellipse (defined in the XYZ chromaticity diagram) includes all colors that are visually identical to the color in the ellipse’s center. The ellipses radii are known as just noticeable differences (JND) and were translated into the CIELAB color space such that the Euclidean distance between color coordinates provides an approximation to the perceived difference between colors [3]. The colour differences in the CIELAB colour space are employed to compare and process distorted images with original ones before actually feeding the images as input in full-reference objective metric algorithms. The proposed approach is evaluated for the Structural Similarity Index Metric (SSIM) [6], a full-reference (FR) image quality metric.
2. COLOUR DIFFERENCES ANALYSIS AS PREPROCESING FOR IMAGE QUALITY EVALUATION 2.1 CIELAB Color Space Each one of the three coordinates of the CIELAB color space – L*, a* and b* – represent, respectively the color luminance, the position between red/magenta and green and the position between yellow and blue. To calculate the L*a*b* coordinates from the RGB color space one applies [7]:
L* = 116 f (Y / Yn ) a* = 500[ f ( X / X n ) − f (Y / Yn )] ,
(1)
b* = 200[ f (Y / Yn ) − f (Z / Z n )] where
f (t ) =
t
1/ 3
,
6 for t > 29 2t
2
.
(2)
1 29 4 + , otherwise 3 6 29
In (2) Xn, Yn, Zn, are the CIE XYZ tristimulus values of the white reference and X,Y,Z are related to the RGB color space through the following equation [7]:
0.49 0.31 0.20 X R 1 Y = 0.17697 0.17697 0.81240 0.01063 G . Z B 0.00 0.01 0.99
International Journal of Image Processing (IJIP), Volume (5) : Issue (3) , 2011
(3)
237
Lisandro Lovisolo & Renata C. C. de Souza
2.2 Color Difference The color difference between correspondent pixels in the reference and the distorted images can be defined in the L*a*b* space as [3,5]
∆E =
(L *1 − L *2 )2 + (a *1 −a *2 )2 + (b *1 −b *2 )2 ,
(4)
where (L*1,a*1,b*1) and (L*2,a*2,b*2) are two different colors in the CIELAB color space. L*, a* and b* are the three coordinates of the space and represent, respectively, the color luminance, the position between red/magenta and green, and the position between yellow and blue. Once one computes these differences between all the pixels in the reference and distorted images one generates a map of differences. In this work it is proposed to use the map of differences to identify the regions where the difference in color is perceptually indistinguishable by human vision, that is, pixels for which their ∆E are below the JND (Just Noticeable Difference). This map is used to replace the regions in the distorted image that are indistinguishable with respect to the original one by correspondent regions in the original one. This way, a modified, i.e. processed, distorted image is obtained, which is to be fed to the objective metric. The motivation is that if the color difference in a region cannot be perceived, then for the human eye in this region the distorted image is indistinguishable from the reference image and shall not impact the objective metric. 2.3 Applying the Color Difference Once one identifies the regions where the color difference between the original image and the distorted image are below a given threshold value, the pixels of the distorted image are substituted by the ones in the original image. Define the color of pixel i in the original image as (L*o,i, a*o,i, b*o,i) and in the distorted image as (L*d,i, a*d,i , b*d,i). Then, for a given pixel i If ∆Ei < threshold then (L*d,i, a*d,i , b*d,i) ← (L*o,i, a*o,i, b*o,i).
(5)
This process is illustrated in Figure 1. After this color-space processing stage, the full-reference objective metric is computed considering the original and the modified distorted image. Similar ideas for quality assessment of colour images or videos exist in the literature. In [8] the inclusion of psycho visual models after processing and transforming the images is employed. In [9] some effects of the human visual system are applied independently on the reference and distorted image previous to image comparisons. In [4] quality scores for the different colour channels of an image are combined into a single score. Our work is much simpler and differs from these as it tries to include the influence of color on image quality in the pixel domain. It is not intended as an imagequality metric but it aims at improving the results obtained with other metrics.
3. EXPERIMENTS One aims at evaluating if the application of the JND concept (if considering that the difference in colors is not noticeable, as the processing stage described in the previous section) is able to improve the similarity between objective and subjective scores for the distorted images. For that purpose it is investigated if the objectives scores obtained for the processed images have a larger correlation with and a smaller difference to the subjective scores than the ones obtained for the original distorted images, i.e., without the proposed processing stage. This strategy follows the recommendations for the evaluation of objective quality metrics [10].
International Journal of Image Processing (IJIP), Volume (5) : Issue (3) , 2011
238
Lisandro Lovisolo & Renata C. C. de Souza
FIGURE 1 – Image processing for improving its quality analysis by full-reference image-quality metrics. 3.1 Materials Employed As exposed above, in order to evaluate an objective quality metric, a subjective database is welcomed. In subjective image quality databases, distorted images are presented to human subjects that grade the quality of the images accordingly to some prescribed criteria. For the results presented here, two databases were used: the LIVE subjective database [11] containing 808 images (29 reference images and 779 distorted images) and the correspondent DMOS (Difference Mean Opinion Score), and IVC database [12] containing 120 distorted images from 10 reference images and their MOS. 3.2 Objective Metric To evaluate the proposed image processing stage it is employed as objective metric the SSIM [6]. The SSIM is designed assuming that people evaluate impairments between images by perceiving their structural information such as mean, variance, and covariance of intensity values in regions of the reference and the distorted images. As it is depicted in Figure 1, in the proposed approach, the calculation of SSIM considers the channel L* (luminance in the L*a*b* space). As the JND does not assume an exact value for all applications and viewing conditions [13], experiments were held in a set of threshold values ranging from 0 (meaning results without using the proposed approach) to 7 in steps of 0.2. 3.3 Methodology Employed for Evaluation of the Results The problem one must deal now is how to compare the results obtained by two different objective metrics. Since visual human system inspired metrics as the SSIM try to mimic the subjective evaluation, one should evaluate how close the objective scores with respect to subjective one are. For that purpose, two “metrics of similarity” between the objective and subjective scores were employed. The Pearson Correlation between objective and subjective scores and the RMSE (Root Mean Squared Error) between the same are calculated to evaluate the performance of the proposal. A nonlinear mapping of the subjective scores to the objective notes is made prior to
International Journal of Image Processing (IJIP), Volume (5) : Issue (3) , 2011
239
Lisandro Lovisolo & Renata C. C. de Souza
these calculations, following the methodology used by the VQEG (Video Quality Experts Group) [10]. The Pearson correlation is given by N
∑ (subj R=
n
− subj )(objn − obj )
n=1 N
∑ (subj
.
N
2
n
− subj ) ∗
n=1
∑ (obj
(6)
2
n
− obj )
n=1
Where, subjn and objn are respectively the subjective and objective scores of a given image n in a set of N images and subj and obj are the mean of the subjective and objective scores for the N images. The Pearson correlation is commonly used to evaluate how close the objective metric is to the subjective score [10]. The RMSE is computed using
RMSE =
1 N
N
∑ (subj
2
n
− objn ) .
(7)
n=1
The RMSE analyzes the precision of the objective metric. While the correlation can be employed to compare the behavior of one metric with respect to the other, one employs the RMSE to evaluate how far the results provided by the objective metric are to the image quality scores obtained in subjective tests.
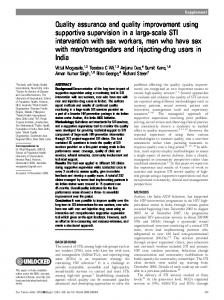
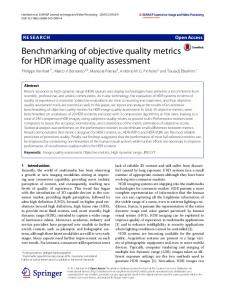
4. RESULTS The correlation and RMSE between SSIM and the subjective scores for different thresholds used in the colors comparisons for both LIVE and IVC databases are shown respectively in Figures 2 and 3 in black continuous line. The upper graphs in those figures show the correlation between the objective and subjective qualities indexes for threshold values ranging between 0 and 7. The graphs in the bottom present the RMSE between these scores. Note that a threshold equal to zero actually represents that the proposed image processing approach is not used prior to objective quality evaluation. In order to evaluate the consistence of the proposed approach, the databases were divided into subsets of images. These subsets divide the IVC database into four groups and the LIVE database into five groups in a random manner. This was applied three times, so that 12 subsets for IVC database and 15 subsets for LIVE database were defined. For these subsets correlation and RMSE were also calculated (using equations (6) and (7), respectively) and are shown in Figure 2 and 3 in dashed blue lines. One shall highlight the shapes of the curves, which follow a consistent pattern, showing hills in the correlation graphs and valleys in the RMSE graphs for intermediate threshold values. Although these ranges are different for the two databases, this difference is expected due to the different conditions in which the subjective scores were obtained, the observed patterns attest the effectiveness of the proposed approach for improving color image objective evaluation.
International Journal of Image Processing (IJIP), Volume (5) : Issue (3) , 2011
240
Lisandro Lovisolo & Renata C. C. de Souza
FIGURE 2 – Results of objective image quality obtained with the proposed approach for LIVE Database.
FIGURE 3 – Results of objective image quality obtained with the proposed approach for IVC Database. Table 1 shows a synthesis of the results obtained. In Table 1, are presented the improvements obtained using the proposed approach with respect to not using it. It shall be highlighted that the improvements in the SSIM for the LIVE database are smaller than the ones obtained for the IVC. However, SSIM and LIVE are both originated from the same research group and the constants used in the SSIM were tuned using the LIVE database. However, one should observe that regardless the database, and regardless if one considers the whole database or a subset of it, one observes that adjusting the value of the threshold considered to compare color differences affords a gain in the correlation between SSIM and the subjective metric. In addition, the RMSE is minimized at the same threshold value.
International Journal of Image Processing (IJIP), Volume (5) : Issue (3) , 2011
241
Lisandro Lovisolo & Renata C. C. de Souza
Threshold IVC Correlation Improvement regarding JND=0 Threshold LIVE Correlation Improvement regarding JND=0
0 0,82 0 0,86 -
2,8 0,88 7,22% 1,2 0,87 0,60%
TABLE 1: Comparison between correlations using JND for SSIM.
5. CONCLUSION In this work, we used the difference between colors computed in the CIELAB color space in the context of objective image quality evaluation. It was proposed to use this difference for identifying the regions where both the original and distorted images are indistinguishable. Once this is done, we substitute these regions in the distorted images by the correspondent ones in the original one before feeding the images to a full-reference metric algorithm. The proposed method is simple, and only requires some additional preprocessing before the image pair (original and distorted) is sent to the calculation of the objective metric. Experiments using different subjective image quality public available databases have demonstrated that this approach improves the results for the SSIM full-reference image quality evaluation metric.
6. REFERENCES [1]
Z. Wang, H. R. Sheikh and A. C. Bovik, The Handbook of Video Databases: Design and Applications, 2nd ed., Boca Raton, FL, USA. CRC Press, 2003.
[2]
T. Fujine, T. Kanda, Y. Yoshida, Y., M. Sugino, M. Teragawa, Y. Yamamoto, and N. Ohta, N.;, “Bit-Depth Needed for High Image Quality TV-Evaluation Using Color Distribution Index,” Journal of Display Technology, vol. 4, no. 3, pp. 340–347, Sep. 2008.
[3]
G. Wyszecki and W. S. Stiles. Color Science: Concepts and Methods, Quantitative Data and Formulae. 2nd. ed. John Wiley & Sons, New York, USA, 1982.
[4]
A Toet and M.P. Lucassen, “A New Universal Color Image Fidelity Metric”, Displays, vol 24, no 4-5, pp 197-207. 2003.
[5]
D. L. MacAdam, “Specification of small chromaticity differences in daylight,” Journal of the Optical Society of America, vol. 33, no. 1, Jan. 1943.
[6]
Z. Wang and A.C. Bovik ., “Image Quality Assessment: From error visibility to structural similarity,” IEEE Trans. Image Processing, vol. 13, no. 4, pp. 600–612, Apr. 2004.
[7]
J. Schanda, Colorimetry: Understanding the CIE System, Wiley-Interscience, 2007.
[8]
J. Lubin, “A visual discrimination model for imaging system design and evaluation”, in E. Peli (ed.), Vision models for target detection and recognition, World Scientific Publishing, Singapore, 1995.
[9]
S. Daly. The visible difference predictor: An algorithm for the assessment of image fidelity, Proc. SPIE Conference on Human Vision and Electronic Imaging XII, p. 2. 1992.
[10] VQEG. Final Report from the Video Quality Experts Group on the Validation of Objective Models of Video Quality Assessment, Phase II. [Online] http://www.vqeg.org/, Aug. 2003.
International Journal of Image Processing (IJIP), Volume (5) : Issue (3) , 2011
242
Lisandro Lovisolo & Renata C. C. de Souza
[11]
H.
R.
Sheikh,
et
al.
LIVE Image Quality Assessment
Database Release 2,
http://live.ece.utexas.edu/research/quality, 2009. [12] P. Le Callet and F. Autrusseau. Subjective Quality Assessment IRCCyN/IVC Database, http://www.irccyn.ec-nantes.fr/ivcdb,, 2005. [13] M. Melgosa, M. M. Pérez, A. Yebra, R. Huertas and E. Hita, “Some reflections and recent international recommendations on color-difference evaluation”, Óptica Pura y Aplicada, vol. 34, 2001.
International Journal of Image Processing (IJIP), Volume (5) : Issue (3) , 2011
243