attribute values. Generally speaking, the classification task can be divided into several types; these are namely: Binary classification,. Multi-class classification,.
(IJACSA) International Journal of Advanced Computer Science and Applications, Vol. 6, No. 7, 2015
Improvement on Classification Models of Multiple Classes through Effectual Processes Tarik A. Rashid Software Engineering, College of Engineering, Salahadin University, Halwer, Kurdistan
Abstract—Classify cases in one of two classes referred to as a binary classification. However, some classification algorithms will allow, of course the use of more than two classes. This research work focuses on improving the results of classification models of multiple classes via some effective techniques. A case study of students’ achievement at Salahadin University is used in this research work. The collected data are pre-processed, cleaned, filtered, normalised, the final data was balanced and randomised, then a combining technique of Naïve Base Classifier and Best First Search algorithms are used to ultimately reduce the number of features in data sets. Finally, a multi-classification task is conducted through some effective classifiers such as KNearest Neighbor, Radial Basis Function, and Artificial Neural Network to forecast the students’ performance. Keywords—Non-Balanced Data; Feature Selection; Multiple Classification; Machine Learning Techniques; Student Performance Forecasting
I.
INTRODUCTION
Classification is a data mining technique that maps data into groups. It is a supervised learning method which requires labeled training data to generate rules for classifying test data into predetermined classes [1]. It is a two-phase process. The first phase is the learning phase, where the training data is analysed and classification rules are generated. The next phase is the classification, where test data is classified into classes according to the generated rules. Since classification algorithms require that classes be defined based on data attribute values. Generally speaking, the classification task can be divided into several types; these are namely: Binary classification, Multi-class classification, Multi-label classification and Multi-output-multiclass classification and multi-task classification. The binary classification algorithms can be converted into multinomial classifiers by several strategies. The four diffident types of classification are described as follows [2-5]:1) Binary classification type: it means a classification task that can have no more than two classes. 2) Multiple classes’ classification type: it is a classification task with more than two classes; in the field of classification, multi-class or multi-nominal classification is the problem of classifying instances into one of more than two classes. For instance, classifying a group of items of tools which may be electrical or computer or construction. Multiple classes’ classification makes the assumption that each sample is allocated to one and only one label. Multi-class
classification should not be mixed up with multi-label classification, where multiple labels are to be predicted for each instance. 3) Multi-label classification: this type is about allocating to each sample a set of target labels. This is seen as the forecasting attributes of a data item that are not happening at the same time, as themes that are relevant to a document. For example, an ordinary manuscript can fall into a belief, legislation, economics and learning all at once or fall into none of them at all. 4) Multi-Output-multi-class classification and multi-task certification: it means that a single appraiser has to work out some common classification tasks. This is a generalisation of the multi-label classification task, in which, the set of the classification problem is limited to binary classification and of the multi-class classification task. This means that each classifier handles multi-output multi-class or multi-task classification task supports the multi-label classification task as a distinctive example. Multi-task classification sounds like the multi-output classification task with different model formulations. This work focuses on multiple classes’ classification type and it takes students achievement model for classification as a case study, this is because, in recent time, a new phenomenon of increasing demand by students for pursuing further studies is emerged in universities in Kurdistan. This is due to the rapid economic growth and increasing technologies that have a greater impact on our lives in general and in the educational system, in particular. Thus, examining the past performance of the admitted students would provide a stronger perspective of the likely educational achievements of scholars in the future. This may very well be achieved through the concepts of data mining and machine learning [6]. Naturally, any quality of education at the university is found in its analysis work and educational activities, so it is, therefore, appropriate to mention that the amount of accepted students affect the level of the classes may have [6, 7]. It is very useful for any learning system to have the right student performance of the system itself. The right student performance of the system makes the body staff ready to recognise between the accepted and not accepted candidate students for an educational course or subject. It is hence, important to make a correct prediction or to conduct the right assortments of student achievement, in order to help improve the level of involvement of academic staff for students learning. Also facilitating more help to support students and
55 | P a g e www.ijacsa.thesai.org
(IJACSA) International Journal of Advanced Computer Science and Applications, Vol. 6, No. 7, 2015
provide guidance resources or may be the teachers are able to determine what the most satisfactory teaching jobs will be for each bunch of students, plus teachers deliver their assistance through made-to-order substantive materials to students. The power of predicting the learning performance of students is very significant for academic institutions. It is worth noticing that the goal can also be achieved by the use of machine learning and data mining techniques. These techniques have a great ability to process enormous data to discover and extract hidden patterns and important relationships that are very useful for decision making [6, 7]. This paper focuses on the use of a combination technique of Naïve Base and Best First Search algorithms as a proposed technique for feature reduction to enhance the performance of the classification techniques, which are used for predicting students’ achievement. The paper is structured as follows: in Section 2, related works are explained. Then, the description of the overall forecasting system is demonstrated. Next, in Section 4, the process of data collection is described. Then after, data preprocessing, and data preparation are defined. In Section 6, the feature selection techniques are explained. In Section 7, the multi-class classification techniques are designated and described. Section 8, describes different experimental results, and finally, the main points in this paper work are outlined. II.
RELATED WORKS
Data mining is the process of discerning interesting knowledge via predicting, classifying, associating, or changing important structures and abnormalities of large amounts of data stored in databases, data warehouses and other information repositories [1, 8]. Data mining has been widely used in recent years with the availability of large amounts of data in electronic form, and there is a need to turn the stored data into useful information and knowledge for large applications. It is worth mentioning that data mining techniques that are supported by machine learning and soft computing techniques are the creation of a new research area called educational data mining to university levels, authors in [9-11] stated that new and useful knowledge about students can be detected by the application of data mining in education. These applications are found in areas such as artificial intelligence, machine learning, market analysis, statistics, database systems, business, management and decision support [1, 9]. Authors in [12] suggested that techniques for exploring the types of data from educational institutions can be developed through educational data mining. There are several practices of
data mining, examples of these statistics, visualization, clustering, and revealing outliers, included in this, classification, which is one of the most studied techniques. Classification can possibly acquire a method of control where information is separated into completely different categories. Classification maps information into pre-arranged groups of types. The main objective of a classification model is to consider the target class for each sample in the dataset. There are numerous techniques for classification of any data, which are namely; support vector machine (SVM), artificial neural network (ANN) and Bayesian classifier [12]. Based on these techniques, the classification task can be performed by describing and distinguishing data categories. Basically, these classification techniques are often used in educational settings in several research works as indicated in [13-17]. In addition, authors in [18] have dealt with another aspect which is an unbalanced knowledge or so-called having a different sampling number for each class. This can be a difficult undertaking. The non-balanced data will cause limitations when training classification algorithms, eventually, it will have a negative influence on the performance of the system. This research work suggests two effectual processes so that to overcome the problem of non-balanced data, these two processes are resampling and randomised, in addition to these, the research work proposes a mutual technique for feature reduction so that to improve the performance of the classification models of multiple classes such as ANNs, KNearest Neighbor, and Radial Basis Function. III.
THE OVERALL FORECASTING SYSTEM
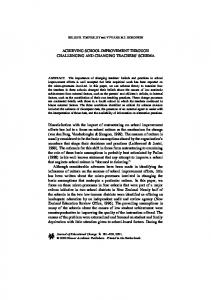
The suggested overall forecasting system for the students’ performance consists of three mains parts (See Figure 1), and these are as follows: 1) Data Collection 2) Data Preprocessing & Preparation a) Cleaning, normalising, scaling b) Non-Balanced Data c) Re-Sampling d) Randomised Data 3) Feature Selection a) Classification b) Selecting the best group 4) Multi-Classification a) Classification model b) Selecting the best model
56 | P a g e www.ijacsa.thesai.org
(IJACSA) International Journal of Advanced Computer Science and Applications, Vol. 6, No. 7, 2015
two specific processes namely; Data Re-Sampling and Data Randomisation. A. Cleaning, normalising, scaling Initially, the real data of 1000 students have been collected. The data have been cleaned by identifying the parameters used in the data analysis and the missing data are either eliminated or filled. After cleaning phase, nearly 300 records met the requirements of this research work. B. Data re-sampling The collected data has six classes or labels as mentioned earlier, these are; Excellent, Very Good, Good, Fair, Pass, and Fail. The numbers of samples for classes are shown in Table 1. TABLE I.
Fig. 1. This figure shows the overall forecasting system for students’ performance
IV.
DATA COLLECTION
The data is collected from Salahadin University, practically from Colleges of Engineering, Science, and Education. The data mainly refers to the performance of students throughout the academic year. The collection of data can have certain variables such as the gender of the student, the age of the student, the student’s personal address, the education level of both parents of the student, the address of high school , the type of high school, the instruction language of the high school, the overall score on the national examination for the student, English score on the national exam, the type of English tutor, the score of the student in English Module for the first year in both the departmental and general college tests at the start of the course. The output variables are values for English module grade for the student at the end of the year, this is again a general college test, and also, the output values can either be excellent or very good or good or fair or pass or fail. V.
Class Type
The number of Samples
Excellent Very Good Good Fair Pass Fail
104 66 55 30 19 13
It is worth mentioning that researchers recently have been fascinated by the problem of learning from unbalanced knowledge as shown in Table 1 (the table shows different sampling quantity for each class), which could be rationally a fresh test for researchers. The unbalanced learning of data is regarded as a key drawback which can have a negative impact on the performance of learning algorithms. As a result of the essential problematical attributes of unbalanced knowledge or data sets, learning from such knowledge or data sets requires firsthand considerations, values, processes, tools and technologies so that to rework a larger amounts of data with efficacy into useful information and knowledge [18]. Weka software is a great tool which uses attractive and easy means of constructing samples. It basically requests for a sample size percentage with random seed and uses a precise easy process. The following snippet code shows the resampling method:private void createSubsample() { int origSize = getInputFormat().numInstances(); int sampleSize = (int) (origSize * m_SampleSizePercent / 100); Random random = new Random(m_RandomSeed); for(int i = 0; i < sampleSize; i++) { int index = random.nextInt(origSize); push((Instance)getInputFormat().instance(in dex).copy()); }
DATA PRE-PROCESSING AND DATA PREPARATION
The data preparation and preprocessing techniques are used to enhance the predicting performance of the system. This research work has focused on some particular cleaning, normalising, scaling processes and more importantly has used
THIS TABLE SHOWS THE DESCRIPTION OF NUMBER OF SAMPLES IN EACH CLASS
}
57 | P a g e www.ijacsa.thesai.org
(IJACSA) International Journal of Advanced Computer Science and Applications, Vol. 6, No. 7, 2015
In short, this process is a kind of choosing an integer number randomly from the original size and pushing them in a new instance. Obviously, the instance is a new set of samples. Table 2, shows data set after the resampling process is performed. It can be seen from the table that the instances in the data are reweighted in a way that all classes have the exact and same total value of weight, in our case, each class is become 47. This means that the sum of weights through all instances will be preserved. TABLE II.
THIS TABLE SHOWS THE RESAMPLING PROCESS
Class Type
The number of Samples
Weights
Excellent
47
47
Very Good
47
47
Good
47
47
Fair
47
47
Pass
47
47
Fail
47
47
Here, in this paper, an arrangement of two techniques is used to select the most important features. These two techniques are explained as follows:A. Naïve Bayes Classifier (NBC) Naive Bayes Classifier (NBC), is regarded as one of the key classifiers in machine learning field. Naïve Bayes are considered as mathematical models developed by Thomas Naïve. These are independence Bayes and are a family of simple probabilistic classifiers centered on applying Bayes’ theorem to properties discretely. Naïve Bayes is the simplest form of Bayesian network, where all features are temporary and directly connected to classes. This can be called conditional freedom. Naive Bayes is taken into account as a good classifier supported via a Posteriori rule. If it is assumed that there is a problem with K classes such as {C1,C2,C3……, CK} with prior probabilities ( , then the label c is allocated to unknown instance described as x=(x1,x2,x3,….xN). See Equation (1):
C. Data Randomising Another important process is called Randomising, which is also a very simple method that can generate a random number within the size of the samples used. This method is basically switching the instances of the position of random number with its next random position as described in following snippet:-
( ( This suggests that selecting the category with the most posterior chance given the ascertained information. This posterior probability is expressed via Bayes theorem in Equation (2):( Then c can be expressed in Equation (3):-
public void randomize(Random random)
( (
{ for (int j = numInstances() - 1; j > 0; j--) swap(j, random.nextInt(j+1)); } To conclude, the whole sample set is provided and fed into a format of instances so that to create a fresh sample, this can be expressed in the following snippet code:getInputFormat().randomize(m_Random); for (int i = 0; i < getInputFormat().numInstances(); i++) { push(getInputFormat().instance(i)); } The details of these and other methods in Weka software can be found as free sources and available at the following link: http://www.cs.waikato.ac.nz/ml/weka/downloading.html. VI.
FEATURE SELECTION
In any raw data set, there can be several redundant or not significant features or even bad features that could have a negative impact on a model in terms of performance. This is because; these bad features cannot supply useful evidence to a constructed model. Thus, the feature selection stage comes in here to segregate important variables, in other words, it is a process of picking subgroups of significant attributes.
( (
(
(
(
Since the denominator is identical for each class, this can be eliminated from the evaluation. Next, the class conditional probabilities of the properties given the available classes are calculated. The process is very difficult considering the dependencies between properties. The technique of naïve Bayes is supposing class conditional independence i.e. is independent assuming the class. Thus, the numerator can be simplified as expressed in Equation (4):( ( ( ( Then after, picking the category c, this will make the most of this value over all the categories c=1, 2, 3….K, evidently this method is surely modifiable to the condition of getting more than 2 categories and was demonstrated to work well despite the essential simplifying presumptuous of restricted independence [19]. In this work, the NBC is used to allocate and divide features of the data sets into subgroups. This is done based on the similarities of features within each group. So, the idea is very simple, instead of having one set of data with all features, NBC will create several subgroups of similar features from the entire date set. B. Best First Search Best First Search (BFS) is an approach that searches the attribute subsets space via a method of Greedy Hill Climbing improved with a backtracking aptitude. The controls of the amount of backtracking can be achieved via setting the quantity of consecutive non-improving nodes.
58 | P a g e www.ijacsa.thesai.org
(IJACSA) International Journal of Advanced Computer Science and Applications, Vol. 6, No. 7, 2015
This approach might start to search in both directions; forwardly or backwardly. It can start with the empty set of attributes and search forwardly, or it can start with the full set of attributes and search backwardly. Equally it can start at any point and search in each direction by considering all doable specific attribute additions and deletions at a given point. The Best First Search algorithm can overcome the drawbacks of Hill Climbing via victimisation priority queue. The approach of the Best First Search algorithm can be considered as an amalgamation of both Depth search (DFS) and Breath First Search (BFS) algorithms. The depth First Search takes a single path, whereas, the Breadth First Search does not end up with loops nor does get onto a dead end path. Details of the algorithm are as follows [20]:Open=[Start]; Closed=[]; While Open not equal []do { Remove the left most state from open, call it X; If X=goal then return path from start to X; Else{ Generate children of X; For each child of X do Case the Child is not on Open or Closed; { assign the child a heuristic value; add the child to Open } { the child already on Open if the child was reached by shortest path then give the state on Open the shortest path } the child already on Closed. { remove the state from Closed add the child to Open; }; }; put X on Closed; re-order states on open by heuristic (best leftmost) }; return FAIL BFS algorithm is used to act as an optimiser to search and find the best sub group of similar feature among all subgroups which are mentioned earlier as they were created by Naïve Base Classifier. Finally the classification can only be done on the best selected sub group of feature. VII. CLASSIFICATION OF MULTIPLE CLASSES ALGORITHMS Several classification techniques such as Radial Basic Functions, K-Nearest Neighbors and Artificial Neural
Networks are considered, details of each classifier is provided in sub sections below:A. Radial Basis Function Radial basis functions (RBF) are considered to be a different type of neural network; the architecture of Radial Basis Function is constant with only three layers namely; input, hidden and output layers. First, the input layer is clearly providing the network with data samples. Second, the hidden layer processes these data samples with a nonlinear activation function so that to make them linearly separable. Finally, the output neurons with a liner activation function will do a linear separation. It was agreed that the architecture of Radial Basis Function networks is similar to the feed forward neural network; this is because both networks can have three layers. A Radial Basis Function can be implemented via engaging an Artificial Neural Network (ANN) approach. The objectivity between RBF and ANN is in the restricted structure type of networks. In fact, both networks perform their duties in their own method quite completely different. Radial Basis Function can have solely 3 layers, whereas, the feed-forward networks might have more than 3 layers. The input samples can be formulated as a vector of real numbers such as . The output of the network is then a scalar function of the input vector . In this case, the output of the network can be computed via Equation (5). (
∑
(|
|)
(
Where ( , is the network output, in such a case, it is a scalar function of the input vector, N, is the number of the neurons in the hidden layer, is the center vector of neuron i, , is the weight of neuron i in the linear output neuron [21]. B. K-Nearest Neighbor K-Nearest Neighbors algorithm (KNN) is widely used in machine learning and soft computing fields for the purpose of classification and regression tasks and it is defined as a technique of non-parametric. The input consists of the K nearest training sample in the feature space. In KNN technique, the type of task whether it is classification or regression can only determine the output. In the regression task, KNN considers the output is the feature of an unknown point or object, in other words, the value is computed via averaging the values of its K nearest neighbors, whereas, KNN in classification, treats the output as a class membership. This means that the unknown point is classified via the rule of a majority vote of its neighbors, so the unknown point can be allocated to the class that is best common among its K nearest neighbors. If in case the value of K is set to one, then the unknown point is merely allocated to the class of that distinct nearest neighbor [22, 23]. C. Artificial Neural Network Artificial Neural Network (ANN) has been determined to act as a third classifier for this research work; which is a feedforward neural network that is trained with back propagation. The network has the flexibility for constructing a map between the inputs and outputs. The network is extremely versatile and
59 | P a g e www.ijacsa.thesai.org
(IJACSA) International Journal of Advanced Computer Science and Applications, Vol. 6, No. 7, 2015
it is also a non-linear simulation that includes a range of neurons established into many layers. The amount of hidden neurons is extremely syndicate since the hidden neurons are thought to be the processing neurons within the network, and having a low range of hidden neurons will increase the speed of the training session whereas an oversized range of hidden layers will prolong the training session. This parameter can be selected via two techniques, these are namely; Growing approaches via that the range of hidden neurons is chosen as a low number then the amount gets augmented bit by bit. The opposite technique is named pruning via that the range of hidden neurons is chosen as an oversized number so it gets faded via eliminating some insignificant parts [24, 25]. It is also suggested to pick the initial range of hidden in accordance with adding the inputs to outputs and dividing the total by 2, then after, either the Growing or Pruning approach is employed to hit the simplest choice of hidden neurons so that to realise promising results for the network. VIII. EXPERIMENTAL RESULTS Numerous practical investigational tests and several data sets are used in this research work so that to optimise the forecasting results. Based on the Figure 1, the data set is divided into sub sets to reflect the performance of each process. Six different sets of data are prepared to conduct different experiments; these data sets are as follows:1) Non-balanced data without feature selection (NBD) 2) Non-balanced data with feature selection (NDFS) 3) Balanced data without feature selection (BD) 4) Balanced data with feature selection (BDFS) 5) Balanced data and randomised without feature selection (BRD) 6) Balanced data and randomised with feature selection (BRDFS) Note that the result of feature selection in Section 4 was only 9 features, which are selected out of 20 features, these features are:1) The age of the student 2) Education of mother for the student 3) The address of the high school 4) The instruction language of the high school 5) Overall score for the national exam 6) Department 7) English Tutor-Internal 8) English Tutor-Native 9) English Module Score for year one (General University Test)- at the start of course The above data sets are used to train Radial Basis Function, K-Nearest Neighbors, and Artificial Neural Networks. Table 3, shows the forecasting results of RBF. Models with feature selection produced better results than others in terms of correctly classified instances (CCI), incorrectly classified intendances (ICI) and Relative Square Error (RSE).
TABLE III.
SHOWS THE PERFORMANCE RESULTS OF RBF CLASSIFIER
ModelRBFData Set/ NBD Performance
RBFNDFS
RBFBDFS
RBFBD
RBFBRDFS
RBFBRD
CCI %
40.3509 56.1404
57.1005 66.4122
70.5582
78.3903
ICI %
59.6491 43.8596
42.8995 33.5878
29.4418
21.6097
RSE %
106.81 92.4126
90.8422 87.5996
83.1042
72.1832
Table 4; show the forecasting results of KNN models. The models demonstrate better accuracy compared to RBF models. Besides, KNN models with feature selection produced better results than others. TABLE IV.
SHOWS THE PERFORMANCE RESULTS OF KNN CLASSIFIER
ModelKNNData Set/ ND Performance
KNNNDFS
KNNBDFS
KNNBD
KNNBRD
KNNBRDFS
CCI %
38.5965 49.1228
70.9219
78.531
81.2202
85.3306
ICI %
61.4035 50.8772
29.0781
21.469
18.7798
14.6694
RSE %
125.1661 67.6013
82.0456
70.7932
65.3407
58.0631
Table 5; show the forecasting results of ANN models which are the most accurate among other models. TABLE V.
SHOWS THE PERFORMANCE RESULTS OF ANN CLASSIFIER
ModelANNData Set/ ND Performance
ANNNDFS
ANNBD
ANNBDFS
ANNBRD
ANNBRDFS
CCI %
43.8596 66.8588 70.0123 73.2714
80.3798
91.0714
ICI %
56.1404 33.1412 29.9877 26.7286
19.6202
8.9286
RSE %
114.707 80.9631 84.8795 75.4903
57.1275
43.3149
The above results of Tables 3, 4 and 5, show that the three classifiers RBF, KNN, ANN used with a mutual technique (NBC and BFS) for feature selection produce more accurate results than others. This is clearly seen in columns 3, 5, 7 in the above tables. Table 6, shows the difference that each process makes, the columns show the differences in correctly instances between every two models with different data sets, for example, the first column, in the first row, is the difference in correctly instances between RBF with non-balanced data and RBF with non-balanced data with selected features, and the difference is 15.7895. This means that using RBF with nonbalanced with selected feature via our mutual features selection technique (NBC and BFS) will help increase the accuracy rate of correctly instances by 15.7895 percent. The same thing is applied to the rest of the table.
60 | P a g e www.ijacsa.thesai.org
(IJACSA) International Journal of Advanced Computer Science and Applications, Vol. 6, No. 7, 2015 TABLE VI. SHOWS THE IMPROVEMENT OF RESULTS OF PERCENTAGE RATE OF CORRECTLY INSTANCES ON EACH MODEL Models
Improvement % Sum of Improvement %
RBF-(ND-NDFS)
15.7895
RBF-(BD-BDFS)
9.3117
RBF-(BRD-BRDFS)
7.8321
KNN-(ND-NDFS)
10.5263
K-NN-(BD-BDFS)
7.6091
K-NN-(BRD-BRDFS)
4.1104
ANN-(ND-NDFS)
22.9992
ANN-(BD-BDFS)
3.2591
ANN-(BRD-BRDFS)
10.6916
32.9333
22.2458
36.9499
Since all the three models produced the best results with the data sets with features. Thus, Table 7, 8 and 9 are demonstrated to show the confusion matrices of models RBF-BRDFS, KNNBRDFS and ANN-BRDFS respectively, all with selected features only. Table 7, show misclassifications in classes Failed, Pass, Medium and Good, however, no misclassifications are found in V. Good and Excellent classes. TABLE VII.
TABLE IX.
SHOWS THE CONFUSION MATRIX OF ANN-BRDFS
Class
Failed Pass Medium
Good V.Good
Excellent
Failed
6
1
0
02
03
04
Pass
0
10
0
0
0
0
Medium
0
0
10
0
0
0
Good
0
0
0
9
0
0
V.Good
0
0
0
1
9
2
Excellent
0
0
1
0
0
7
Finally, based on the results obtained in this research work, it is noticed that among all models, the ANN models produced the best results, but the ANN networks take longer time than others to get settled, it is also worth mentioning that KNN models are found the fastest among all others on all data sets, and they needed even less than a second in the worst case to produce results. Figure 2: the y- axis shows the time in seconds for each model, whereas, x-axis show different models with different data sets. It can clearly be seen that Model RBF-RBD takes the longest time among all models to produce the results.
SHOWS THE CONFUSION MATRIX OF RBF-BRDFS
Class
Failed
Pass
Medium
Good
V.Good
Excellent
Failed
7.82
1.84
0
0
0
0
Pass
2.9
9.42
0
0
0
0
Medium
0
0.87
5.22
0
0
1.74
Good
0
1.59
1.59
9.57
0
0
V.Good
0
0
0
0
2.52
0
Excellent 0
0
0
0
0
3.68
Likewise Table 8, show misclassifications in the same classes as above for the model KNN- BRDFS; nonetheless, the misclassification rates are lesser than RBF- BRDFS. TABLE VIII. SHOWS THE CONFUSION MATRIX OF K-NN-BRDFS Class
Failed
Pass Medium
Good
V.Good
Excellent
Failed
8.74
0.92 0
0
0
0
Pass
1.45
9.42 1.45
0
0
0
Medium
0.87
0
6.09
0
0
0.87
Good
0
0
1.59
11.16
0
0
V.Good
0
0
0
0
2.52
0
Excellent
0
0
0
0
0
3.68
Fig. 2. Shows the time in seconds for each model
IX.
Table 9, show misclassifications in three classes; Failed, Good, and Excellent only for the model ANN- BRDFS; and no misclassifications are found in classes Pass, Medium and Good, besides, the overall misclassification rates are reduced favorably.
CONCLUSION
The student’ academic achievement is used as a case study in this research work. Three different techniques such as ANN, KNN, and Radial Basis Function are used for classification models of multiple classes to forecast the student’s achievement. This paper is largely focused on enhancing the performance of the classification models of multiple classes. This research work proposed two effectual processes namely; resampling and randomised to tackle the non-balanced data problem, besides, a combination technique of Naïve Base and Best First Search algorithms is used to reduce the dimension of the data set. The paper produced promising results in terms of improvement on the accuracy rate.
61 | P a g e www.ijacsa.thesai.org
(IJACSA) International Journal of Advanced Computer Science and Applications, Vol. 6, No. 7, 2015
X.
[8]
FUTRURE WORKS
This research work recommended two effectual processes to tackle the problem of non-balanced data, these two processes are resampling and randomised, besides, the research work presented a combination technique of Naïve Base and Best First Search algorithms as a proposed technique for feature reduction so that to improve the performance of the classification models. However, this is only the foundation of this research work, there still more works have to be conducted in this area and these can be described as follows:-
[9]
[10]
[11]
1) Increase the size and type of the dataset and conduct further research studies to explore and examine different attributes that are related to students and their environments which might have better impacts on the overall performance of the students. 2) Examine different ways and techniques to work out the problem with unbalanced data since it has greater impact on the performance of the system. 3) Examine and work closely with other feature selection techniques that increase the performance of classification techniques.
The author would like to thank Software Engineering Department at Salahadin University, and Mr. Mohammad Arif Ul Alam from University of Maryland, United States for his thoughtful ides.
[2] [3]
[4] [5]
[6]
[7]
[13]
[14]
[15]
ACKNOWLEDGMENT
[1]
[12]
REFERENCES M.H. Dunham, “Data Mining: Introductory and Advanced Topics,” Pearson Education Inc, 2003. C. M. Bishop, “Pattern Recognition and Machine Learning,” Springer, 2006. T. Dietterich and G. Bakiri, “Solving multiclass learning problems via error-correcting output codes,” Journal of Artificial Intelligence Research, 2, 1995. G. James. and T. Hastie, “The error coding method and PICTs,” Journal of Computational and Graphical statistics 7, 1998. T. Hastie, R. Tibshirani, and J. Friedman. “The Elements of Statistical Learning, Data Mining, Inference, and Prediction,” Second-edition, Springer, pp. 606, 2008. K. Adhatrao, A. Gaykar, A. Dhawan, R. Jha, and V. Honrao, “Predicting Students’ Performance Using Id3 and C4.5 Classification Algorithms,” International Journal of Data Mining & Knowledge Management Process (IJDKP). Vol.3, No.5, 2013. C.C. Chang and C.J. Lin., “LIBSVM A Library for Support Vector Machines,”. Department of Computer Science, National Taiwan University, Taipei, Taiwan,.URL: http://www.csie.ntu.edu.tw/~cjlin/libsvm/. This LIBSVM implementation document was created in 2001 and has been maintained at http: //www.csie.ntu.edu.tw/~cjlin/papers/libsvm.pdf. 2013.
[16]
[17] [18] [19] [20] [21]
[22] [23]
[24]
J. Han, J. and M. Kamber, “Data Mining: Concepts and Techniques,” Elsevier, 2006.C. Romero, S. Ventura, and E. Garcia, “Data mining in course management systems: Moodle case study and tutorial, ” Computers & Education, Vol. 51, No. 1, 2008, pp. 368–384. M. Iraji, M. Aboutalebi, N Seyedaghaee,A. Tosinia, “Students Classification With Adaptive Neuro Fuzzy,” International Journal of Modern Education and Computer Science (IJMECS) , Publisher: MECS IJMECS, vol.4, no.7, 2012. A. Merceron, and K. Ycef, “Educational data mining: a case study,” In Proceedings of the 12th International Conference on Artificial Intelligence in Education (AIED '05), (IOS Press, Amsterdam, the Netherlands, 2005. A. Sharma, R. Kumat, P.k. Varadwaj, A. Ahmad, and G.M. Ashraf, “A comparative study of support vector machine, artificial neural network and bayesian classifier for mutagenicity prediction,” Interdisciplinary Sciences, Computational Life Sciences, vol. 3, no. 3, 2001, pp. 232–239. K. Barker, T. Trafalis, and T.R. Rhoads, “Learning from student data,” in Proceedings of IEEE Systems and Information Engineering Design Symposium, 2004, pp. 79–86. N.T. Nghe, P. Janecek, and P. Haddawy, “A comparative analysis of techniques for predicting academic performance,” in Proceedings of the 37th ASEE/IEEE Frontiers in Education Conference (FIE '07), Milwaukee, Wis, USA, 2007, pp. T2–G7. B.K. Bhardwaj and S Pal, “Data mining: a prediction for performance improvement using classification,”. International Journal of Computer Science and Information Security, vol. 9, no. 4, 2011, pp. 1–5. S. Huang and N. Fang, “Predicting student academic performance in an engineering dynamics course: a comparison of four types of predictive mathematical models,” Computers & Education, vol. 61, 2013, pp. 133– 145. K. Kongsakun, “Neural Network Modeling for an Intelligent Recommendation System Supporting SRM for Universities in Thailand,” WSEAS Transaction on Computers, Vol. 11, No.1, 2012. H. Haibo and A Edwardo, “Learning from Imbalanced Data,” IEEE Transactions On Knowledge And Data Engineering, vol. 21, no. 9, 2009. I. Rish, “An empirical study of the naive bayes classifier,” In IJCAI Workshop on Empirical Methods in Artificial Intelligence, 2001. F. G. Luger, “Artificial Intelligence: Structures and Strategies for Complex Problem Solving,” Addison-Wesley, 5th edition, 2005. D. M. Buhmann, “Radial Basis Functions: Theory and Implementations, ”, Cambridge University Press, 2003. L. K Kozma, “Nearest Neighbours Algorithm,” Helsinki University of Technology, Available: http://www.lkozma.net/knn2.pdf, /01/02/2015. 2008. T. Sergios, and K. Konstantinos, “Pattern Recognition,” Second Edition Published by Academic Press, 2003. R. Singh, A. Kainthola, and T.N. Singh, “Estimation of elastic constant of rocks using an ANFIS approach,” Applied Soft Computing Journal, vol. 12, no. 1, 2012, pp. 40–45. B.Q. Huang , T.-M. Kechadi, B. Buckley, G. Kiernan, E. Keogh, T. Rashid “A new feature set with new window techniques for customer churn prediction in land-line telecommunications,” Expert Systems with Applications 37, 2010, 3657–3665.
62 | P a g e www.ijacsa.thesai.org