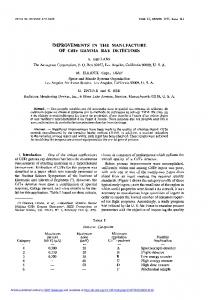
Improvements and Extensions in the Conformational Database. Potential for the ..... of the Oligomerization Domain of p53 and Interleukin-4 (IL-4)a p53. IL-4.
JOURNAL OF MAGNETIC RESONANCE ARTICLE NO.
125, 171– 177 (1997 )
MN971116
Improvements and Extensions in the Conformational Database Potential for the Refinement of NMR and X-ray Structures of Proteins and Nucleic Acids JOHN KUSZEWSKI, ANGELA M. GRONENBORN,*
AND
G. MARIUS CLORE *
Laboratory of Chemical Physics, Building 5, National Institute of Diabetes and Digestive and Kidney Diseases, National Institutes of Health, Bethesda, Maryland 20892-0520 Received December 23, 1996
In a recent paper ( 1) , we introduced the concept of a conformational database potential involving dihedral angle relationships as a method for improving the quality of structures generated from NMR and medium-resolution X-ray data. The aim of employing this potential in structure refinement by simulated annealing is to circumvent the poor discriminatory power of conventional nonbonded interaction terms ( either attractive–repulsive or purely repulsive) between high and low probability local conformations. This is achieved by biasing the sampling during simulated annealing refinement to conformations that are energetically possible by limiting the choices of dihedral angles to those that are known to be physically realizable. In the previous work ( 1) , the conformational database potentials were generated from two protein crystal structure databases: the PROCHECK database (2 ) and a backbone-dependent rotamer database ( 3) derived from 160 and 170 X-ray structures, respectively, re˚ or better. In the present Commufined at a resolution of 2.0 A nication, we extend and improve the protein conformational database potential by employing a new database of 70 diverse ˚ or better ( 4) . Because of X-ray structures refined at 1.75 A the higher quality of the structures present in this database, we are able to incorporate the dependence of the peptide covalent geometry on the f and c backbone torsion angles, and to partition the f / c, f / c / x1 , x1 / x2 , and x1 / x2 / x3 distributions into different groups according to amino acid types. In addition, the same concept is used to generate conformational database potentials for nucleic acids. Protein backbone and side-chain torsion angles, as well as backbone bond angles, were obtained from the database of ˚ ) protein crystal 70 highly refined, high-resolution ( õ1.75 A structures assembled by Karplus ( 4). Residues with tempera˚ 3 and those bordering a cis peptide bond ture factors ú25 A were eliminated from the analysis. The resulting torsion angle correlations ( see Table 1 ) were processed into potential of * To whom correspondence should be addressed.
mean force energy grids in the manner described previously ( 1). The potential of mean force is simply given by EDB (i ) Å 0kDB log Pi ,
[1]
where Pi is the probability of occurence of a particular conformation, and kDB a scale factor. Several features of the new conformational database potentials are noteworthy. In the original version ( 1) , the f / c distributions were partitioned into three groups: Gly, Pro, and all other residues. The higher resolution structure database, however, permits a further partitioning of the non-Gly and non-Pro residues into four groups: residues with a hydrogen bond donor or acceptor in the g or d position, residues preceeding a proline, b-branched residues, and the remainder. Subtle but consistent differences in the f / c distributions are observed between these groups ( see Figs. 1A and 1B) . In the original application ( 1 ) , the side-chain torsion angle correlations were limited to one-dimensional potential energy surfaces for the x1 , x3 , and x4 angles, two-dimensional potential energy surfaces of x1 / x2 , and three-dimensional potential energy surfaces of f / c / x1 for each residue. In the current conformational database potentials, all one-dimensional potential energy surfaces have been eliminated with the exception of x4 for Lys and Arg, and have been replaced by twodimensional x1 / x2 and x2 / x3 potential energy surfaces and three-dimensional f / c / x1 ( with distinct groupings; see Table 1 ) and x1 / x2 / x3 potential energy surfaces. Examples of some two- and three-dimensional potential energy surfaces are shown in Figs. 1 and 2, respectively. In the case of the Leu x1 / x2 distributions, a number of potentially false rotamers may be present in the database owing to experimental ambiguity for the x1 / x2 values of Leu residues in structures derived from medium resolution X-ray analyses. In particular, the well-staggered rotamer with x1 / x 2 values near 060⬚ / 180⬚ occupies approximately the same space as a poorly staggered rotamer with x1 / x2
171
1090-7807/97 $25.00 Copyright 䉷 1997 by Academic Press All rights of reproduction in any form reserved.
172
COMMUNICATIONS
COMMUNICATIONS
173
FIG. 2. Examples of three-dimensional potential energy surfaces. All surfaces are contoured at a level 40% higher than the minimum energy [i.e., at 0.4 (Emax 0 Emin ) / Emin ] . (A ) f / c / x1 for Val; (B) f / c / x 1 for Arg, Lys, Met, Glu, and Gln; (C) x 1 / x2 / x 3 for Met; and (D ) a(i)/ b(i )/ z (i 0 1 ) for nucleic acids.
values near 090⬚ / 20⬚, such that at a resolution worse than ˚ these two models are difficult to distinguish based Ç1.8 A on electron density alone (P. A. Karplus, personal communi-
cation ). Similarly, an alternate fit with x1 / x 2 values near 0150⬚ / 0140⬚ exists for the well-staggered Leu rotamer with x1 / x2 values near 180⬚ / 60⬚. The most likely Leu side-chain
FIG. 1. Examples of two-dimensional potential energy surfaces. All surfaces are color-coded from red (minimum energy) to violet (maximum energy). (A ) f / c for Val and Ile; (B ) f / c for Ala, Arg, Cys (oxidized), Gln, Glu, Leu, Lys, Met, Phe, Trp, and Tyr; (C ) x1 / x 2 for Leu; (D ) x2 / x 3 for Lys; ( E) d / x for nucleic acids; and (F ) e / z for nucleic acids.
174
COMMUNICATIONS
TABLE 1 Summary of Database Potentials A. Proteins Torsion angles One-dimensional x4: Arg, Lys Two-dimensional f/c: Gly, Pro, X-Pro, H-bonding,a Val/Ile, rest x1/x2 : Leu, Ile, Gln/Glu, Arg/Lys/Met, Asn, Asp, Cys(ox), His, Trp, Phe/Tyr x2/x3 : Met, Gln, Glu, Lys, Arg Three-dimensional f/c/x1: Val, Ile, Phe/Tyr/Trp, Leu, X-Pro, Gln/Glu/Arg/Lys/Met, Cys(red)/His/Asp/Asn, Ser, Thr, Cys(ox), Pro x1/x2 /x3: Gln, Glu, Arg, Lys, Met f1 /c i /f i{1,2,3,4b fi /ci /ci{1,2,3,4b Four-dimensional fi /ci /fi{1,2,3,4 /c i{1,2,3,4b Backbone-dependent geometry c t3 , f, c: Pro,X-Pro, rest v, f, c: Gly, Pro, X-Pro, rest vo , f, c: Gly, Pro, X-Pro, rest B. Nucleic acids Torsion angles Two-dimensional: a/b, a, g, a/d, a/1, a/z, a/x, b/g, b/d, b/1, b/z, b/x, g/d, g/1, g/z, g/x, d/1, d/z, d/x, 1/z, 1/x, z/x Three-dimensional: a/b/g, b/g/d, g/d/1, d/1/z, d/1/x, g/d/x, a/b/z(i-1), a/z(i-1)/1(i-1) a These refer to residues with a hydrogen-bond donor or acceptor in the g or d position (Ser, reduced cysteine, Asp, Asn, Ser, and Thr). b The scale factor used for the three-dimensional interresidue fi /ci / fi{1,2,3,4 , f i /ci /ci{1,2,3,4 potentials and the four-dimensional interresidue fi /ci /fi{1,2,3,4 /ci{1,2,3,4 potentials must be set to a value at least 10- and 6-fold lower, respectively, than that for the intraresidue potentials, since otherwise undesirable bias in the structures may be introduced. Typically, the final value of the scale factor for the intraresidue conformational database potentials is set to 1.0. c The force constants for the backbone-dependent geometry potentials are treated separately from the scale factors for the conformational database potentials.
conformations are those with x 1 / x2 values corresponding to the well-staggered conformations, and it has been suggested that the two alternate-fit positions found in some X-ray structures are incorrect ( P. A. Karplus, personal communication ) . Although these alternate-fit positions are rare in the high˚ or better) structure database, a small resolution ( 1.75 A number, constituting about 3% of the total, are still present. We have therefore corrected our database potentials accordingly. In particular, the x1 and x 2 angles for leucines with 240⬚ £ x1 £ 285⬚ and 010⬚ £ x2 õ 45⬚ were changed by adding 40⬚ to x1 and 160⬚ to x2 ; the x1 and x2 angles for leucines with 190⬚ õ x1 õ 240⬚ and 190⬚ õ x2 õ 240⬚
were changed to subtracting 30⬚ from x 1 and 150⬚ from x2 ( P. A. Karplus, personal communication ) . After this correction, two minor clusters, in addition to the major well-staggered t /g/ and g0 / t conformations, are present. The two minor clusters are located in the t /t and g0 /g/ x1 / x2 regions and are centered around values of 180⬚ /155⬚ and 085⬚ / /70⬚, respectively. These represent true alternate Leu sidechain conformations, and their small deviation from perfect staggering indicates some strain involved in adopting these conformations, consistent with their low frequency of occurence ( see Fig. 1C) . In addition to local conformation, it is also possible to include longer-order conformational information derived from the database by creating interresidue three-dimensional fi / ci / fi{1,2,3,4 and fi / ci / ci{1,2,3,4 and four-dimensional fi / ci / fi{1,2,3,4 / ci{1,2,3,4 potential energy surfaces. If these terms are incorporated into the target function used for simulated annealing refinement, it is essential to ensure that the scale factor used for the three- and four-dimensional interresidue terms is at least 10- and 6-fold lower, respectively, than that used for the intraresidue conformational database potential terms, in order to prevent the introduction of undesirable bias in the resulting structures. Typically, for the current conformational database potential, the optimal scale factor for the intraresidue conformational database potential terms is 1.0. Inspection of the database of high-resolution crystal structures also reveals a distinct dependence of the peptide covalent geometry on the backbone f / c angles ( 4) . In particular, the t3 ( N –Ca – C) bond angle and the v peptide bond torsion angle (Ca –N –C –Ca ) vary by about {5⬚ from their standard values in a manner that is dependent on f and c ( 4) . These result in relatively large atomic RMS shifts which may impact the accuracy of NMR structures. Thus, for example, a t3 angle of 5⬚ larger or smaller than the standard ˚ in the relative value of Ç110⬚ corresponds to a shift of 0.3 A positions of the 1– 3 related Ca atoms ( 4) . To incorporate the variations in backbone t3 and v angles as a function of f / c in simulated annealing refinement, we derived expectation values for the t3 and v angles from the database as follows. For every 10⬚ 1 10⬚ f / c bin, the number of examples present in the database is counted. If that number is greater than a predetermined cutoff ( 10 examples, in this work ) , the expectation values of t3 and v at that bin are calculated as the mean of the t3 and v angles of the examples seen in that bin. If the number of examples seen in the current bin is smaller than the cutoff, local average values of t3 and v are calculated over that bin’s neighbors, as described in ( 1 ). The expectation values were then incorporated into a new potential term Eangledb defined as Eangledb Å Å kt3 ∑ { t3 0 t3expectation ( f, c )} 2 / kv
∑ { v 0 vexpectation ( f, c ) } 2 ,
[ 2]
175
COMMUNICATIONS
TABLE 2 Effects of Conformational Database Refinement on the NMR Structures of the Oligomerization Domain of p53 and Interleukin-4 (IL-4)a p53 With database
IL-4 No database
With database
No database
RMS deviations from experimental restraintsb ˚) Interproton distances (A Torsion angles (⬚) 3 JHNa (Hz) 13 Ca (ppm) 13 Cb (ppm)
0.027 0.037 0.65 0.81 0.88
{ { { { {
0.001 0.052 0.04 0.07 0.03
0.026 0.147 0.36 0.75 0.92
{ { { { {
0.002 0.056 0.07 0.09 0.04
0.030 { 0.006 0.196 { 0.103
0.020 { 0.005 0.159 { 0.088
0.004 { 0.000 0.493 { 0.016 0.466 { 0.040
0.003 { 0.000 0.287 { 0.015 0.283 { 0.040
0.61 { 0.06 0.84 { 0.06
2.31 { 0.08 1.47 { 0.05
Deviations from idealized covalent geometry ˚) Bonds (A Angles (⬚) Improper torsions (⬚)c
0.004 { 0.000 0.491 { 0.021 0.615 { 0.123
0.004 { 0.000 0.520 { 0.028 0.292 { 0.068
Deviations from t3 and v expectation values t3 v
0.578 { 0.053 0.762 { 0.071
1.72 { 0.09 1.26 { 0.12 Structure quality
% residues in most favorable region of Ramachandran plotd Number of bad contacts/100 residuesd Packing scoree Torsion angle scoree ˚ )f Backbone coordinate precision (A ˚ All atom coordinate precision (A ) f ˚ )g Backbone RMS shifts (A ˚ All atom RMS shifts (A) g ˚ )h Backbone RMS versus X-ray (A i f deviation from X-ray (⬚) c deviation from X-ray (⬚)i a
99.4 2.2 0.53 0.76 0.34 0.71
{ { { { { {
1.3 1.4 0.07 0.05 0.08 0.08
96.1 4.04 0.17 0.22 0.32 0.77
{ { { { { {
1.9 3.1 0.19 0.23 0.06 0.09
89.0 4.2 00.36 0.25 1.02 1.65
0.21 0.32 0.53 7.4 10.6
{ { { { { {
1.6 1.8 0.08 0.06 0.10 0.11
75.5 11.4 00.65 00.41 1.13 1.74
{ { { { { {
3.9 2.6 0.09 0.07 0.12 0.12
0.39 0.55 0.60 10.7 13.1
1.88 31.9 41.4
1.90 35.1 43.8
Structures were calculated by simulated annealing (8) with the program XPLOR (9) modified to include coupling constant (10), secondary carbon shift (11), and conformational database (Ref. 1 and this work) refinement using the published experimental restraints for the oligomerization domain of p53 (5) and IL-4 (6). Each ensemble consisted of 30 simulated annealing structures. The interresidue conformational potentials (cf. Table 1) were not used in these calculations. b The experimental restraints for the tetramerization domain of p53 (42 residues per subunit) comprise (5) 3752 interproton distance restraints, 284 torsion angle restraints, 144 3J HNa coupling constant restraints, and 292 secondary 13 Ca and 13Cb chemical-shift restraints for the whole tetramer. The experimental restraints for IL-4 (6) (a monomer of 133 residues) comprise with 921 interproton distance restraints and 123 torsion angle restraints. c The larger deviations in the improper torsion angles for the structures refined with the conformational database potential relative to those refined without it simply reflect the fact that the peptide bond torsion angle v is no longer restrained to be absolutely planar but follows the expectation values of v as a function of f and c which vary over the range 175.6⬚ to 185.9⬚. d From the program PROCHECK (2). e From the program WHATIF (12). The larger the value of the packing score, the better the packing. A packing score ú00.5 indicates a very good structure. A torsion angle score of less than 02 for any residue is poor. f The coordinate precision is defined as the average RMS value between the individual simulated annealing structures and the mean coordinate positions. g The atomic RMS shift is the RMS difference between the mean coordinates obtained with and without conformational database refinement. h The values quoted are the RMS differences between the mean coordinates and the corresponding X-ray structures. The X-ray coordinates of the oligomerization domain of p53 and IL-4 are taken from (13) and (14), respectively. i The values quoted are the average angular RMS differences between the 30 simulated annealing structures and the corresponding X-ray structures. In the case of IL-4, when residues where the precision in f and c is ú20⬚ are excluded, the RMS deviations in f and c versus the X-ray structures are 13.1⬚ and 13.0⬚, respectively, for the structures refined with the conformational database potential, and 15.8⬚ and 18.2⬚, respectively, for the structures refined without the conformational database potential.
176
COMMUNICATIONS
FIG. 3. Examples of two-dimensional expectation value surfaces for (A ) v (non-Pro, non-X-Pro, and non-Gly residues) and (B ) t3 (non-Pro and non X-Pro residues) as a function of f and c. The surfaces are colored from red (minimum value of t3 or v ) to violet (maximum value of t3 or v ). For simplicity, only the populated regions of f / c space are shown (i.e., regions with energies less than 8 kcal.mol 01 in the two-dimensional f / c potential energy surfaces ). (The unpopulated regions of f / c space are colored in black.) The expected values of v and t3 range from 175.6⬚ to 185.9⬚ and from 105.4⬚ to 116.6⬚, respectively.
where t3 is the current value of the t3 angle, v the current value of the v angle, t3expectation ( f, c ) the expectation value of t3 at the current values of f and c, and vexpectation ( f, c ) the expectation value of v at the current values of f and c, and kt3 and k v are force constants. Plots of two-dimensional expectation value surfaces for t3 and v as a function of f and c are shown in Fig. 3. Since t3 and v should be dependent on f and c but not the converse, the expression for the atomic forces Fangledb is reduced to Fangledb Å Ìt3 expectation / Ìt3 / Ìvexpectation / Ìv.
[ 3]
By setting the terms for Ìt3 expectation / Ìf, Ìt3expectation / Ìy, Ìvexpectation / Ìf, and Ìv expectation / Ìc to zero in the expression for the partial derivative of Eq. ( 2 ), the expectation values of t3 and v may change instantly and arbitrarily as f and c change. To circumvent instabilities, it is therefore essential to use an annealing protocol in which the force constants kt3 and kv are slowly increased from initially very small values (0.001 kcalrmol 01rrad 02 ) to their final values ( 1000 and 2000 kcalrmol 01rrad 02 , respectively) , while simultaneously reducing the force constants for the conventional harmonic potential for t3 and v from their initial large values ( 500 kcalrmol 01rrad 02 ) to their final small values ( 100 and 10 kcalrmol 01rrad 02 , respectively) .
We have tested the complete intraresidue conformational database potential using experimental NMR restraints from two systems: the refined high-resolution structure of the oligomerization domain of p53 ( 5) ( a tetramer of 42 residues per subunit with 4472 experimental NMR restraints for the whole tetramer ) , and the initial low-resolution structure of interleukin-4 ( 6) ( a monomer of 133 residues with 1044 experimental NMR restraints ) . In both cases, the use of the complete intraresidue conformational database potential does not affect the precision of the ensemble of simulated annealing structures or the agreement with the experimental NMR restraints which remain essentially unaltered, and results in small atomic RMS shifts which are within the errors of the coordinates. It does, however, result in a significant improvement in the quality of the Ramachandran plot, the nonbonded contacts, the internal packing, and the side-chain torsion angles, as well as in the agreement with the expectation values for t3 and v ( Table 2 ). Essentially, the same approach used to generate the protein conformational database potential can be applied to generate an analogous conformational database potential for nucleic acids. To this end, we created a database of 232 nucleic ˚ or better. acid crystal structures refined at a resolution of 2 A The structures, which were derived from the NDB nucleic acids database ( 7), comprised the following : 40 A-DNA
177
COMMUNICATIONS
structures, 63 B-DNA structures, 28 Z-DNA structures, 12 ‘‘unusual’’ DNA structures, 42 DNA –protein complexes, 14 DNA – groove binding drug complexes, 9 DNA – intercalating drug complexes, 9 DNA /RNA hybrids, 10 RNA structures, 2 ‘‘unusual’’ RNA structures, 1 RNA –protein complex, and 2 tRNA –protein complexes. Examples of twoand three-dimensional energy grids for the nucleic acids conformational database are shown in Figs. 1E and 1F and Fig. 2D, respectively. There is one significant difference between the protein and nucleic acids conformational database potentials that needs to be noted. In the case of the protein conformational database potential, the energy values for the various minima in the multidimensional potential energy surfaces provide a true reflection of the probability of occurence of particular conformations since protein structures in solution and the crystal state are essentially the same. In the case of nucleic acids, however, and in particular DNA, the frequency of occurence of different forms in the crystal state does not necessarily reflect their probability of occurence in solution. For example, in solution under physiological conditions, short DNA oligonucleotides are invariably B-form. In the crystal, however, A, B, or Z forms can occur depending on the crystallization conditions. As a result, the A and Z forms of DNA are overrepresented in the database, and the energy values for the different minima in the multidimensional potential energy surfaces comprising the nucleic acid conformational database potential do not necessarily reflect their probability of occurrence in solution. This does not, however, affect the positions of the various minima so that, as far as structure refinement is concerned, the nucleic acid conformational database potential still serves its primary function, namely biasing sampling to conformations that are physically realizable. In conclusion, the protein and nucleic acids conformational database potentials permit one to take maximum advantage of the wealth of information present in high-resolution crystal structures of macromolecules. In this manner,
experimentally determined NMR and medium-resolution Xray structures can be improved by taking the accumulated knowledge on conformational preferences into account. ACKNOWLEDGMENTS We thank Andrew Karplus for extensive discussions and for providing us with his protein structure database. This work was supported in part by the AIDS Targeted Antiviral Program of the Office of the Director of the National Institutes of Health ( G.M.C. and A.M.G.).
REFERENCES 1. J. Kuszewski, A. M. Gronenborn, and G. M. Clore, Protein Sci. 5, 1067 (1996 ) . 2. R. A. Laskowski, M. W. MacArthur, D. S. Moss, and J. M. Thornton, J. Appl. Crystallogr. 26, 283 (1993 ) . 3. R. L. Dunbrack and M. Karplus, J. Mol. Biol. 230, 543 (1993 ) . 4. P. A. Karplus, Protein Sci. 5, 1406 ( 1996 ). 5. G. M. Clore, J. Ernst, R. Clubb, J. G. Omichinski, W. M. Poindexter Kennedy, K. Sakaguchi, E. Appella, and A. M. Gronenborn, Nature Struct. Biol. 2, 321 ( 1995 ) . 6. R. Powers, D. S. Garrett, C. J. March, E. A. Frieden, A. M. Gronenborn, and G. M. Clore, Science 256, 1673 ( 1992 ). 7. H. M. Berman, W. K. Olson, D. L. Beveridge, J. Westbrook, A. Gelbin, T. Demeny, S. H. Hsieh, A. R. Srinivasan, and B. Schneider, Biophys. J. 63, 751 ( 1992 ) . 8. M. Nilges, G. M. Clore, and A. M. Gronenborn, FEBS Lett. 229, 317 ( 1988 ). 9. A. T. Bru¨nger, ‘‘XPLOR Version 3.1: A System for X-ray Crystallography and NMR,’’ Yale Press, New Haven, Connecticut. 10. D. S. Garrett, J. Kuszewski, T. J. Hancock, P. J. Lodi, G. W. Vuister, A. M. Gronenborn, and G. M. Clore, J. Magn. Reson. B 104, 99 ( 1994 ). 11. J. Kuszewski, J. Qin, A. M. Gronenborn, and G. M. Clore, J. Magn. Reson. B 106, 92 ( 1995 ) . 12. G. Vriend and C. Sander, J. Appl. Crystallogr. 26, 47 (1993 ) . 13. P. D. Jeffrey, S. Gorina, and N. P. Pavletich, Science 267, 1498 ( 1995 ). 14. A. Wlodawer, A. Pavlosky, and A. Gutschina, FEBS Lett. 309, 59 ( 1992 ).