eXPRESS Polymer Letters Vol.9, No.2 (2015) 119–128 Available online at www.expresspolymlett.com DOI: 10.3144/expresspolymlett.2015.13
Improvements in thermoforming simulation by use of 3D digital image correlation B. Van Mieghem1,2*, F. Desplentere2,3, A. Van Bael1,2, J. Ivens2,4 1
KU Leuven, Technology Campus Diepenbeek, Wetenschapspark 27, 3590 Diepenbeek, Belgium KU Leuven, Department of Materials Engineering, Kasteelpark Arenberg 44, 3001 Heverlee, Belgium 3 KU Leuven, Technology Campus Ostend, Zeedijk 101, 8400 Ostend, Belgium 4 KU Leuven, Technology Campus De Nayer Sint-Katelijne Waver, Jan De Nayerlaan 5, 2860 Sint-Katelijne-Waver, Belgium 2
Received 10 July 2014; accepted in revised form 23 September 2014
Abstract. Numerical simulation tools for the thermoforming of unfilled thermoplastic polymers already exist for a while, but are seldom used to full extent in industry. When it is used, it is mostly only for comparative studies and prediction of relative wall thickness. One of the major reasons is the difficulty to correctly calibrate and integrate all necessary material and process parameters into the simulation software. This paper introduces and validates a methodology, in which digital image correlation (DIC) is used as the key enabling technology that improves the knowledge of the process parameters and optimizes simulation accuracy by taking away a number of uncertainties and assumptions. DIC in combination with infrared thermal measurements and pressure monitoring is used to track sheet sagging and bubble inflation of a HIPS sheet, the two main process steps in the thermoforming of positive (male) products or the only two steps in the case of free forming. The results of these in-situ measurements are used as a guideline for selecting the correct input parameters in the commercial thermoforming simulation software T-SIM®. A similar methodology can be further implemented for subsequent process steps such as forming and cooling or even to validate the material data used in the simulation software. Keywords: modeling and simulation, industrial applications, thermoforming, digital image correlation
1. Introduction
Thermoforming is a complex process that is characterized by many parameters affecting formability and product quality. The process complexity is further aggravated by the fact that the parameters can not necessarily be set independent of each other – when changing for example the sheet temperature, the tool contact friction, which plays a critical role in the thermoforming process, changes as well [1]. Precisely due to the complexity of the process, simulation software like Accuform’s T-SIM® [2], Rheoware’s FormView® and ESI’s Pam-Form® can be used as a powerful tool in the designing phase of new products and molds, and in the optimization of
the process settings with the aim of obtaining products with optimal quality, which generally corresponds to an optimal wall thickness distribution. Although the software is available, thermoforming on an industrial scale remains unfortunately primarily an experience and trial and error based technology. Failure to use simulation software has many causes. Firstly, the software mostly describes an idealized situation, differing from the real industrial environment. For example, the heating of blanks and cooling of tools is expected to be uniform in plane and homogenous through-the-thickness in simulations but this is rarely the case in reality. Secondly, the simulation software does not take into account
*
Corresponding author, e-mail:
[email protected] © BME-PT
119
Van Mieghem et al. – eXPRESS Polymer Letters Vol.9, No.2 (2015) 119–128
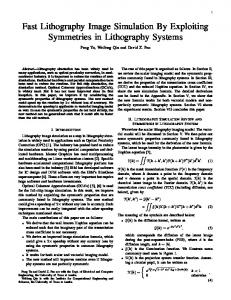
all thermal and physical aspects of this complex process within its material models since not all characteristics of the large amount of possible thermoforming materials, at thermoforming conditions, have been researched and parameterized for usage in simulation software. Different material models were tested and compared to reality in either bubble inflation or actual forming experiments, an extensive overview of previous studies is given by O’Connor et al. in [3]. Thirdly, variation of process parameters in practice jeopardizes the process robustness and requires higher safety margins and initial blank thicknesses. Finally, when all abovementioned conditions are met, i.e. the process parameters are under control and a material model is chosen that accurately describes the material behavior, one extra issue remains in order to adequately execute a simulation that yields results that can be linked back to the process itself. This issue is the matching of the thermoforming machine settings to the parameters to be set in the simulation software (Figure 1). This is a critical part of the simulation since it is impossible to obtain realistic results when starting with the wrong simulation parameters; no adequate method to define this link has been found in literature by the authors. In order to match machine settings to simulation software settings, in-situ three-dimensional Digital Image Correlation (DIC) [4], an optical non-contact full-field surface deformation measurement method, is a valuable technique [5]. DIC enables a sub-pixel measurement accuracy of displacements and strains on complex parts. In-situ DIC measurements make it possible to differentiate the effects of each process step (clamping, heating, forming, cooling) when used during the entire forming process. Whereas DIC is widely used for other applications where full field strain measurements are required, the use of DIC in Machine & process variables Material datasheet Heater temperature setting Heating time Waiting time Bubble-inflation valve setting Bubble inflation time
?
Simulation parameters Material model parameters Temperature distribution Pressure vs. time Heat transfer coefficient
Measurements Stereo digital image correlation IR temperature Cabinet pressure
Figure 1. Schematic representation of the (unclear) relationship between process and simulation parameters
thermoforming applications is rare. Only two DIC studies for a thermoforming process are known to the authors [5, 6]. In the following section, a brief overview on how DIC is implemented in the thermoforming process and the specific measures that have to be taken into consideration when using DIC for thermoforming applications are itemized. Further paragraphs will elaborate on how DIC can be used to assist the thermoformer in optimizing the input data needed for correct sheet sagging and bubble inflation simulations, two main process steps in the forming of positive (male) products.
2. Materials and methods 2.1. Digital image correlation in thermoforming
The term digital image correlation refers to the class of non-contact measurement methods that acquire surface images of an object, store them in digital form, and perform image analysis to extract full-field shape and deformation measurements [4]. In order to be able to perform stable and sub-pixel accurate correlation, a random, non-repetitive, isotropic and high contrast speckle pattern has to be applied to a blank in order to ensure distinction between the pixels. For thermoforming applications in particular, some extra criteria come into play namely: temperature resistance (no discoloration, non-toxic at forming temperature), high strain resistance without cracking (risk of losing correlation), an impeccable bonding of the speckle with the blank (polymers tend to have low surface energy) and last but not least: for industrial applications, it should be easy, fast and cheap to apply. The best industrial option would be digital or silk screen printing. Paints and inks that meet the abovementioned requirements are commercially available, one example is the VUTEk GSTF ink from EFI [7]. For current experiments, the sheet surface is spray speckled with a black custommade spray-paint (Flanders Color – F122304 WB Elastic ACRYLIC) meeting all the requirements as specified above. Next, since a (grey scale) pixelvalue is not a unique signature, a so-called subset is introduced which is a small, mostly square, surface of pixels that contains a combination of speckles and represents a unique signature in the picture. It is that subset that will be compared between the undeformed state (flat blank) and the deformed state (thermoformed product). Since the subset can change 120
Van Mieghem et al. – eXPRESS Polymer Letters Vol.9, No.2 (2015) 119–128
position, shape and size during the forming process, the coordinates of each subset are related through a deformation matrix which is dependent on the expected deformation mode. For a rigid body motion, only a first order term is considered, but when an affine or irregular transformation is expected, higher order terms need to be used. Details on the exact process flow and the choice of the correlation algorithms are presented in [8] and [9]. The way DIC is implemented for the bubble inflation process is represented in Figure 2. In this particular case, stereoscopic images are captured at a frame rate of 5 fps during the heating, sagging and bubble inflation phase and correlated in the 3D module of the academic correlation software MatchID (http://www.matchid.org). This software was benchmarked to the results of commercial systems [10] and it was found that for the bias, MatchID is in an identical range as VIC (Correlated Solutions (http://www.correlatedsolutions.com)) whereas an improved lower standard deviation by a factor of four was achieved. The correlation results in a full field displacement and strain map. If a subsequent conversion from strain to full-field wall thickness is required, it can be generated under the assumption of
incompressibility and mass conservation, resulting in volume conservation [11], an hypothesis that has been validated for HIPS in [12] through shrinkage measurements. Further described experiments make use of a spray painted stochastic elliptical laser cut pattern where the minor axis of the undeformed ellipses at starting distance from the cameras correspond to 4 pixels, which is just above the minimum speckle size of 3 pixels that is appropriate for accurate matching and to ensure reasonable intensity pattern reconstruction via interpolation [4]. The oversizing of the speckles take already into account the increasing distance of the blank with respect to the cameras during sagging, leading to speckle size reduction. A subset size of 21 by 21 pixels and a step size of 10 pixels is chosen to ensure reasonable accuracy in the subset matching process. All important parameters necessary to evaluate the accuracy of the results are summarized in Table 1. Concerning the hardware setup, two AVT Stingray F-201 cameras with Pentax high resolution, low distortion, 8 mm lenses are mounted on top of an Illig UA200ED cabinet thermoforming machine at a distance of approximately 1200 mm. This distance, combined with a correct aperture setting (f/8) and a
Figure 2. DIC applied to the bubble inflation process Table 1. Digital image correlation parameters Average noise Camera 0 Average noise Camera 1 Image pre-Filtering Subset size [px] / Step size [px] Correlation criterion Shape function Interpolation function Correlation progress Measurement points Total number of images Pixel per mm [px/mm]
Displacement 0.6990% 0.6958% Spatial resolution [px] and [mm] 21 13.104 Gaussian – Kernel 5 In-plane resolution [mm] 0.009269 21 / 10 Out-of-plane resolution [mm] 0.026502 Zero-normalized sum of squared Strain differences Affine Smoothing method Bilinear quadrilateral Bicubic polynomial Strain tensor Logarithmic Euler-Almansi Spatial + Update reference Strain window [px] 10 (~ incremental) 3256 Virtual strain gage [px] and [mm] 91 56.784 680 Spatial resolution [px] and [mm] 111 69.264 0,624 Resolution [µm/m] 68
121
Van Mieghem et al. – eXPRESS Polymer Letters Vol.9, No.2 (2015) 119–128
shutter time of 8 ms ensures that the product to be formed will be completely visible in the field of view of the cameras, the necessary depth of field is achieved and motion blur is reduced to a minimum. In order to get a uniformly lighted surface, two fluorescent diffuse spotlights are mounted on top of the thermoforming machine at an angle of 45° with respect to the thermoforming sheet. The cameras are first calibrated with an A3 format standardized dotted calibration pattern in order to capture the intrinsic (focal length in x and y direction, skew factor, distortion coefficient and principle point in x and y direction) and extrinsic (distance between the cameras in x, y and z direction and three inter-camera rotation angles) camera parameters. One critical observation has to be made on the limitations of DIC in thermoforming: the area of interest where a DIC measurement is required needs to be in the field of view of the cameras during the forming process, making the process not ideally suited for matched die forming, pressure forming and for some plug assisted vacuum forming process variants. It is on the contrary ideally suited for standard vacuum forming processes and free forming process variants.
2.2. Simulation software The aim of this research is to accurately simulate sheet sagging and bubble inflation, occurring during the heating step of most drape formed positive (male) products, in T-SIM® (V4.7a release 1). TSIM® is a commercial thermoforming simulation software that uses the nonlinear time-dependent viscoelastic K-BKZ model that was proposed by Kaye [13] and Bernstein et al. [11]. Time-tempera-
Figure 3. Typical temperature and pressure profile of a 1 mm thick HIPS sheet throughout heating, forming and cooling on an aluminum male mold
ture superposition is obtained by the WLF equation [14]. In T-SIM®, in order to simulate sagging, no time dependent heating profile can be assigned to the sheet as it does occur in reality. In reality the sheet is at room temperature when clamped and subjected to a heating profile until the forming temperature is reached. Figure 3 and Figure 4 plot the infrared surface temperature as a function of time measured at the center of the upper side of the sheet during a positive thermoforming process of a 1 mm starting thickness HIPS sheet (in red). The blue bullets represent the differential pressure of the cabinet with respect to the surrounding. The steps that can be distinguished are: the gradual heating of the sheet with decreasing slope; the retraction of the heaters which is the turning point of the temperature curve; the bubble inflation phase which speeds up the cooling process; and finally the contact with a cold aluminum mold steepening the decreasing temperature curve even more due to the much higher heat transfer coefficient towards the mold compared to the air. The gradual heating results in a gradual loss of stiffness and consequent gradual sagging of the sheet. Since sheet sagging, if not well controlled, has a major influence on the final product thickness distribution [12], it should be accurately simulated as well. A temperature profile cannot be simulated in T-SIM® and the only way to incorporate sagging in a complete process simulation is by incorporating a waiting time at forming temperature. The weight of the sheet and gravity will induce sagging at the forming temperature. Obviously this waiting time is hard to predict since no reference data is available at the time a simulation is normally per-
Figure 4. Detail of Figure 3 with focus on the bubble inflation
122
Van Mieghem et al. – eXPRESS Polymer Letters Vol.9, No.2 (2015) 119–128
formed, i.e. at the start of a new production run. In order to set the correct waiting time, DIC is used as an auxiliary tool to measure the amount of sagging as function of time during heating. In the following paragraphs describing the experiments, the sheet is heated equally in the plane of the sheet, no patterned heating is used, edge effects are neglected and through-the-thickness temperature gradients are not considered. In a second step, as is common practice for male molds, a bubble is inflated to acquire a more uniform material distribution of the final product [17]. Again, it can be understood that the height of the bubble, and the related strains in the sheet, will affect final wall thickness distribution and should therefore be predicted as accurately as possible by the simulation software. In T-SIM®, the bubble can be simulated by setting a pressure gradient (in kPa) as function of time (in milliseconds). On most of the thermoforming equipment used nowadays, the air flow, responsible for the pressure buildup underneath the sheet, is set by a proportional (often manual) valve. The direct link with the pressure as function of time used in simulation software is not that obvious to define. Again DIC, this time in combination with a pressure sensor in the lower cabinet of the thermoforming machine, enables for an accurate measurement of the bubble height and shape. Figure 5 schematizes the experimental setup. The validity of this approach has already been proven by Li et al. [16] who optimized the material parameters of the Mooney-Rivlin hyperelastic model in a bubble inflation test by observing the bubble shape with a high-speed optical surface measurement system. The system that the researchers used can be considered as a precursor of the present DIC systems without the possibility of determining in-situ strain and thickness.
Figure 5. Measuring setup for sheet sagging and bubble inflation
2.3. Thermoforming equipment and material The further described thermoforming tests have all been performed on an Illig UA200ED hydraulic thermoforming machine equipped with ceramic Elstein infrared heating elements installed in an upper and lower heater bank. The incoming air pressure of 6 bar is accumulated in a 90 L pressure vessel followed by a manual ball valve for the air flow setting and a solenoid valve to determine the time for the pressure build up. The free volume of the lower cabinet of the thermoforming machine and the piping connecting the cabinet to the accumulator is calculated approximately as 5170 L. In an ideal situation and assuming air as an ideal gas, the maximum pressure without edge losses that can be achieved when connecting the air accumulator to the lower cabinet would be 103 mbar. In order to accurately follow up the pressure build-up in the bubble inflation stage, a 0–1 bar pressure sensor (IFM electronics PA9027) is mounted in the lower cabinet. Only the lower heating bank is used to heat the sheet in order to keep the top surface free for monitoring the sheet deflections. The temperature is registered with an infrared (Fluke 576) thermometer at a rate of 10 Hz, a spot size of 23 mm (distance from the sheet 500 mm) and with an accuracy of ±0.75% of the reading. The sensor emissivity is set to 0.96, the average value obtained from material emissivity measurements of the used material. The clamping frame dimensions are set at 850 mm by 670 mm. The heater retraction takes 3.7 seconds to complete. The material used for this investigation is an extruded grade of high impact polystyrene (HIPS: Metzeler – Metzoplast SB/HK), thickness 1 mm. In T-SIM® the sheet is modeled as 850!670 mm2 with a thickness of 1 mm and consists of 9180 triangular element, fully constrained on the edges. A uniform sheet temperature of 150°C and an ambient temperature of 25°C is assumed. With current single sided infrared heating conditions and considering constant material parameters and constant convection losses at the sheet surfaces, a maximal gradient of 10°C between top and bottom of the sheet at the end of the heating stage is calculated by the finite differences method. After the retraction of the heaters, which takes 3.7 seconds, the maximal gradient within the 1 mm sheet drops below 2.5°C.
123
Van Mieghem et al. – eXPRESS Polymer Letters Vol.9, No.2 (2015) 119–128
The material model parameters are based on the default HIPS material available in T-SIM’s material library and are characterized by the K-BKZ Wagner I model (without strain hardening) with 8 pairs of relaxation moduli as function of time. Temperature effects are included by the WLF temperature dependency of the material parameters [14]. The time-integral constitutive equation is described by Equation (1) [17]: t5
#
t
2q
m1t 2 t9 2h1I1,I2 2C21 1t9 2dt9
(1)
where ! is the resulting stress, m is the memory function, h is in this case the Wagner I damping function and C–1 is the left Cauchy-Green strain tensor. The memory function can be written as a sum of exponential functions involving couples of relaxation times ("k) and relaxation moduli (ak) for N relaxation modes (Equation (2)): N a k m1t 2 t9 2 5 a e2 l k51 k
t2t9 lk
(2)
The Wagner I damping function h is defined by a single parameter # and the two strain invariants I1 and I2 (Equation (3)) [18]: h1I1,I2 2 5
1 1 1 a !1I1 2 32 1I2 2 3 2
(3)
An overview of the material parameters necessary for this model are listed in Table 2. Only the heat capacity (1.2 kJ/(kg·K)) and the thermal conductivity (0.17 W/(m·K)) were modified with respect to the standard database data, according to the material supplier datasheet as these parameters play a critical role in the temperature gradient of the sheet as a function of time. Simulation is run with automatic step calculations.
3. Results and discussion 3.1. Sheet heating and sagging
The sheet is heated from the bottom with ceramic heater setting at 300°C and the temperature and the displacement in height-direction of the center of the sheet, the location which is expected to sag the most, is measured from the top side as a function of time throughout the heating phase. Figure 6 represents the temperature and the absolute displacement of an averaged region of 21!21 pixels at the center of the sheet as a function of time. It can be seen that initially the sheet sags gradually. At the glass transition temperature (Tg = 96°C), relaxation undulations occur and disturb the gradual sagging but once Tg passed, sagging gradually continues with an increasing slope. At the point of retraction of the heaters (150°C sheet temperature), the sheet has sagged approximately 12 mm. During the heater retraction time (3.7 s) the sheets sags another 13 to 25 mm in total. This quick increase can be explained by the disappearance of the buoyancy effect: the convection of the hot air underneath the sheet creates a supporting force during heating, from the moment the heaters retract, this lifting effect is no longer present and the sheet sags with increased speed. A similar effect is expected to be present at the moment there would be a delay between sheet sagging compensation, which is not used in present study, and subsequent bubble inflation or vacuum forming. In order to simulate sagging correctly, in T-SIM®, the sheet is initially set to 150°C and subjected to gravity for a period of time (waiting time) during which the sheet sags and cools down due to its exposure to ambient air. The cooling is dominated by convective heat transfer from the sheet to the environ-
Table 2. Relaxation spectra for HIPS from T-SIM® material database; " = 0.001, WLF parameters: C1 = 17.44 K, C2 = 51.6 K with reference temperature Tref = 140°C !k ak k [s] [Pa] 1 2 3 4 5 6 7 8
0.0001 0.0012 0.017 0.24 3.3 47 640 8920
934 853 206 823 177 543 122 675 36 507 4 653 80 7.23
Figure 6. Temperature and displacement of the center of the sheet as a function of time during heating phase (3 repeats)
124
Van Mieghem et al. – eXPRESS Polymer Letters Vol.9, No.2 (2015) 119–128
ment and a minor portion by radiation. This statement is confirmed by performing a finite element transient thermal simulation (Siemens Unigraphics NX) of the cooling of a plate with realistic size and process conditions. Since separating these two effects is a complex process and radiation cooling parameters cannot be set separately in T-SIM®, the total cooling is represented by a convective coefficient. From literature [15], it would be acceptable to take 5.7 W/(m2·K) as a realistic convective heat transfer coefficient, but in present study the real coefficient is calculated by performing a heat-cool cycle on a 1 mm sheet without application of any pressure or vacuum. The temperature of the first 5 seconds of the decreasing slope, which is quasilinear, is then fitted according to Newton’s law of cooling; which is a discrete analog of Fourier’s law, with different values for the heat transfer coefficient (Equation (4)): Tt 5 c 1T1t212 2 Tamb 2 ~ e
u1t2~h 2r c L ~ p~ 1t2
d 1 Tamb
(4)
with temperature T, time t, ambient temperature Tamb, time increment $, convective heat transfer coefficient h, density %, heat capacity cp and characteristic thickness L – which is the thickness of the sheet. From Figure 7 it is clear that the best matching convective heat transfer coefficient for the measured free cooling curve has a value of 16 W/(m2·K). In order to illustrate the effect of the coefficient on the slope of the curve, curves for h = 5.7 W/(m2·K) and h = 30 W/(m2·K) are also drawn. As the T-SIM simulation software cannot cope with gradual heating and sagging of the sheet, the delay time in the simulations was chosen so that it corre-
Figure 7. Fitting a cooling curve for a 1 mm (initial thickness) HIPS sheet at starting temperature of 150°C with different convective heat transfer coefficients. 16 W/(m2·K) yields the best results
sponds to the same amount of sagging as observed experimentally by DIC measurements. This results in an artificial delay time of 5 ms for the sheet. The 25 mm deep sagged shape after 5 ms is exported and used as the reference shape in the subsequent bubble inflation simulation. The choice of the correct waiting time, reflecting the correct sagging amount, would be an impossible task without accurate experimental data. Because of the short amount of time and the heat transfer coefficient of 16 W/(m2·K) between sheet and surrounding air, the sagging process does not affect the initial temperature of the sheet much in the simulations. An average through thickness temperature drop of only 1°C is found.
3.2. Bubble inflation At first, bubble inflation is simulated in T-SIM® with settings from literature [15]: pressure between 140–280 mbar during 5 seconds which is the time needed for a typical male mold on the Illig machine to reach its top position; convective heat transfer coefficient should be between 5.7 W/(m2·K) for quiescent air and 57 W/(m2·K) for forced air convection (chosen value for simulation: 16 W/(m2·K) from previous experiments) and an ambient temperature of 25°C. These settings however result in unrealistic bubble inflation heights reaching more than 1200 mm followed by sheet bursting. For more realistic simulation results, it is recommended to experimentally determine the combination of temperature, pressure and strain measurements. The pressure build-up during bubble inflation, which is an equipment related value that is affected by the general air pressure on the incoming line, the diameter and resistance of the piping, the setting of the air flow valve, the volume of the compressed air accumulator vessel (if available), the volume of the lower cabinet that needs to be filled and the losses due to non-perfect airtight closure of the lower cabinet, is monitored with the 0–1 bar pressure sensor connected to a high resolution data acquisition system (16 bit) at a rate of 10 Hz. Experiments showed that the position of the pressure monitoring device in the cabinet is of little importance on the pressure values. To characterize the machine, in a first step, the effect of the different settings of the air flow valve (1–10) on the pressure are tested with a rigid sheet clamped in the machine to close the cabinet. The pressure as a function of time is plotted in Figure 8. With valve settings 1 and 2, the opening of the 125
Van Mieghem et al. – eXPRESS Polymer Letters Vol.9, No.2 (2015) 119–128
Figure 8. Lower cabinet pressure as a function of time for the different flow valve settings.
valve is too small to overcome the losses and the pressure gradients are therefore not represented in the graph. As a general observation on Figure 8, it can be noticed that irrespective the setting of the valve, in the first 500–1000 ms a quick pressure is built-up due to the fast decompression of the compressed air inside the accumulator vessel. The higher the setting of the air flow valve, the higher the peak value becomes. Once the accumulator is empty, the pressure only depends on the direct flow rate from the incoming pneumatic airline, affected by the throttling effect of the ball valve, reduced by the leakage losses. The pressure value decreases to a stable value representing the equilibrium between the leakage losses and the fresh incoming air. From setting 7 and above, the pressure in the equilibrium phase is practically identical. The measured pressure gradients are machine specific and only need to be monitored once, since they are unaffected by the type of material or mold used. Important to remark is that for some faster applications where the bubble inflation step takes less than 1 second, the pressure gradient will still be in the rising part of the curve. In the current research, inflation takes 5 seconds meaning that not only the rising part but also the rest of the profile needs to be used. After the heating phase, the sagged sheet is subjected to a bubble inflation step with three different settings of the air flow valve (3, 5 and 7), leading to three different strain rates and displacements of the center point of the bubble (Figure 9). With valve settings below 3 (meaning 30% of the maximum valve opening) the pressure is insufficient to lift the sheet, above 7 (70%) the sheet ruptures. Concerning the response on the pressure build-up, one can distinguish two effects: the higher the pressure, the higher the bubble will be, which is obvious, and the faster
Figure 9. Temperature and displacement of the center of the sheet as a function of time for three settings of the pressure valve
the sheet will cool down. The faster cooling response is caused by two phenomena: firstly, the higher the pressure, the more turbulent the air will be, leading to a higher heat transfer coefficient between sheet and air and secondly, since the sheet thickness reduces at the same time, the local heat flux density increases inversely proportional to the sheet thickness according to Fourier’s law of heat conduction. Similarly to the calculation of the convective heat transfer coefficient during sagging, the linear part of the decreasing cooling slope is fitted according to Equation (4). The only difference is that the effective thickness reduction as a function of time (L(t)), as calculated using DIC data, is taken into account. The correct calculation of the heat transfer coefficient is not possible if the thinning effect during the bubble inflation is not included, this is what the real advantage of DIC means in this case. A detailed description of the use of DIC for online thickness measurement can be found in [5]. The calculated coefficients are 26, 31 and 32 W/m#K for valve settings 3, 5 and 7 respectively (Figure 10).
Figure 10. Fitting of the convective heat transfer coefficients to the cooling curves during bubble inflation for valve settings 3, 5 and 7 126
Van Mieghem et al. – eXPRESS Polymer Letters Vol.9, No.2 (2015) 119–128
The calculated convective heat transfer coefficient and the pressure gradient during 5 seconds for valve setting 3 are entered in T-SIM® and a simulation is run leading this time to a more realistic bubble height of 90.5 mm. When comparing the bubble height obtained with T-SIM® to the DIC measurements (93 mm after 5 seconds (Figure 9)), it can be concluded that the result are within an allowable tolerance (3%) and that the material model for the simulated strain rates and temperatures is adequate. A similar simulation strategy is adopted for inflation valve settings of 5 and 7 but in these cases, the simulation needed to be interrupted after 1.5 and 1 s respectively since stress-strain and temperature extrapolation errors occurred around 135°C. This simulation problem does not affect the fact that the methodology can be used with proper functioning thermoforming simulation software. The respective height deviations from the DIC data are with these valve settings 12 and 9%. Next to the bubble height, which is a single point value, the 3D point cloud of the top surface of the final shape obtained with valve setting 3 is exported, meshed and matched to the exported final shape of the bubble created in T-SIM® using GOM Inspect® V7.5, a freeware 3D inspection and mesh processing software for dimensional analysis of 3D point clouds (http://www.gom.com). The matching process proves that not only the height of the bubble is correct, but that there is also a quasi-perfect agreement in bubble shape (Figure 11). The real asset of using DIC and measuring the shape of a whole surface instead of a single point in the middle as can be done by a height acquisition device or a light curtain, which is currently industrially used to measure the bubble height, is that also wanted or unwanted asymmetries created either by un-uniform heating in plane or by extrusion anisotropy caused
by the prior sheet extrusion process [12], can also be identified and matched. It is expected that the adopted methodology is applicable for any unreinforced thermoplastic material as long as the assumption of volume conservation is valid and no through thickness shear occurs since this could lead to erroneous predictions of the final thickness based on measurements of the non-mold contact surface. However, if there is a need for extrapolating the results to thicker plates, care must be taken during heating to minimize the through thickness temperature gradient.
4. Conclusions
In this paper, DIC is used together with online temperature and pressure measurements to track sheet sagging and bubble inflation of a HIPS sheet. The measurements are used to set the correct input values (amount of sagging, pressure gradient, temperature, convective heat transfer coefficient) in a commercial thermoforming simulation software T-SIM®. For the experiment with a 850!670!1 mm sheet, a waiting time of 5 ms at forming temperature (150°C) could be defined, leading to 25 mm sagging. For the bubble inflation, the real pressure gradient in combination with the thickness-corrected convective heat transfer coefficient, from temperature and DIC measurements, are required to predict the bubble height within an acceptable accuracy of around 3% where simulation was practically impossible without this knowledge. The simulation software can now be used to optimize bubble height and shape and the simulation parameters can directly be linked back to the machine settings since the actual pressure profiles are known. The methodology can in this way be used to generate experimental data in a very easy and straightforward way in order to optimize simulation accuracy and shorten the trial and error methodology used nowadays.
Figure 11. 3D matching of DIC and T-SIM® shape of a bubble inflated with valve setting 3. Color scale in mm.
127
Van Mieghem et al. – eXPRESS Polymer Letters Vol.9, No.2 (2015) 119–128
A similar approach can be further implemented for other materials and material thicknesses, process steps such as forming and cooling or it can be used to validate the material parameters of the KBK-Z (or any other material) model by implementing a reverse engineering approach on different pressures and temperatures.
[8] Lava P., Cooreman S., Coppieters S., De Strycker M., Debruyne D.: Assessment of measuring errors in DIC using deformation fields generated by plastic FEA. Optics and Lasers in Engineering, 47, 747–753 (2009). DOI: 10.1016/j.optlaseng.2009.03.007 [9] Pan B., Qian K., Xie H., Asundi A.: Two-dimensional digital image correlation for in-plane displacement and strain measurement: A review. Measurement Science and Technology, 20, 062001/1–062001/17 (2009). DOI: 10.1088/0957-0233/20/6/062001 [10] Reu P. L.: Experimental and numerical methods for exact subpixel shifting. Experimental Mechanics, 51, 443–452 (2011). DOI: 10.1007/s11340-010-9417-4 [11] Bernstein B., Kearsley E. A., Zapas L. J.: A study of stress relaxation with finite strain. Journal of Rheology, 7, 391–410 (1963). DOI: 10.1122/1.548963 [12] Van Mieghem B., Van Bael A., Ivens J.: Impact assessment of extrusion anisotropy on quality of thermoformed products. in ‘Proceedings of Composites Week @ Leuven and TexComp-11 Conference, Leuven, Belgium’, 1–8 (2013). [13] Kaye A.: Non-Newtonian flow in incompressible fluids. College of Aeronautics, Cranfield (1962). [14] Williams M. L., Landel R. F., Ferry J. D.: The temperature dependence of relaxation mechanisms in amorphous polymers and other glass-forming liquids. Journal of the American Chemical Society, 77, 3701–3707 (1955). DOI: 10.1021/ja01619a008 [15] Throne J. L.: Technology of thermoforming. Hanser, Munich (1996). [16] Li Y., Nemes J. A., Derdouri A. A.: Membrane inflation of polymeric materials: Experiments and finite element simulations. Polymer Engineering and Science, 41, 1399–1412 (2001). DOI: 10.1002/pen.10840 [17] Wagner M. H.: Analysis of time-dependent non-linear stress-growth data for shear and elongational flow of a low-density branched polyethylene melt. Rheologica Acta, 15, 136–142 (1976). DOI: 10.1007/BF01517505 [18] Wagner M. H., Demarmels A.: A constitutive analysis of extensional flows of polyisobutylene. Journal of Rheology, 34, 943–958 (1990). DOI: 10.1122/1.550107
Acknowledgements
The authors would like to thank the MeM2P group of KU Leuven campus Ghent for providing the DIC platform MatchID3D and their technical support.
References
[1] Martin P. J., McCool R., Härter C., Choo H. L.: Measurement of polymer-to-polymer contact friction in thermoforming. Polymer Engineering and Science, 52, 489–498 (2012). DOI: 10.1002/pen.22108 [2] Novotn$ P., Sáha P., Kouba K.: Fitting of K-BKZ model parameters for the simulation of thermoforming. International Polymer Processing, 14, 291–295 (1999). DOI: 10.3139/217.1543 [3] O’Connor C., Martin P. J., Sweeney J., Menary G., Caton-Rose P., Spencer P. E.: Simulation of the plugassisted thermoforming of polypropylene using a large strain thermally coupled constitutive model. Journal of Materials Processing Technology, 213, 1588–1600 (2013). DOI: 10.1016/j.jmatprotec.2013.02.001 [4] Sutton M. A., Orteu J., Schreier H.: Image correlation for shape, motion and deformation measurements: Basic concepts, theory and applications. Springer, New York (2009). [5] Van Mieghem B., Lava P., Debruyne D., van Bael A., Ivens J.: Digital image correlation for on-line wall thickness measurements in thick gauge thermoforming. Key Engineering Materials, 554–557, 1583–1591 (2013). DOI: 10.4028/www.scientific.net/KEM.554-557.1583 [6] Seefried A., Drummer D.: The effects of radiation crosslinking and process parameters on the behavior of polyamide 12 in vacuum thermoforming. Polymer Engineering and Science, 52, 884–892 (2012). DOI: 10.1002/pen.22155 [7] Craig S.: Direct digital UV imaging for deep draw thermoforming. Thermoforming Quarterly, 32, 24–26 (2013).
128