IMPROVING ACCESS TO PRECIPITATION DATA FOR GIs USERS: DESIGNING FOR EASE OF USE
'
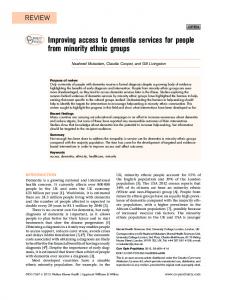
Erich F. Stocker and Owen A. Kelley 'NASA Goddard Space Flight Center, Greenbelt, Maryland, 20771, U.S.A. 2 George Mason University, Fairfax, Virginia, 22030, U.S.A.
[email protected] and
[email protected] ABSTRACT The Global Precipitation Measurement Mission (GPM) is a NASNJAXA led international mission to configure a constellation of space-based radiometers to monitor precipitation over the globe. The GPM goal of making global 3-hour precipitation products available in near realtime will make such global products more useful to a broader community of modelers and GIs users than is currently the case with remote sensed precipitation products. Based on the existing interest to make Tropical Rainfall Measuring Mission (TRMM) data available to a growing community of GIs users as well as what will certainly be an expanded community during the GPM era, it is clear that data systems must make a greater effort to provide data in formats easily used by GIs. We describe precipitation GIs products being developed for TRMM data. These products will serve as prototypes for production efforts during the GPM era. We describe efforts to convert TRMM precipitation data to GeoTIFF, Shapefile, and ASCII grid. Clearly, our goal is to format GPM data so that it can be easily used withln GIs applications. We desire feedback on these efforts and any additions or direction changes that should be undertaken by the data system.
KEY WORDS GIs, Tools, GPM, TRMM, precipitation 1. INTRODUCTION The Global Precipitation Measurement (GPM) mission is composed of a core satellite which carries a dual frequency precipitation radar and a conical scanning multi-channel radiometer as well as a number of constellation satellites provided by US, Japan and international partners. In addition, GPM will have a number of participating ground validation sites provided by international partners to assist in data validation and error estimation. The GPM core satellite is currently scheduled to launch in 2013 [1,2]. The core satellite is an evolutionary enhancement of the NASAJJAXA Tropical Rainfall Measuring Mission (TRMM) satellite [3] launched in November 1997 and still operating flawlessly. GPM mission data are expected to be used in many applications including flood prediction, storm monitoring, and agriculture, forestry, and transportation [4].
One way to promote the wide use of GPM data is for the processing and archive facility, called the Precipitation Processing System (PPS), to provide the data in formats used by Geographic Information Systems (GIs) [5,6]. Since the mid 1990s, NASA earth science data systems have generally archved observations in the HDF format. Two approaches to GIs data for GPM are being investigated by PPS: generating GIs files upon request; or producing key products in one or several GIs formats. T h s paper explores issues dealing with useful GIs formatting not with the operational details of generating the GIs files. More specifically, we present in thls paper prototype products for GPM data developing using data fiom the TRMM satellite. Because TRMM data is already extensively used in the remote sensing community and is also becoming useful in the expanded community foreseen for the GPM era, it provides a laboratory for looking into the most appropriate ways to represent this remote-sensed swath and grid data usefully for the GIs community. The usefulness of TRMM to GPM prototyping is further enhanced because of the relationshp of TRMM to the GPM core satellite. Various GIs software packages read and write a number of physical formats including GeoTIFF, ASCII, and shapefiles to store a relatively limited number of logical data formats such as grid and vector data. The prototype products that we produce should enable us to find convenient physical formats for vector data that can be used by a wide range of GIs and physical formats for grid data that likewise can be read by a wide range of GIs formats. The current thlnking is that end users will more easily be able to convert fiom the physical GIs fonnats we provide into whatever physical format is most convenient in their particular GIs application than is the case if they had only current swath or grid products. The IS1 Web of Science database lists over three hundred peer-reviewed articles mentioning both precipitation and GIs in their title, abstract, or keywords. Another three hundred peer-reviewed articles mention TRMM. Only two peer-reviewed articles in the database describe TRMM data analyzed in GIs software [7,8]. In addition, several conference pre-print papers analyze TRMM data using GIs software for flood prediction [9], hydrology [lo], fire monitoring [l 11, and other areas. The limited number of journal articles and preprints on this GIs topic may be due to TRMM data being distributed almost exclusively in the HDF format. HDF is a flexible,
platform-independent physical data format used as the primary archive format for many NASA Earth observing missions since the mid-1990s. Unlike GIs applications, scientific programming languages such as C, FORTRAN, IDL, and Matlab can easily read HDF files using library calls. We use IDL programming language to read the original HDF files, to write the GIs files, and to examine those GIs files. In addition, we display these GIs files using the free ESRI ArcExplorer GIs, the Global Mapper GIs, and the ESRI ArcView GIs. For over a decade, ArcView was a stand-alone GIs, but now ArcView is merely the name of the entry-level license for the ArcGIS product. ESRI's products are described at [12] and Global Mapper can be downloaded from [13]. Mentioning a specific software package does not constitute an endorsement. 2. GIs FORMATS Many GIs applications can read GeoTIFF files, shapefiles, and ASCII grids [14,15]. Each of these formats, however, has disadvantages compared with the original HDF files. The GeoTIFF and ASCII formats only contain one variable, which is inconvenient if one wants to store all of the variables in an HDF file. Current TRMM precipitation products contain many variables within the product. For example, the monthly, gridded, precipitation radar product contains over 200 parameters. The most obvious way to store the name of the variable in a GeoTIFF or ASCII grid file is to embed the variable name in the filename. In contrast, a shapefile can store multiple variables and their names. All three of these formats cannot store a text string naming the units of a variable or store a numerical scaling factor that was
applied before the data was written to the file. This is just one of the complexities of converting TRMM files to GIs formats and may be a contributing factor to their current reduced use by GIs users. Making a data product easy to use starts with choosing an appropriate physical format for the data set's logical structure. For example, a rectangular latitudellongitude data grid is efficiently stored in a GeoTIFF file, and an irregular grid (such as satellite swath) can be more accurately represented in shapefiles as will be discussed in the following sections of this paper. GeoTIFF files are also a convenient means of storing a browse image covering a specific location. The prototyping done at PPS has identified some additional guidelines for converting precipitation products to GIs. Use short but informative filenames because those filenames generally are displayed in GIs software, not the name of the variable inside of the files. Use color tables in GeoTIFF files that highlight the features the user is most likely to be interested in and use color tables that the user is familiar with, when possible. Another format detail is to distribute with the GIs data files a human readable documentation file containing metadata that cannot be easily stored in the GIs data files. Currently, various standards are being developed for storing metadata in the XML format which is somewhat human-readable. As these XML metadata standards become widely used, we will incorporate them into our work. PPS has also prototyped writing TRMM data in the Google Earth KML format for vector data and the related KMZ format for vector and grid data. Recently, TRMM data has been provided in the KML format on the NASA TRMM web site and the web site of the TRMM Science Data and Information System (TSDIS). The KML format
GeoTIFF metadata
Worldfile
ArcInfo ASCII arid
GTmodelTypeGeokey2 GTrasterTypeGeokey 1 ModelTiePointTag=[ 0, 0,0, -100,40,0 ] ModelPixelScaleTag=[ 10, 10, 0 ]
10 0 0 10 -95 35
ncols 3 mows 2 xllcorner - 100.0 yllcorner 20.0 cellsize 10 nodata-value -9999.0 14.2 5.0 0 1.0 0 -9999.0
pcscitationgeokey= "Latitudellongitude grid boxes of 10 by 10 degrees with the upper left comer at 40 degrees north and -100 degrees east."
Table 1. This table shows how the same geographic metadata would look if stored in a GeoTIFF file, worldfile, or ArcInfo ASCII grid file. See the text for more information about these file formats. The 3 by 2 grid with 10 degree resolution covers from 20N to 40N latitude to -100E to -180E longitude. The GeoTIFF file states the grid coverage and cell resolution and it implies the number of elements in the grid. The worldfile states only the cell center latitude and longitude of the northwestern-most cell, leaving it up to the GIs software to read the accompanying image file to determine the number of elements in the grid and then calculate the grid's coverage. The ArcInfo ASCII grid states the southwestern corner of the grid, the cell resolution, and the number of elements in the grid. The GIs software can then calculate the grid's coverage from this information.
.
permits automatic refreshing of data and three dimensional fly throughs of observations collected by multiple instruments. In t h s paper, we do not discuss the KML format in detail because we believe Google Earth to be merely an outreach tool at this time and currently not a tool that researchers use to analyze data. The separation between NASA's archival format (HDF) and GIs f o m t s might narrow or disa pear in the future. With over three petabytes (3x10'' bytes) in NASA's Earth science archives [16], there is incentive for popular GIs applications to add the ability to directly read HDF files. ArcView already has a limited ability to read HDF [17]. Thinking even more broadly, the general issue of converting between different physical file formats could become irrelevant if files were no longer downloaded from archives. A number of researchers are worlung on data transfer standards that would allow the files in an archve to stay there. Only a stream of data would be transmitted to the end user. End users would become responsible for obtaining software that would save the data that they downloaded in the physical format that they prefer. Such "web services" are outside the scope of h s paper. 2.1. GEOTIFF FORMAT The GeoTIFF format was developed in the early 1990s in part at NASA JPL. Many GIs applications both free and proprietary are able to read GeoTIFF files [18]. A GeoTIFF file is an ordinary TIFF image with geographic metadata written in the TIFF file's header. The geographic metadata in a TIFF file can be in one of over forty coordinate systems. The flexibility of a GeoTIFF file's coordinate system is an advantage for the minority of researchers using one of these less common coordinate systems. It can cause confusion for people developing data products and data display software. In the interest of using a very simple set of GeoTIFF metadata fields, we have chosen a group of just five fields that define the map projections that we use. The documentation for the fields can be downloaded from the GeoTIFF web site [19]. For an example, see the left column of Table 1. The "GTmodelTypeGeokey=Y field determines that the coordinate system is "geographic latitude-longitude", which is the very common, latitudellongitude grid. The rectangular "GTrasterTypeGeokey=l" field determines that the pixels of the image should be represented as areas not points. The "ModelTiePointTagl' is set equal to a six element floating point array which is full of zeros except for the fourth and fifth elements. These two elements state the western edge of the grid in degrees of longitude and the northern edge of the grid in degrees of latitude. The "ModelF'ixelScaleTag" is set to a three element floating point array. The first two elements are the longitude and latitude resolution of a the pixel in degrees of longitude
and latitude. The last element of the array is set to zero since the images we produce are horizontal. The "PCScitationGeokey" tag is set equal to a string that states in English the geographc information stored in the other four fields in a machine readable format. This redundancy could prove useful if a programmer were traclung down why a particular GIs application had trouble displaying a particular GeoTIFF file. At least one popular GIs application ignores the geographic metadata in a GeoTIFF file. More specifically, the ArcExplorer GIs application ignores the geographic metadata in a GeoTIFF file, reads the image from the file, and expects geographic metadata to be stored in a separate file called a "worldfile." A worldfile has the same name for the associated image file except that its file extension uses tifw instead of tif. A worldfile is six line ASCII text file that states the x and y resolution and latitudellongitude coordinates of the comers. According to Wikipedia [20], the six numbers in a worldfile define the northwest comer of the image and the resolution of an individual pixel of the image in units of degrees about the assumed spherical earth. Obviously, the units of resolution are not perfectly precise because the Earth is not a perfect sphere, but that slight inaccuracy is much too small to place the data in an misleading location. The six numbers must be written in the required order because there are no text labels in the worldfile. For an example, see the middle column of Table 1. All of our images have zero rotation from the default orientation of x being the longitude axis and y being the latitude axis, so the six numbers have the following meaning: (1) the x resolution of an image pixel in degrees of longitude, (2) the rotation of the image about the y axis (zero for us), (3) the rotation of the image about the x axis (zero for us), (4) the y resolution of an image pixel in degrees of latitude, (5) the longitude of the center of the northwestern-most pixel in the image, and (6) the latitude of the center of the northwestern-most pixel in the image. In TRMM standard products, data grids are rectangular latitudellongitude grids and metadata state the overall outer boundary of the grid. For this reason, we must subtract half a pixel width from the stated grid boundaries to calculate the pixel center location to be written in the worldfile. As mentioned previously, GeoTIFF files can either store browse images or floating point data values. Browse images are byte values stored with a 255 element color table. All GIs applications we tested are able to display such images. Alternatively, GIs applications can store a two dimensional array of four-byte floating point values. In other words, one can store the actual estimates of rain rates, instead of color-coding the rain values. The advantage of storing the floating point values is that it permits more precise analysis by GIs tools. The disadvantage of storing floating point values is that some GIs applications are unable to associate a reasonable
'
than one line of sight is in a single grid box, while an neighboring grid box within the swath has no lines of sight within it.
color table with a GeoTIFF file containing floating point data values. Figure 1
Ways of representing fields of view in a satellite swath
Gausian distribution about one field of view
Four sided polygons
Rectangular latitude / longitude grid
2.2. SHAPEFILE FORMAT A "shapefile" is a collection of files for storing geographic data in vector form. The format was developed by ESRI and first released in 1995 with ArcView version 2.0, but many other GIs applications now also can read shapefiles [21,22]. All of the geographtc objects in a shapefile are either points, lines, or polygons. All of the geographic objects in a shapefile also have the same list of variables associated with them, such as rainfall rate or radar reflectivity. In GIs lingo, a geographic object is called an entity and one of its variables is called an attribute. Shapefiles become slow to display and unnecessary large to save on a hard disk when the dataset is a large, h g h resolution rectangular latitudellongitude grid. A GeoTIFF file is a more logical choice for storing such a grid. A shapefile is a natural choice for storing scattered or adjacent objects with polygonal borders. The intent of the TRMM swath is to fill the space between the swath edges, so we chose a four sided polygon approach to represent each footprint. Our four sided polygons are shown schematically in the middle panel of Figure 1 with light gray polygons. The center of each footprint's line of sight is indicated with a black dot in the figure. Additionally in our prototype representation the instrument response is roughly a Gaussian distribution around the center of the line-of-sight, as shown in the left panel of Figure 1 for just one of the lines of sight. Alternatively, the Gaussian distribution could be simplified as an oval that contains a certain fraction of the instrument response for that footprint. Such ovals are hard to calculate for rain estimates made with channels of different footprints, as occurs with the TRMM Microwave Imager. Figure 1 also shows one issue of using a rectangular latitudellongitude grid to approximate a satellite's swath. Sometimes more
'
2.3. ASCII FORMAT Since at least the 1990s, ArcInfo has been able to read gridded data in a simple ASCII format, known as the ArcInfo ASCII grid format. Global Mapper can read the ArcInfo ASCII grid format. ArcView currently ships with a converter tool (in the arc tool box, ASCII to raster converter) that can convert this ASCII format into a format that ArcView can display. Other groups at the Goddard Space Flight Center have experimented with converting TRMM swath data into a grid and then saving the grid in the ArcInfo ASCII format [15,23]. Gridding the data, however, introduces averaging of rainfall values and of observation location, as shown in the right panel of Figure 1. In thts paper, we propose converting satellite swaths into vector representations that preserve the exact rainfall rate and a more precise presentation of the location of the original observation. The ArcInfo ASCII grid format is defined as six lines of metadata following by all the data values in the grid, which are generally written as floating point values. For an example, see the right column of Table 1. Unlike the worldfile (the companion to a image file) format, these six lines of metadata at the top of an ArcInfo ASCII grid file contain the name of the metadata field in addition to its numeric value. The six line are the number of columns in the grid that represent the various longitude values in the grid, the number of rows that represent the various latitude values in the grid, the longitude value of the southwest corner of the overall grid, the latitude value of the southwest comer of the overall grid, the resolution of the grid cells in degrees of latitudellongitude, and the missing data value.
3. CASE STUDY This year, we have begun generating in near real-time global rainfall maps in a GIs format for the Pacific Disaster Center (PDC) to distribute to disaster management agencies through their GIs-based web interface. The PDC is evaluating the usefilness of 3 hour, 1 day, 3 day, and 7 day accumulations of TRMM 3B42 precipitation grids that cover within 50 degrees of the Equator at 0.25 degree resolution. For the PDC's applications, the most important driver is the timeliness of the data: those applications require the most up-to-date rainfall accumulations available. After considering one byte color-coded, two byte unsigned integer, and floating point TIFF files, the PDC settled on two byte unsigned TIFF files. Two byte TIFFS have the advantage of being a compact way to store data while also allowing rain rates to be scaled by 10 and
stored to the nearest 0.1 mm/hr, which is sufficient accuracy to allow PDC users to threshold the data based on r n d h r or inchlhr. Two byte TIFFs have the disadvantage that Arcview's default display settings have to be manually changed before displaying two-byte TIFFs and a number of non-GIs TIFF viewers cannot handle two-byte TIFFs. In addition to the TIFF file, we generate a worldfile with the same root filename and with a "tfw" file extension. Only in the rare event that one or more of the input files for the multi-day accumulations are missing, we also generate a text file that contains a warning about the fact that some of the expected data for the accumulation was unavailable. The text file has the same root filename as the TIFF image, and it has a "txt" file extension. For more information about the PDC, visit their web site [24]. Other organizations are welcome to contribute to this prototyping effort. Because our work with the Pacific Disaster Center is preliminary at the time of writing, the case study presented in this paper is based on other work. This case study examines a TRMM Microwave Imager (TMI) overflight of a hurricane. TMI has approximately half the resolution of the precipitation radar, but for many applications, the resolution of the passive microwave instrument is acceptable and the more frequent overflights due to the wider swath is a great bonus. This is especially the case for the types of applications for which precipitation data might be used in GIs applications. Figure 2 shows semi-transparent rainfall estimates from the TMI overlaid on a shaded relief image of cloudtop temperatures from the Visible-Infrared Spectrometer (VIRS) on TRMM. Red in the rainfall map indicates locations of heavy rain. Tall clouds can indicate vigorous convection below, and therefore give a sense of how organized and vigorous the hurricane is. The coastline outline is from a shapefile.
Figure 3 shows a higher resolution image of the heavy rain on the north side of Hurricane Jeanne's
eyewall. An aerial image of that portion of Florida, near Sebastian, Florida, is shown under the rainfall image. The aerial image was downloaded automatically using the Global Mapper GIs that was used to generate the image. Figure 3
Figure 4 shows a satellite swath written in two different formats that have been discussed in this paper. The blue, green, and yellow regions are from a high resolution TIFF image with geolocation information contained in a worldfile. The colors correspond to rain rates of 2.5, 12, and 25 mm/hr (0.1, 0.5, and 1 inchlhr), respectively. The black boxes that contain floating point rain rates are from a shapefile. The shapefile is a more accurate representation of the actual observations made by the satellite, while the high resolution grid is interpolated from the actual observations. The convective cell shown in Figure 4 occurred over Oklahoma during TRMM orbit 3204 on June 19, 1998. This cell was part of one of the most severe thunderstorm clusters ever observed by TRMM satellite during TRMM's almost 10 years in Earth orbit [25]. NOAA's online Storm Event Database states that this cluster of storms was associated with 11 cm diameter hail, 36 m/s (70 knot) winds, and a tornado.
REFERENCES
4. CONCLUSION We have found that precipitation data both in satellite swath geometry and grid geometry can be stored in formats read by Geographic Information Systems (GIs). In an effort to make our GIs files easy to use, we have attempted to use the simplest metadata possible to define geographic information and to use the most appropriate physical format for the logical format of a particular data set. In particular, GeoTIFF files are a convenient way to store a single variable either as an browse image or as a grid of floating point data values. The ASCII format is an inefficient way to store large quantities of data but it has the advantage of being human-readable as well as computer readable. Previous studies have used a rectangular latitude / longitude grid to represent a satellite's data swath. We recommend instead that shapefiles be used to store precipitation from a single satellite swath in order to increase the accuracy of the geographic representation of the swath. In addition, GIs applications should allow users to choose the upper and lower limit of the color table and to choose a l o g a r i t h c color table when displaying floating point rainfall estimates and some other atmospheric quantities. We continually seek additional input so that we can determine the best way to make GPM data available to GIs users. Our collaborators in this effort gain the advantage of getting existing TRMM precipitation data in a format that they can easily use.
ACKNOWLEDGEMENT TRMM data is possible due to the joint efforts of NASA 1 JAXA I NICT.
[I] S. Neeck, R. K. Kakar, W. J. Adam, and E. A. Smith, Enabling global precipitation measurement (GPM) Proceedings of SPIE: Sensors, Systems and NextGeneration Satellites, VI Vol4881,2002, 67-76. r21 Global Precipitation Measurement (GPM) web site, http://gpm.gsfc.nasa.gov. [3] C. Kurnmerow, W. Barnes, T. Kozu, J. Shiue, and J. Simpson, The Tropical Rainfall Measuring Mission ( T R ~ M sensor ) package, Journal of Atmospheric and Oceanic Technology, 15, 1998, 809-8 17. [4] J. M. Shepherd, GPM and societal applications: a generic framework, 6th GPM International Planning Workshop, 2006, Annapolis, Maryland, gpm.gsfc.nasa.gov. [5] E. F. Stocker, The GPM Precipitation Processing System, Proceedings of SPIE: Sensors, Systems and Next-Generation Satellites VI, vol. 5234,2004, 132143. [6] E. F. Stocker, NASA Precipitation Processing System (PPS) Status, 6th International GPM Planning Workshop, 2006, Annapolis, Maryland. [7] J. M. Shepherd, 0. 0 . Taylor, and C. Garza, A dynamic GIs-multicriteria technique for siting the NASA-Clark Atlanta Urban Rain Gauge Network, Journal ofAtmospheric and Oceanic Technology, 21, 2004, 1346-1363. [8] P. A. Kucera, W. F. Krajewski, and C. B. Young, Radar beam occultation studies using GIs and DEM technology: an example study of Guam, Journal of Atmospheric and Oceanic Technology, 21,2004,9951006. [9] P. Villegas, Flood modeling in Perfume River basin, Hue Province, Vietnam, Master's Thesis, International Institute for Geo-information Science and Earth Observation, 2004. [lo] A. Ershadi and H. f i a b a n i , Applications of Remote Sensing, GIs and River Basin Modeling in Integrated Water Resource Management of Kabul River Basin, ICID 21st European Regional Conference 2005, Frankfurt, Germany, 2005, 1-10. [ l l ] N. Clerici, L. Boschetti, H. Eva, and J. Gregoire, Assessing vegetation fires activities and its drivers in west-central Africa using MODIS and TRMM data, IEEE Geoscience and Remote Sensing Symposium (IGARSS), 2004, V.3, pp. 2087-2090. [12] ESRI web site, http://www.esri.com . [13] Global Mapper web site, http://www.globalmapper.com/ . [14] S. R. Young, Understanding and Quantifiing Hazards, a report prepared for the UK Department for International Development, 2004. [15] N. Pollack, W. Teng, G. Serafino, and L. Chiu, GIs for expanding the application potential of TRMM data,
18th International Conference on IIPS at the 2002 AMS Annual Meeting, 2002, Orlando, Florida, paper 53.2. [16] J. Behnke, T. H. Watts, B. Kobler, and D. Lowe, EOSDIS petabyte archives: tenth anniversary, Proceedings of the 22nd IEEE / 13th NASA Goddard Conference on Mass Storage Systems and Technologies (MSST), 2005, Monterey, California. [17] ESRI, ArcGIS Desktop 9.2 functionality matrix, 2006, www.esri.com. [l8] N. Ritter and M. Ruth, The GeoTIFF data interchange standard for raster geographic images, International Journal of Remote Sensing, 18(7), 1997, 1637-1647. [19] F. Warmerdam, GeoTIFF Revision 1.0 Specification on the GeoTIFF homepage, http://remotesensing.org/geotiff/. Updated 8 Sept 2004. [20] Wikipedia, "Worldfile," http://en.wikipedia.org, downloaded 2006/02/08. [2 11 ESRI, ESRI Shapefile Technical Description: An ESRI White Paper, 1998. [22] ESRI, Software Strategy Q&A, ESRI International User Conference, 2005, http://events.esri.com/ ucl QandAI index.cfm?fuseaction = printall&ConferenceID = DA494555-CO4F-AO70-2407CB34C9CB9287. [23] N. Pollack, W. Teng, L. Chiu, G. Serafmo, and D. Wong, Operational production and distribution of GIScompatible remotely sensed data to facility their use, Proceedings of the American Society of Photogrammetry and Remote Sensing (ASPRS) 2000, Washington, DC, 1-4. [24] Pacific Disaster Center web site, http://www.pdc.org [25] E. J. Zipser, D. J. Cecil, C. Lui, S. W. Nesbitt, and D. P. Yorty, Where are the most intense thunderstorms on Earth?, Bulletin of the American Meteor. Soc., August 2006, 1057-1071.