First the Zero Phase algorithm is used to align the signals. Then, those samples of the aligned signals which only contain noise are eliminated. At last, the Zero ...
IMPROVING ALIGNMENT OF NOISY SIGNALS USING AN ITERATIVE ZERO PHASE METHOD R. Gil-Pita, M. Rosa-Zurera, R. Vicen-Bueno and M. Utrilla-Manso Departamento de Teor´ıa de la Se˜nal y Comunicaciones, Escuela Polit´ecnica Superior Universidad de Alcal´a, Ctra. Madrid-Barcelona, km. 33.600 28805, Alcal´a de Henares - Madrid (SPAIN) E-mails: {roberto.gil; manuel.rosa; raul.vicen; manuel.utrilla}@uah.es
ABSTRACT This paper deals with the study of the performance of different methods to align noisy one-dimensional signals shifted in time. The methods studied in this paper are the Maximum Position method, the Cross-correlation method and the Zero Phase method. Results show the best performance of the Zero Phase method for middle and high values of SNR. A statistical study is carried out in order to achieve a theoretical expression for the value of the performance of the Zero Phase method. This expression demonstrate the dependence of the accuracy of the method on the number of samples. So, a new method is proposed. First the Zero Phase algorithm is used to align the signals. Then, those samples of the aligned signals which only contain noise are eliminated. At last, the Zero Phase algorithm is again applied over the length-reduced profiles. Results show an improvement up to 48%. 1. INTRODUCTION In this paper we study the accuracy of various methods for the alignment of noisy High Range Resolution (HRR) radar signals. Due to the inner characteristics of the HRR signals, small variations in the distance to the target cause circular shifts of the received signal. Most of the classification algorithms (k-Nearest Neighbor, Multilayer Perceptrons, Radial Basis Function networks, Support Vector Machines, etc.) highly depend on shifts over the input signal. So, the alignment the signal previously to any classification technique or preprocessing stage is very important. The aligning algorithms are divided in terms of methodology in three groups: • Absolute alignment methods. In these methods each profile is aligned independently. So, a measure over each profile must be obtained in order to estimate the shift for aligning the signal. One of these methods uses the position of the maximum of the signal (Maximum Position method). Another alternative consists in using the position of the maximum of the crosscorrelation of the profile with a pattern signal (Cross-correlation method). Another possibility consists in using the shift property of the Fourier transform to obtain the shift (Zero Phase method). In this work we focus on this group, studying the performance of the Maximum Position algorithm, the Cross-correlation algorithm and the Zero Phase algorithm. • Relative alignment methods. They try to align the data set using the existing relationships among the patterns. Due to the need for a priori knowledge of the relationships, this kind of methods can’t be used in most of the classification problems. • Integrated alignment methods. The last group of alignment methods are not alignment methods themselves. They are included in the classification process. They are based on the design of translation invariant classifiers. The main example of this group of methods is known as Sliding Euclidean Distance, which consists in selecting the nearest pattern taking into account any possible slide of the signal. These classifiers use to This work has been supported by the ”Consejer´ıa de Educaci´on de la Comunidad de Madrid” (SPAIN), under Project 07T/0036/2003 1
have associated a very high computational cost, which make them unpractical in actual implementations. The absolute alignment of signals has been studied many times in the literature. In [1] methods based on the centroid based and the cross-correlation are reviewed. Centroid methods are very sensitive to noise, and obtain worse results than the cross-correlation based methods. In [2] and [3] cross-correlation methods applied to ultrasonic signals are studied, trying to find theoretical expressions for the shift estimation error over simple signals. The method for aligning the signals described in [4] is a variant of the cross-correlation method applied to HRR radar profiles alignment. In [5] a new HRR aligning method is proposed mixing the relative cross-correlation and the zero phase method. This paper deals with the application of the Zero Phase method to align HRR radar profiles. For comparison purposes, results with the Maximum Position method and the Cross-correlation method are included. The Maximum Position method proposes to align the signals using the position of the maximum value. So, this method is only useful when the signals show a clear global maximum value. This is the simplest method, both in terms of performance and computational cost. Therefore, it has been used many times in the literature. In HRR radar signal alignment, this method is based on the modeling of the signal with scatterers. In [6] a preprocessing method based on the extraction of the position of the main scatterer is proposed. Using the position of the main scatterer as reference, a new set of aligned profiles is obtained. The main disadvantage of this method is the high sensibility of the performance to the presence of noise. The Cross-correlation method is rather more complex than the first one. It is based on the value of the cross-correlation of the profiles. If the true signal x[n] were known, the relative shifts of a set of N signals can be determined by an optimal matched filtering. In this approach, cross-correlation analysis of each signal with respect to a template signal (equal to x[n]) would yield shift estimates. Since x[n] is unknown, an optimal matched filtering approach is not feasible. However, relative shifts can be estimated by a suboptimal matched filtering [7, 8], in which the true signal is approximated by the other signals of the available database. In a first approach, it is necessary to calculate the circular crosscorrelation of the signal with each profile in the database. Once the ˆ i j of the ith signal with each profile j ( j = 1, ..., M) relative shift � of the database is obtained, the estimated shift between the kth and jth signals is given by (1)[1]. � 1� ˆ ˆ mj −� ˆ mk ) kˆjk = 2� jk + ¦ (� (1) N m�= j,k This implementation is called the Complete Cross-correlation method, and the associated computational cost depends on the data set size (the number of cross-correlations needed are (M + 1)M/2, being necessaries 2N 2 simple operations to calculate a circular cross-correlation of two signals of length N). This fact makes this strategy unpractical in real-time applications.
Target 1
Target 2
Target 3
Target 5
Target 4
Target 6
16
32
Samples
48
64
82
96
112
128
752
1498
2217
2976
3704
4349
Profiles
(dB)
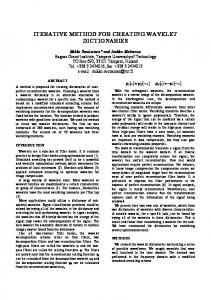
Figure 1: Radar profiles of the database. Each column of the image represents each one of the 4349 profiles. The black color is the higher value, and the white color is the lower value The Naive Cross-correlation method is a simplification of the method. This strategy takes the first signal as prototype signal, and each signal is aligned with respect to this profile. So, in order to align a profile, it is necessary to calculate the cross-correlation of the profile only with the first signal. With this simplified method the computational cost is relatively low and independent of the database size.
Figure 2: Error Standard Deviation versus SNR for the results obtained using the Zero Phase, the Complete Cross-correlation, the Naive Cross-correlation and the Maximum Position algorithms
F {x(t − �t)} = X(Z )e− jZ �t
In the discrete time case, where we are dealing with sampled functions x[n] (n = 0, ..., N − 1), a similar property holds for circularly shifted versions of x[n]: DFT {x[((n − m))N ]} = X(k)e− j2S km/N
2. DATABASE CHARACTERISTICS In order to evaluate the performance of the different methods for aligning HRR profiles, a database containing HRR radar profiles of six types of aircrafts has been used. The assumed target position is head-on with an azimuth range of 25o and elevations of −20o to 0o . The database contains 4349 profiles, and the length of each profile is 128. Figure 1 represents the available signals. It is clearly visible that the significant information is concentrated in the middle of each time segment, whereas towards the limit of the radar profiles we encounter nondiscriminatory values. Each profile of the database has been randomly shifted, in order to study the capabilities of the alignment methods. Therefore, the original data has been shifted using an uniform random integer variable from 0 to 127, which represents a complete misalignment of the profiles. The Signal to Noise Ratio (SNR) has been a parameter of the study. Due to the temporal localization of the signal, the SNR has been defined using the peak energy of the signal (2). In this paper, the SNR varies from 10 dB to 50 dB in steps of 1 dB. SNR = 10 log
� max{x[n]}2 �
Vn2
dB
(2)
The performance of the alignment methods is given by the error in the estimation of the shift of the signal. We have generated a correctly aligned database using the profiles without noise.
3. THE ZERO PHASE METHOD The Zero Phase method has been previously used for alignment of panoramic images [9]. The basis of this method is the shift property of the Fourier transform. For any function x(t) with Fourier transform X(Z ), the Fourier transform of x(t − �t) is given by (3):
(3)
(4)
So, for a discrete shift m, the phase I of the k-th component of the Discrete Fourier Transform (DFT) (k = 0, ..., N − 1) will be shifted by −2S km/N. These phase shifts can be used to obtain an estimation of the discrete shift m. A phase shift I + 2kS generates uncertainty, because it is taken like a phase shift I . This fact makes the measure of differences between two consecutive phase shifts necessary. So, if the phase shift for the component k is I (X(k)) = −2S km/N and the phase shift for the component k + 1 is I (X(k + 1)) = −2S (k + 1)m/N, then the difference between both phases is given by (5), and this value is annotated between 0 and 2S , solving the uncertainty.
I (X(k)) − I (X(k + 1)) =
2S m N
(5)
It is usual the use of k = 0. In order to study the shift of the signal, it is necessary to study the differences in phase of two consecutive DFT samples. Using k = 0, it is only necessary to study one phase, because the phase of the DC component (k = 0) is always zero. So, using this value of k, the value of the shift m can be obtained with expression (6). m=−
N (I (X(1))) 2S
(6)
Figure 2 shows the performance obtained for the studied methods using the available HRR database with different SNRs. Results show the Zero Phase algorithm improves the Maximum Position method and the Naive Cross-correlation method, and equals the Complete Cross-correlation method. Otherwise, the number of simple operations required to align one pattern using the Zero Phase method is approximately 2N +1, while the number of operations associated to the Complete Cross-correlation is N 2 (M + 1)M. Taking this into account, the best method from the studied to implement a real alignment system is clearly the Zero Phase method.
4. STATISTICAL ANALYSIS OF THE ZERO PHASE METHOD The k-th DFT sample of the profile can be determined as: F(k) =
N−1
¦
f [n]e− j2S kn/N
(7)
n=0
It is interesting to study the effect of the addition of white gaussian noise over the phase of the k-th DFT sample. Being f [n] = x[n] + r[n] the profile composed of a deterministic signal, x[n], with an additive white gaussian noise, r[n], with zero mean and variance equal to Vn2 , equation (7) can be written as: F(k) =
N−1
¦ (x[n] + r[n])e
− j2S kn N
= X(k) + R(k)
(8)
n=0
So, the probability density function associated to the random complex variable R(k) can be determined using the definition of the DFT: N−1
¦ r[n]e
R(k) =
− j2S kn N
Figure 3: Complex representation of the kth sample in the DFT domain 25
Zero Phase Analitical expression
(9)
n=0
Re{R(k)} =
N−1
¦ r[n]cos(2S kn/N)
(10)
n=0
Im{R(k)} = −
N−1
¦ r[n]sin(2S kn/N)
(11)
n=0
So, due to the characteristics of the DFT, if r[n] is uncorrelated, then Re{R(k)} and Im{R(k)} are be independent. Taking this into account, the probability density functions of the real and imaginary parts of R(k) are gaussians with zero mean and variances Vr (k)2 and Vi (k)2 where, respectively:
Vr (k)2 = Vn2 Vi (k)2 = Vn2
N−1
¦ cos2 (2S kn/N)
(12)
n=0
N−1
¦ sin2 (2S kn/N)
(13)
20 Error standard deviation
Taking R(k) = Re{R(k)} + jIm{R(k)}, we can rewrite (9) as follows:
15
10
5
0 10
15
20
25
30 SNR (dB)
35
40
45
50
Figure 4: Error Standard Deviation versus SNR for the experimental results and the theoretical results obtained using the Zero Phase algorithm
n=0
Summing up the squared sines and cosines in (12) and (13), we obtain Vr (k)2 = Vi (k)2 = N Vn2 /2 for k �= {0, N/2}, and Vr (k)2 = N Vn2 and Vi (k)2 = 0 for k = {0, N/2}. So, the probability density function associated with the DFT sample F(k) (k �= {0, N/2}) is complex gaussian with complex mean equal to X(k) and variance N Vn2 /2. In order to analyze the error in the estimation of the phase due to the noise, we must consider the complex noise decomposed in a component R p (k) in phase with the signal-without-noise X(k) and a term Rq (k) in quadrature. Both terms are gaussians with zero mean and variance equal to Vn2 N/2. Figure 3 represents this decomposition, representing the estimation error of the phase. So, the error introduced in the study of the phase is: tan(eI (k)) =
Rq (k) R p (k) + |X(k)|
(14)
The numerator is a random real variable with zero mean and variance N Vn2 /2, and the denominator is a random real variable with mean |X(k)| and variance N Vn2 /2. This expression gives another justification to the use of k = 0. In order to minimize the error on the estimation of the phase, |X(k)|
must be as high as possible. In many cases, low frequency coefficients use to have higher energy than high frequency ones. In order to study the influence of the parameters over the phase error we can consider N Vn2 /2