Babak Shahbaba. A thesis submitted in conformity with the requirements for the
degree of Doctor of Philosophy. Graduate Department of Public Health Sciences.
Improving classification models when a class hierarchy is available
by
Babak Shahbaba
A thesis submitted in conformity with the requirements for the degree of Doctor of Philosophy Graduate Department of Public Health Sciences University of Toronto
c 2007 by Babak Shahbaba Copyright
Abstract Improving classification models when a class hierarchy is available Babak Shahbaba Doctor of Philosophy Graduate Department of Public Health Sciences University of Toronto 2007 We introduce a new method for modeling hierarchical classes, when we have prior knowledge of how these classes can be arranged in a hierarchy. The application of this approach is discussed for linear models, as well as nonlinear models based on Dirichlet process mixtures. Our method uses a Bayesian form of the multinomial logit (MNL) model, with a prior that introduces correlations between the parameters for classes that are nearby in the hierarchy. Using simulated data, we compare the performance of the new method with the results from the ordinary MNL model, and a hierarchical model based on a set of nested MNL models. We find that when classes have a hierarchical structure, models that acknowledge such existing structure in data can perform better than a model that ignores such information (i.e., MNL). We also show that our model is more robust against missspecification of class structure compared to the alternative hierarchical model. Moreover, we test the new method on page layout analysis and document classification problems, and find that it performs better than the other methods. Our original motivation for conducting this research was classification of gene functions. Here, we investigate whether functional annotation of genes can be improved using the hierarchical structure of functional classes. We also introduce a new nonlinear model for classification, in which we model the joint distribution of response variable, y, and covariates, x, non-parametrically using Dirichlet process mixtures. In this approach, we keep the relationship between y and x linear within each component of the mixture. The overall relationship becomes ii
nonlinear if the mixture contains more than one component. We extend this method to classification problems where a class hierarchy is available. We use our model to predict protein folding classes, which can be arranged in a hierarchy. We find that our model provides substantial improvement over previous methods, which were based on Neural Networks (NN) and Support Vector Machines (SVM). Together, the results presented in this thesis show that higher predictive accuracy can be obtained using Bayesian models that incorporate suitable prior information.
iii
To my lovely wife Rezy None of this would be possible without your love and support
iv
Acknowledgements First and foremost, I would like to thank my supervisor Professor Radford Neal for sharing his wealth of knowledge and wisdom with me, supporting me throughout this journey, and teaching me almost everything I know about Statistics. He also taught me how to think freely and write clearly. I was tremendously fortunate to have him as my supervisor. I was very privileged to work with a great advisory committee. I thank Drs. Paul Corey and Celia Greenwood for their expertise, availability and commitment to education. I am also grateful to Drs. Steven MacEachern and Andrew Paterson for reading my thesis and providing valuable comments. I would also like to thank my parents, my wife, my sister, my brother, and my brotherin-law for their love and support. Their constant encouragement helped me throughout the pursuit of this degree. My sincere gratitude goes to Kevin Laven, Sam Roweis and Scott Leishman for providing the NIPS data, and Lijuan Cai and Thomas Hofmann for providing the processed WIPO-alpha dataset. I would also like to thank Ross King, Andreas Karwath, Amanda Clare and Luc Dehaspe for providing the processed E. coli datasets, and Johanna Rommens for helping me with the interpretation of our findings about E. coli genome. This research was supported by the Natural Sciences and Engineering Research Council of Canada. Professor Radford Neal holds a Canada Research Chair in Statistics and Machine Learning.
v
Contents
1 Overall introduction
1
1.1
Introduction . . . . . . . . . . . . . . . . . . . . . . . . . . . . . . . . . .
2
1.2
Outline of thesis . . . . . . . . . . . . . . . . . . . . . . . . . . . . . . . .
5
2 Classification models with a hierarchy-based prior
8
2.1
Introduction . . . . . . . . . . . . . . . . . . . . . . . . . . . . . . . . . .
9
2.2
Hierarchical Classification . . . . . . . . . . . . . . . . . . . . . . . . . .
11
2.3
Results for Synthetic Datasets . . . . . . . . . . . . . . . . . . . . . . . .
15
2.4
Results for Real Datasets . . . . . . . . . . . . . . . . . . . . . . . . . . .
20
2.4.1
Performance Measures . . . . . . . . . . . . . . . . . . . . . . . .
20
2.4.2
NIPS Dataset . . . . . . . . . . . . . . . . . . . . . . . . . . . . .
22
2.4.3
WIPO-alpha Dataset . . . . . . . . . . . . . . . . . . . . . . . . .
26
2.5
Conclusions and Future Directions
. . . . . . . . . . . . . . . . . . . . .
3 Gene function classification
27 30
3.1
Background . . . . . . . . . . . . . . . . . . . . . . . . . . . . . . . . . .
31
3.2
Results and Discussion . . . . . . . . . . . . . . . . . . . . . . . . . . . .
35
3.3
Conclusions . . . . . . . . . . . . . . . . . . . . . . . . . . . . . . . . . .
42
3.4
Methods . . . . . . . . . . . . . . . . . . . . . . . . . . . . . . . . . . . .
44
3.4.1
47
Implementation . . . . . . . . . . . . . . . . . . . . . . . . . . . . vi
4 Nonlinear classification using Dirichlet process mixtures
49
4.1
Introduction . . . . . . . . . . . . . . . . . . . . . . . . . . . . . . . . . .
50
4.2
Methodology . . . . . . . . . . . . . . . . . . . . . . . . . . . . . . . . .
54
4.3
Results for synthetic data . . . . . . . . . . . . . . . . . . . . . . . . . .
57
4.4
Results for protein fold classification . . . . . . . . . . . . . . . . . . . .
62
4.5
Extension to hierarchical classes . . . . . . . . . . . . . . . . . . . . . . .
66
4.6
Extension to multiple datasets . . . . . . . . . . . . . . . . . . . . . . . .
68
4.7
Conclusions and future directions . . . . . . . . . . . . . . . . . . . . . .
69
5 Overall discussion
72
Appendix A
76
Appendix B
79
B.1 The Gibbs sampler . . . . . . . . . . . . . . . . . . . . . . . . . . . . . .
79
B.2 The Metropolis algorithm . . . . . . . . . . . . . . . . . . . . . . . . . .
80
B.3 Slice sampling . . . . . . . . . . . . . . . . . . . . . . . . . . . . . . . . .
82
Appendix C
84
Appendix D
87
Bibliography
88
vii
List of Tables 2.1
Comparison of models on simulated data created based on Figure 2.2. Average log-probability (log-prob) and accuracy rate (acc) are estimated on the test sets. . . . . . . . . . . . . . . . . . . . . . . . . . . . . . . . .
2.2
18
Comparison of models on simulated data created based on Figure 2.3. Average log-probability (log-prob) and accuracy rate (acc) are estimated on the test sets. . . . . . . . . . . . . . . . . . . . . . . . . . . . . . . . .
2.3
19
Performance of models based on NIPS dataset. Here, “acc”, “pacc” and “∆-loss” refer to accuracy, parent accuracy and taxonomy-based loss respectively. Larger values are better except for ∆-loss. . . . . . . . . . . .
2.4
25
Performance of models based on WIPO-alpha dataset, section “D”. Here, “acc”, “pacc” and “∆-loss” refer to accuracy, parent accuracy and taxonomybased loss respectively. The SVM and hierarchical SVM (hSVM) are developed by Cai and Hoffmann (2004). Larger values are better except for ∆-loss. . . . . . . . . . . . . . . . . . . . . . . . . . . . . . . . . . . . . .
3.1
Comparison of models based on their predictive accuracy (%) using each data source separately. . . . . . . . . . . . . . . . . . . . . . . . . . . . .
3.2
28
37
Comparison of models based on their predictive accuracy (%) for specific coverage (%) provided in parenthesis. The C5 results and the coverage values are from King et al. (2001). . . . . . . . . . . . . . . . . . . . . . . viii
39
3.3
Accuracy (%) of models on the combined dataset with and without separate scale parameters. Results using SIM alone are provided for comparison. 40
3.4
Predictive accuracy (%) for different coverage values (%) of the corMNL model using all three sources with separate scale parameters. . . . . . . .
4.1
40
Simulation 1: the average performance of models based on 50 simulated datasets. The Baseline model assigns test cases to the class with the highest frequency in the training set. . . . . . . . . . . . . . . . . . . . .
4.2
60
Simulation 2: the average performance of models based on 50 simulated datasets. The Baseline model assigns test cases to the class with the highest frequency in the training set. . . . . . . . . . . . . . . . . . . . .
4.3
62
Performance of models based on protein fold classification data. NN and SVM use maximum likelihood estimation, and are developed by Ding and Dubchak (2001). . . . . . . . . . . . . . . . . . . . . . . . . . . . . . . .
4.4
Comparison of hierarchical models (linear and nonlinear) with non-hierarchical models (linear and nonlinear) based on protein fold classification data.
4.5
66
.
68
Comparison of hierarchical models (linear and nonlinear) with non-hierarchical models (linear and nonlinear) based on protein fold classification data. The covariates are obtained from four different feature sets: composition of amino acids, predicted secondary structure, hydrophobicity, and normalized varn der Waals volume. . . . . . . . . . . . . . . . . . . . . . . .
69
C.1 Comparison of direct functional annotation of several ORFs (whose function was unknown in 2001) with predicted functions using our corMNL model. In this table, we only present genes for which there is a close match between our predictions and the results from direct biological experiments. 85 ix
C.2 Comparison of direct functional annotation of several ORFs (whose function was unknown in 2001) with predicted functions using our corMNL model. In this table, we only present genes for which there is not a close match between our predictions and the results from direct biological experiments. . . . . . . . . . . . . . . . . . . . . . . . . . . . . . . . . . . .
x
86
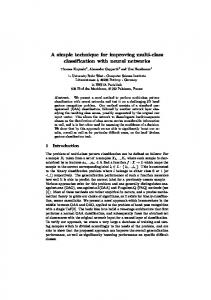
List of Figures 2.1
A part of a gene annotation hierarchy proposed by Riley (1993) for the E. coli genome. . . . . . . . . . . . . . . . . . . . . . . . . . . . . . . . . . .
2.2
10
The simple model used for the simulation study. The coefficient parameters for each classes are presented as a sum of parameters at different level of hierarchy. . . . . . . . . . . . . . . . . . . . . . . . . . . . . . . . . . .
17
2.3
A hypothetical hierarchy with a more complex structure. . . . . . . . . .
19
2.4
Hierarchical structure of document labels. . . . . . . . . . . . . . . . . .
22
2.5
Trace plots of the ARD hyperparameters, σl , for two covariates of the corMNL model applied to the NIPS dataset. . . . . . . . . . . . . . . . .
2.6
24
Trace plots of two overall scale hyperparameters, τm , for two nodes of the corMNL model for two nodes applied to the NIPS dataset. . . . . . . . .
24
3.1
A simple representation of the corMNL model. . . . . . . . . . . . . . . .
45
4.1
An illustration of our model for a binary (black and white) classification problem with two covariates. Here, the mixture has two components, which are shown with circles and squares. In each component, an MNL model separates the two classes into “black” or “white” with a linear decision boundary. . . . . . . . . . . . . . . . . . . . . . . . . . . . . . . . .
4.2
58
A random sample generated according to Simulation 2 with a3 = 0. The dotted line is the optimal boundary function. . . . . . . . . . . . . . . . . xi
61
4.3
A simple representation of our hierarchical classification model. . . . . .
67
A.1 The boundary lines obtained by the MNL model for a simulated three-way classification problem. As we can see, class 1 and class 2 are relatively more difficult to distinguish. . . . . . . . . . . . . . . . . . . . . . . . . . . . .
78
A.2 The boundary lines obtained by the treeMNL model for a simulated threeway classification problem. The boundaries are not linear between classes 1 and 3, and between classes 2 and 3. . . . . . . . . . . . . . . . . . . . .
xii
78
Chapter 1 Overall introduction
1
Chapter 1. Overall introduction
1.1
2
Introduction
In this research, we consider classification problems where classes have a hierarchical structure. We discuss both linear and nonlinear (based on Dirichlet process mixtures) hierarchical classification models. The hierarchy reflects our prior opinion with respect to the similarity of classes. Hierarchical classification problems of this sort are abundant in statistics and machine learning fields. One such problem, which is our original motivation for studying hierarchical classification schemes, is prediction of the biological functions of genes. These functions are usually presented in a hierarchical form starting with very general classes (eg, cell processes) and becoming more specific in lower levels of the hierarchy (eg, cell division or chromosome replication). There are many examples of hierarchical classes in the literature. Fox (1997) discusses one simple hierarchical classification problem regarding Canadian women’s labour-force participation. In this problem, the objective is to classify Canadian women to “working” and “non-working” (outside the home) groups. Working women are further classified to “full-time” and “part-time”. Husband’s income, presence of children in the household, and region of living were used as covariates. Another example, which has become increasingly important due to the exponential growth of information on the internet, is classification of documents (e.g., web pages). A standard benchmark dataset for this problem is one that contains 20000 documents from 20 different on-line newsgroups. The objective is to identify the newsgroup from which an article was taken, using the words appearing in that article. The newsgroups can be grouped into general classes such as “computer”, “science”, and “talk”. A general class such as science can be divided to more specific classes such as “electronics” and “space”. The dataset can be obtained from the UCI KDD repository at http://kdd.ics.uci.edu. We discuss some more examples in our papers (Chapters 2, 3, and 4), and evaluate our proposed method based on page region labelling and patent document classification problems. If we ignore the hierarchical structure of classes, we could use a simple multinomial
3
Chapter 1. Overall introduction logit (MNL) model for classification. This model has the following form: exp(αj + xβ j ) j 0 =1 exp(αj 0 + xβ j 0 )
P (y = j|x, α, β) = Pc
(1.1)
where c is the number of classes. For each class, j, there is a vector of p unknown parameters β j . The entire set of regression coefficients β = (β1 , ..., βc ) can be presented as a p × c matrix. The MNL model treats classes as unrelated entities. This is not, of course, an optimal approach if we know a priori that classes can be arranged on a hierarchy. The importance of using the information regarding the class hierarchy has been emphasized by many authors (e.g., Sattath and Tversky (1977); Fox (1997); Koller and Sahami (1997)). Several methods have been proposed for incorporating this information in classification models. A common approach is using a series of nested models (i.e., nested MNL models), which classify cases sequentially along the hierarchy. That is, for each intermediate node m in the hierarchy, a separate model is used to classify cases that belong to m into the child nodes of m (i.e., nodes that are immediately connected to m). We refer to this method as treeMNL. To understand why treeMNL may perform better when classes have a hierarchical structure, consider a three-way classification problem in which classes 1 and 2 are completely indistinguishable on the basis of available information, but they both can be easily separated from class 3. This is, of course, an extreme example. Assuming that the hierarchical structure is known to us a priori, we can use two nested models such that the first model separates class 3 from classes 1 and 2, and the second model separates only class 1 from class 2. Obviously, only the first model affects the overall performance (assuming the second model has a performance no worse than a random model). The first model is appropriately more parsimonious compared to a non-hierarchical model, which tries to classify objects to all three classes simultaneously (i.e., MNL). The treeMNL model can, therefore, provide better performance than the MNL model. The extreme example discussed above rarely exists in real life. In most problems,
Chapter 1. Overall introduction
4
similar classes can be distinguished to some degree. It is even possible that apparently similar classes are not in fact hard to distinguish. That is, the hierarchy is misspecified. As we will see later, this can be a major problem for the treeMNL model. Fox (1997) suggested using this approach only when there is substantial evidence to believe the hierarchy exists. In this research, we propose an alternative approach for incorporating the hierarchical structure in classification models. Using simulation studies, we show that unlike treeMNL, our approach is very robust against misspecification of the hierarchy. In our approach, the hierarchy is provided in the form of a prior. We use an MNL model with a prior that introduces correlations between the parameters for classes that are nearby in the hierarchy. For this purpose, we first use a different set of parameters for each branch of the hierarchy. In the final multinomial logit, we sum these parameters over all the branches starting from the root and leading to a specific class. Therefore, the more branches two categories share (i.e., the closer they are on the hierarchy), the larger number of their common parameters will be. This can in turn translate to a higher correlation between the parameters of multinomial logit model. The correlation will be negligible (i.e., classes are independent) if the common parameters are all practically zero. When the hierarchy actually provides additional information regarding the structure of classes, our approach performs better than the non-hierarchical model (i.e., MNL), and the nested hierarchical model (i.e., treeMNL). When the assumed hierarchical structure does not exist, our model has a very small penalty since it can reduce to a non-hierarchical model in such situations. Throughout this thesis, we refer to this model as corMNL. While MNL and corMNL use different priors, they both use the same model in which the relationship between response variable and covariates is assumed to be linear. If the linearity assumption does not hold, these models may have poor performance compare to alternative nonlinear models. We introduce a new model that is sufficiently flexible to capture nonlinear relationships. In this approach, we model the joint distribution
Chapter 1. Overall introduction
5
of response variable, y, and covariates, x, non-parametrically using Dirichlet process mixtures. We keep the relationship between y and x linear within each component of the mixture. The relationship becomes nonlinear over all components. We first use this method for modeling non-hierarchical classes. For this purpose, we use an MNL model in each component to capture the dependency of y on x. For classification problems where classes have a hierarchical structure, we replace the MNL model with corMNL.
1.2
Outline of thesis
This thesis is presented as a “journal format” dissertation. It is divided into 5 chapters: an overall introduction, three papers, and an overall discussion. Each paper is written to stand on its own, and therefore, includes a separate introduction, a methodology section, a results section, and a discussion section. The papers included in this thesis are: “Improving classification when a class hierarchy is available using a hierarchy-based prior”, which was published by Bayesian Analysis in 2007, “Gene function classification using Bayesian models with hierarchy-based priors”, which was published by BMC Bioinformatics in 2006, and “Nonlinear classification models using Dirichlet process mixtures”, which will be published as a technical report in the department of Statistics. In the next chapter, we present our first paper, which discusses the problem of hierarchical classification in general. We used simulated data to compare our model to MNL and treeMNL. The results from these simulation studies show that when classes have a hierarchical structure, models that acknowledge such existing structure in data (i.e., treeMNL and corMNL) can perform better than a model that ignores such information (i.e., MNL). We also show that our model is more robust against misspecification of class structure compared to the nested model. In this paper, we also looked at two real examples of hierarchical classification. The first example involves classifying regions of a page in an article, and the second example involves classifying patent documents. The
Chapter 1. Overall introduction
6
results based on these two problems confirmed that our model performs better than the other two alternative models. In Chapter 3, our second paper, we discuss the application of our method to gene function classification. An experimental approach to identifying gene function is based on eliminating or inhibiting expression of a gene and observing any alteration in the phenotype. However, since analysis of all genes for all possible functions is not possible at this current time, statistical models have been employed for this purpose. In this paper, we use our approach to predict the functional class of Open Reading Frames (ORFs) from the E. coli genome. An ORF is a part of a genome sequence that could potentially encode proteins. The covariates are based on several characteristics of protein sequences including phylogenic descriptors (SIM), sequence based attributes (SEQ), and predicted secondary structure (STR). Similar to the results in the previous paper, we find that our model has the best performance in terms of prediction accuracy. Moreover, all our models (hierarchical or non-hierarchical) provide substantially better predictions than a previous analysis based on the C5 decision tree algorithm. In our second paper, we also address the problem of combining different sources of information in gene function classification. Our approach is based on using separate scale parameters for different sources of data in order to adjust their relative weights automatically. This approach provides a higher accuracy rate when compared to models that use each data source (i.e., SIM, SEQ and STR) alone. In previous work by King et al. (2001), combining these three different datasets showed no additional benefit compared to using phylogenic descriptors alone. In the first two papers, we focus only on linear models. We expected that the same approach could be also used for nonlinear models. In Chapter 4, we present our third paper, which introduces a novel nonlinear model for classification based on Dirichlet process mixtures. Simulation studies are used to evaluate the performance of this method. We also apply our model to a real classification problem, where the objective is to identify
Chapter 1. Overall introduction
7
protein folds. Protein fold recognition plays an important role in predicting the function of new sequences. Folding classes of protein have a hierarchical structure. We show how our method can be extended to classification problems where a class hierarchy is available. Finally, Chapter 5 is devoted to a discussion and future directions. In this chapter, we provide an overall review of the three papers presented in the previous chapters, and discuss the connection between these papers. We also provide several suggestions on how to improve the proposed methods in future research. Other possible applications of these methods are also discussed. Several appendices are also included in the dissertation. Appendix A presents a brief discussion about the difference between the MNL model and the treeMNL model. Using a simple example, we show how the decision boundaries are different between these two models. In Appendix B, we provide an overview of different MCMC algorithms used in this dissertation. We discuss three main sampling methods, namely, the Gibbs sampler, the Metropolis method, and slice sampling. Appendix C presents the comparison between our predicted functions and the results from direct biological experiments for a subset of E. coli ORFs. Appendix D includes reprints of the published papers (Chapter 2 and Chapter 3).
Chapter 2 Classification models with a hierarchy-based prior This chapter appears in Bayesian Analysis, 2007, 2, Number 1, pp. 221-238.
8
Chapter 2. Classification models with a hierarchy-based prior
9
Abstract We introduce a new method for building classification models when we have prior knowledge of how the classes can be arranged in a hierarchy, based on how easily they can be distinguished. The new method uses a Bayesian form of the multinomial logit (MNL, a.k.a. “softmax”) model, with a prior that introduces correlations between the parameters for classes that are nearby in the tree. We compare the performance on simulated data of the new method, the ordinary MNL model, and a model that uses the hierarchy in a different way. We also test the new method on page layout analysis and document classification problems, and find that it performs better than the other methods.
2.1
Introduction
In this paper, we consider classification problems where classes have a hierarchical structure. The hierarchy reflects our prior opinion regarding similarity of classes. Two classes are considered similar if it is difficult to distinguish them from each other on the basis of the features available. The similarity of classes increases as we descend the hierarchy. Our original motivation for studying hierarchical classification schemes was prediction of the biological functions of genes. Functions are usually presented in a hierarchical form starting with very general classes (eg, cell processes) and becoming more specific in lower levels of the hierarchy (eg, cell division). Figure 2.1 shows a small part of the scheme proposed by Riley (1993) to catalogue the proteins of Escherichia coli. We discuss this application of our methods elsewhere (Shahbaba and Neal, 2006). Here, we discuss this problem more generally, and illustrate its use for two other examples of hierarchical classification. We look at the problem of classifying regions of a page in an article, using classes such as “Section Heading”, “Text”, or “Figure Caption”, which can be arranged in a hierarchy based on distinguishability. We also look at the problem of classifying patent documents relating to textiles, where again the classes can be arranged in a hierarchy in
Chapter 2. Classification models with a hierarchy-based prior
10
Gene Functions
q
)
Structural Elements
/
Ribosome Constituents
w
Cell Envelop
Cell Processes
/
Chromosome Replication
w
Cell Division
Figure 2.1: A part of a gene annotation hierarchy proposed by Riley (1993) for the E. coli genome.
which, for example, a high-level category of “Weaving” contains sub-classes for “Looms” and for “Weavers’ Tools”.
In a Bayesian model, we can incorporate prior knowledge of the class hierarchy using a suitable prior distribution over parameters of the model. In this paper, we introduce a new method of this sort for the multinomial logit (MNL) model, in which the regression coefficients for classes that are nearby in the hierarchy are correlated in the prior.
This paper is organized as follows. In Section 2.2, simple classification models and their extensions for analysing hierarchical classes are discussed. In Section 2.3, using simulated data, we compare the performance of our model, the ordinary MNL model, and an alternative model that uses the hierarchy in a different way. In Section 2.4 we compare the same models on the page region labelling and patent document classification problems. The last section summarizes our findings and presents some ideas for future research.
Chapter 2. Classification models with a hierarchy-based prior
2.2
11
Hierarchical Classification
Consider a classification problem in which we have observed data for n cases, (x(1) , y (1) ), (i)
(i)
...,(x(n) , y (n) ), where x(i) = (x1 , ..., xp ) is the vector of p covariates (features) for case i, and y (i) is the associated class. Our goal is to classify future cases for which the class membership is unknown but the covariates are available. For binary classification problems, a simple logistic model can be used: P (y = 1|x, α, β) =
exp(α + xβ) 1 + exp(α + xβ)
(2.1)
Here, α is the intercept, β is a p × 1 vector of unknown parameters and xβ is its inner product with the covariate vector. When there are three or more classes, we can use a generalization known as the multinomial logit (MNL) model (called “softmax” in the machine learning literature): exp(αj + xβ j ) j 0 =1 exp(αj 0 + xβ j 0 )
P (y = j|x, α, β) = Pc
(2.2)
where c is the number of classes. For each class, j, there is a vector of p unknown parameters β j . The entire set of regression coefficients β = (β1 , ..., βc ) can be presented as a p×c matrix. This representation is redundant, since one of the β j ’s can be set to zero without changing the set of relationships expressible with the model, but removing this redundancy would make it difficult to specify a prior that treats all classes symmetrically. For this model we can use the following priors: αj |η ∼ N (0, η 2 ) βjl |τ ∼ N (0, τ 2 ) η −2 ∼ Gamma(v, V ) τ −2 ∼ Gamma(w, W ) where j = 1, ..., c and l = 1, ..., p.
Chapter 2. Classification models with a hierarchy-based prior
12
The MNL model treats classes as unrelated entities without any hierarchical structure. This is not always a realistic assumption. In many classification problems, like those discussed above, one can arrange classes in a hierarchical form analogous to the hierarchy of species arranged in genera, families, etc. If the classes have in fact the assumed structure, one would expect to obtain a higher performance by using this additional information. A special case is when the classes are ordered (e.g., education level). For these problems a more parsimonious model (e.g., cumulative logit model) with improved power can be used (Agresti, 2002). The importance of using the hierarchy in classification models has been emphasized by many authors (e.g., Sattath and Tversky, 1977; Fox, 1997; Koller and Sahami, 1997). One approach for modelling hierarchical classes is to decompose the classification model into nested models (e.g., logistic or MNL). Nested MNL models are extensively discussed in econometrics (e.g., Sattath and Tversky, 1977; McFadden, 1980) in the context of estimating the probability of a person choosing a specific alternative (i.e., class) from a discrete set of options (e.g., different modes of transportation). These models, known as discrete choice models, aim at forecasting and explaining human decisions through optimizing an assumed utility (preference) function, which is different from our aim of maximizing classification accuracy. Goodman (2001) showed that using hierarchical classes can significantly reduce the training time of maximum entropy-based language models and results in slightly lower perplexities. He illustrated his approach using a word labelling problem, and recommended that instead of predicting words directly, we first predict the category to which the word belongs, and then predict the word itself. Such a two-level hierarchical model was also used by Weigend et al. (1999) for document classification. They evaluated their model on the Reuters-22173 corpus and showed significant improvement, especially for rare classes. For hierarchical classification problems with simple binary partitions, Fox (1997) sug-
Chapter 2. Classification models with a hierarchy-based prior
13
gested using successive logistic models for each binary class. In Figure 2.2 below, for example, these partitions are {12, 34}, {1, 2}, and {3, 4}. The resulting nested binary models are statistically independent, conditioned on the upper levels. The likelihood can therefore be written as the product of the likelihoods for each of the binary models. For example, in Figure 2.2 we have P (y = 1|x) = P (y ∈ {1, 2}|x) × P (y ∈ {1}|y ∈ {1, 2}, x)
(2.3)
Restriction to binary models is unnecessary. At each level, classes can be divided into more than two subsets and MNL can be used instead of logistic regression. We refer to methods based on decomposing the tree structure into nested MNL models as treeMNL. Consider a parent node, m, with cm child nodes, representing sets of classes defined by Sk , for k = 1, ..., cm . The portion of the nested MNL model for this node has the form: exp(αmk + xβ mk ) P (y ∈ Sk |x, αm , β m ) = Pcm k0 =1 exp(αmk0 + xβ mk0 ) αmk |ηm
2 ∼ N (0, ηm )
2 βmkl |τm ∼ N (0, τm ) −2 ηm ∼ Gamma(vm , Vm ) −2 τm ∼ Gamma(wm , Wm )
where l = 1, ..., p. We calculate the probability of each end node, j, by multiplying the probabilities of all intermediate nodes leading to j. In contrast to this treeMNL model, Mitchell (1998) showed that the hierarchical naive Bayes classifier is equivalent to the standard non-hierarchical classifier when the probability terms are estimated by maximum likelihood. To improve the hierarchical naive Bayes model, McCallum et al. (1998) suggested to smooth parameter estimates of each end node by shrinking its maximum likelihood estimate towards the estimates of all its ancestors in the hierarchy. More recently, new hierarchical classification models based on large margin principals, specifically support vector machine (SVM), have been proposed
Chapter 2. Classification models with a hierarchy-based prior
14
(Dumais and Chen, 2000; Dekel et al., 2004; Cai and Hoffmann, 2004; Tsochantaridis et al., 2004; Cesa-Bianchi et al., 2006). Dekel et al. (2004) introduced a large margin hierarchical classification model that uses the sum of parameters along the tree for classifying cases to the end nodes. These parameters are estimated based on a set of classifiers that assign cases to the intermediate nodes. Cai and Hoffmann (2004) suggested a similar approach based on the generalization of multiclass SVM. We also use sums of parameters along paths in the tree, but in a rather different way from this past work.
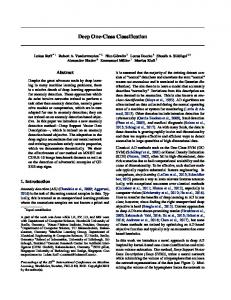
Our new framework for modeling hierarchical classes is illustrated in Figure 2.2, which shows a hierarchical classification problem with four classes. For each branch in the hierarchy, we define a different set of parameters. In Figure 2.2, these parameters are denoted as φ11 and φ12 for branches in the first level and φ21 , φ22 , φ23 and φ24 for branches in the second level. We assign objects to one of the end nodes using an MNL model (Equation 3.1) whose regression coefficients for class j are represented by the sum of parameters on all the branches leading to that class. In Figure 2.2, these coefficients are β1 = φ11 + φ21 , β2 = φ11 + φ22 , β3 = φ12 + φ23 and β4 = φ12 + φ24 for classes 1, 2, 3 and 4 respectively. Sharing the common terms, φ11 and φ12 , introduces prior correlation between the parameters of nearby classes in the hierarchy.
In our model, henceforth called corMNL, φ’s are vectors with the same size as β’s. We assume that, conditional on higher level hyperparameters, all the components of the φ’s are independent, and have normal prior distributions with zero mean. The variances of these components are regarded as hyperparameters, which control the magnitudes of coefficients. We use one hyperparameter for each non-terminal node. When a part of the hierarchy is irrelevant, we hope the posterior distribution of its corresponding hyperparameter will be concentrated near zero, so that the parameters it controls will also be close to zero.
Chapter 2. Classification models with a hierarchy-based prior
15
In detail, the prior we use is as follows: αj |η
∼ N (0, η 2 )
2 φmkl |τm ∼ N (0, τm )
η −2 ∼ Gamma(v, V ) −2 ∼ Gamma(wm , Wm ) τm
Here, j = 1, . . . , c indexes classes, and φmkl refers to the parameter related to covariate xl and branch k of node m. The φ parameters of all the branches that share the same node are controlled by one hyperparameter, τm , which controls the degree to which that portion of the hierarchy is active. In Figure 2.2, for example, when the hyperparameters in the first level are small (compared to the hyperparameters in the second level), the model reduces to simple MNL. In contrast, when these hyperparameters are relatively large, the model reinforces our assumption of hierarchical classes. By introducing prior correlations between parameters for nearby classes, we can better handle situations in which these classes are hard to distinguish. If the hierarchy actually does provide information about how distinguishable classes are, we expect that performance will be improved. This would be especially true when the training set is small and the prior has relatively more influence on the results. Using an inappropriate hierarchy will likely lead to worse performance than a standard MNL model, but since the hyperparameters can adapt to reduce the prior correlations to near zero, the penalty may not be large.
2.3
Results for Synthetic Datasets
So far, we have discussed three alternative models: MNL, treeMNL, and corMNL. We first compare these models using a synthetic four-way classification problem with two covariates. Data are generated from each of these models in turn, and then fit with each
Chapter 2. Classification models with a hierarchy-based prior
16
model in order to test the robustness of the models when applied to data generated from other models. All regression parameters are given normal priors with mean zero. For the MNL model, the standard deviation for all the intercepts, η, and the standard deviation for the rest of coefficients, τ , have the following priors: η −2 ∼ Gamma(1, 10)
(0.16, 0.38, 1.98)
τ −2 ∼ Gamma(1, 1)
(0.52, 1.20, 6.27)
We use the parameterization of the Gamma distribution in which Gamma(a, b) has density f (x|a, b) = [ba Γ(a)]−1 xa−1 e−x/b , for which the mean is ab and the standard deviation is a1/2 b. The 2.5, 50 and 97.5 percentiles of τ and η are shown in parenthesis. For the treeMNL and corMNL models, we assume that classes are arranged in a hierarchical form as shown in Figure 2.2. This hierarchy implies that while it might be easy to distinguish between groups {1, 2} and {3, 4}, further separation of classes might not be as easy. As mentioned above, the treeMNL model for this hierarchy is comprised of three nested logistic models. These models are: P (y ∈ {1, 2}|α1 , β1 , x), P (y = 1|α2 , β2 , x, y ∈ {1, 2}) and P (y = 3|α3 , β3 , x, y ∈ {3, 4}). The priors for the treeMNL and corMNL models are discussed in section 2. The variances of the regression parameters, β, in treeMNL and of the φ’s in corMNL are regarded as hyperparameters. For these two models, one hyperparameter controls all the parameter emerging from the same node. These hyperparameters are given the following prior distributions: η −2 ∼ Gamma(1, 10)
(0.16, 0.38, 1.98)
τ1−2 ∼ Gamma(1, 5)
(0.23, 0.54, 2.82)
τ2−2 ∼ Gamma(1, 20)
(0.05, 0.12, 0.63)
τ3−2 ∼ Gamma(1, 20)
(0.05, 0.12, 0.63)
Here, τ1 , τ2 and τ3 correspond to nodes 1, 2, and 3 respectively (Figure 2.2). These parameters have a narrower prior compared to τ in the MNL model. This is to account
Chapter 2. Classification models with a hierarchy-based prior
17
��
1
��
φ11
φ12
��
��
2
3
��
φ21
��
φ22
Class 1 Class 2 β1 = φ11 + φ21 β2 = φ11 + φ22
φ23
φ24
Class 3 Class 4 β3 = φ12 + φ23 β4 = φ12 + φ24
Figure 2.2: The simple model used for the simulation study. The coefficient parameters for each classes are presented as a sum of parameters at different level of hierarchy.
for the fact that the role of β in the MNL model is played by more than one parameter in treeMNL and corMNL. Moreover, the regression parameters in the second level of hierarchy have a relatively smaller standard deviation τ . As a result, these parameters tend to be smaller, making separation of class 1 from 2 and class 3 from 4 more difficult. We do three tests, in which we assume that each of the MNL, treeMNL and corMNL is the correct model. This allows us to see how robust each model is when data actually come from a somewhat different model. For each test, we sample a set of parameters from the prior distribution of the corresponding model. Pairs of data items (x(i) , y (i) ) are (i)
(i)
generated by first drawing 10000 independent samples x1 , x2 from the uniform(−5, 5) distribution and then assigning each data item to one of the four possible classes. The assignment is either based on a multinomial model (for data generated from MNL and corMNL) or based on successive logistic models (for data generated from treeMNL). All three models were trained on the first 100 data items and tested on the remaining 9900 items. The regression coefficients were sampled from their posterior distribution using MCMC methods with single-variable slice sampling (Neal, 2003), using the “stepping out” procedure to find an interval around the current point, and then the “shrinkage”
Chapter 2. Classification models with a hierarchy-based prior
18
Data N=100
Method
MNL
treeMNL
corMNL
log-prob
acc
log-prob
acc
log-prob
acc
MNL
-0.7958
67.1
-0.8918
58.4
-0.9168
59.4
treeMNL
-0.8489
65.0
-0.8770
58.7
-0.9113
59.4
corMNL
-0.7996
67.1
-0.8797
58.6
-0.9075
59.5
Table 2.1: Comparison of models on simulated data created based on Figure 2.2. Average log-probability (log-prob) and accuracy rate (acc) are estimated on the test sets. procedure to sample from this interval. Since the hyperparameters were given conjugate priors, direct Gibbs sampling could be used for them. For all tests we ran 1000 MCMC iterations to sample from the posterior distributions. We discarded the initial 250 samples and used the rest for prediction. Performance on the test set is measured in terms of average log-probability (based on the estimated probability of the correct class) and accuracy rate (defined as the percentage of the times the correct class is predicted). We make predictions based on the posterior predictive probabilities. The above procedure was repeated 100 times. Each time, new regression parameters were sampled from priors and new pairs of data items were created based on the assumed models. The average results (over 100 repetitions) are presented in Table 2.1. In this table, each column corresponds to the model used for generating the data and each row corresponds to the model used for building the classifier. As we can see, the diagonal elements have the best performance in each column. That is, the model whose functional form matches the data generation mechanism performs significantly better than the other two models (all p-values based on average log-probability are less than 0.01 using a paired t-test with n = 100). Moreover, the results show that when the samples are generated according to the MNL model (i.e., classes are unrelated), corMNL has a significantly (p-value < 0.001) better performance compared to treeMNL. When treeMNL is used to generate data, corMNL performs only slightly worse than treeMNL. The conclusions remain the same when we use different priors and ranges of covariates.
Chapter 2. Classification models with a hierarchy-based prior
19
6 7 1
2
8
3 4 5
Figure 2.3: A hypothetical hierarchy with a more complex structure. Data N=100
Method
MNL
treeMNL
corMNL
log-prob
acc
log-prob
acc
log-prob
acc
MNL
-0.2539
89.9
-0.3473
87.7
-0.3106
88.7
treeMNL
-0.6837
76.9
-0.2898
90.3
-0.3614
87.9
corMNL
-0.2910
89.7
-0.2854
90.1
-0.2841
90.3
Table 2.2: Comparison of models on simulated data created based on Figure 2.3. Average log-probability (log-prob) and accuracy rate (acc) are estimated on the test sets.
While statistically significant, the results presented in Table 2.1 might not be significant for some practical purposes. This is mostly due to the simplicity of the hierarchical structure. We repeated the above tests with a more complex hierarchy, shown in Figure 2.3. For this problem we used four covariates randomly generated from the uniform(0, 1) distribution. In all three models, we used the same prior as before for the intercepts. For the MNL model we set τ −2 ∼ Gamma(1, 1). The hyperparameters of treeMNL and corMNL were given Gamma(1, 5), Gamma(1, 20) and Gamma(1, 100) priors for the first, second and third level of the hierarchy respectively. Table 2.2 shows the average results over 100 datasets for each test. As we can see, the differences between models are more accentuated. When data are generated by other models, corMNL again performs well, being outperformed only by the true model. When data come from treeMNL, the results from corMNL are very close to those of the true
Chapter 2. Classification models with a hierarchy-based prior
20
model (i.e., treeMNL), and are actually better for log-probability, though this must of course be due to chance, and is not statistically significant. In contrast, treeMNL’s performance on data generated by corMNL is substantially worse than corMNL’s performance, and is also worse than that of the non-hierarchical MNL model.
2.4
Results for Real Datasets
In this section, we test our approach on two real classification tasks. The first task is labelling the regions of a page using a predefined set of labels. The dataset used for this problem was collected by Laven et al. (2005) and is derived from the page images of 58 articles (460 pages) appearing in the proceedings of the Neural Information Processing Systems (NIPS) conference in 2001 and 2002. The second task is classification of documents into different groups based on their contents. For this task we use patent documents released by World Intellectual Property Organization (WIPO). The MATLAB files for MNL, treeMNL and corMNL, along with the NIPS dataset, are available online at http://www.utstat.utoronto.ca/babak.
2.4.1
Performance Measures
To compare the performance of different models, we use average log-probability and accuracy rate as described above. We also employ several other measurements including macroaverage F1 (van Rijsbergen, 1972), parent accuracy, precision, and taxonomy-based loss (Cai and Hoffmann, 2004). F1 is a common measurement in document labelling and is defined as: F1
J 2Aj 1X = J j=1 2Aj + Bj + Cj
where Aj is the number of cases which are correctly assigned to class j, Bj is the number cases incorrectly assigned to class j, and Cj is the number of cases which belong to the
Chapter 2. Classification models with a hierarchy-based prior
21
class j but are assigned to other classes. The taxonomy-based loss is equal to half the distance between the predicted and the actual class in the tree. Parent accuracy is accuracy after grouping the end nodes with the same parent. While accuracy measurements are based on the top-ranked (based on the posterior predictive probabilities) category only, precision measures the quality of ranking and is defined as follows:
n
� 1 1 X� precision = n i=1 |y : P (y|x(i) ) ≥ P (y (i) |x(i) )|
Here, y ranges over all classes and y (i) is the correct class of case i. The denominator is, therefore, the number of classes with equal or higher rank compared to the correct class. Except for average log-probability and precision, all these measurements require that each test case be assigned to one specific class. For this purpose, we assigned each test case to the end node with the highest posterior predictive probability, as would be optimal for a simple 0/1 loss function. It is, of course, possible to tailor predictions to different performance measures. For example, to improve the parent accuracy, we can still use the 0/1 loss function but make prediction based on the posterior predictive probability of parent nodes. For the taxonomy-based loss, we can predict the class that minimizes the expected distance when a case is misclassified. We tried these tailored predictions, but since the improvements were negligible, we report only the results based on classifying to the end node with highest predictive probability. To provide a baseline for interpreting the results, for each task we present the performance of a model that ignores the covariates and whose likelihood is solely based on the observed frequency of classes. For this model, we use a vague Dirichlet prior with parameter 1 for all classes. This is a conjugate prior for multinomial parameters. The posterior distribution is also a Dirichlet distribution with parameter nj + 1 for class j. Here, nj is the frequency of class j in the training set.
22
Chapter 2. Classification models with a hierarchy-based prior 1
2
3 Abst. Auth. Eq. Eq.# Main Decoration List Title Sec. Subsec. 6 Head. Head. Table
5
Text
4
Ref.
9
Code
Image
8 Footnote
7
Bullet Item
Graph Fig.
Fig. Table Cap. Cap.
Figure 2.4: Hierarchical structure of document labels.
2.4.2
NIPS Dataset
As mentioned above, the NIPS dataset contains page images of 58 articles. Each page was segmented to several regions, and each region was manually classified to one of 19 possible classes. Figure 2.4 presents these classes in a hierarchical form. The hierarchy is based on our beliefs regarding how difficult it is to separate classes from each other using the available covariates. The covariates are 59 features such as the location of the region on the page and the density of the ink inside the region. We normalized all features so they have zero mean and standard deviation 1. Laven et al. (2005) considered the items from the same article as independent even though they clearly are not. Although this may cause overfitting problems, we follow the same assumption in order to produce comparable results. Laven et al. (2005) divided the dataset into a training set (3445 regions), and a test set (1473 regions). We also trained our three models (MNL, corMNL and treeMNL) on the same training set and evaluated performance on the test set.
Chapter 2. Classification models with a hierarchy-based prior
23
The coefficient parameters in the MNL models were given normal priors with mean zero. The variances of these parameters were regarded as hyperparameters. For this problem, since the number of covariates, p = 59, is relatively large, we use the Automatic Relevance Determination (ARD) method suggested by Neal (1996). ARD employs a hierarchical prior to determine how relevant each covariate is in classification of objects. In this method, one hyperparameter, σl , is used to control the variance of all coefficients, βjl (j = 1, ..., c), for covariate xl . If a covariate is irrelevant, its hyperparameter will tend to be small, forcing the coefficients for that covariate be near zero. We also use one hyperparameter, τ , to control the overall magnitude of the β’s in the MNL model, so that the the standard deviation of βjl is equal to τ σl . Therefore, while σl controls the relevance of covariate xl compared to other covariates, τ , controls the overall usefulness of all covariates in separating classes. In detail, the prior for the MNL model was as follows: αj |η ∼ N (0, η 2 )
j = 1, ..., 19
βjl |τ, σl ∼ N (0, τ 2 σl2 )
l = 1, ..., 59
η −2 ∼ Gamma(0.5, 1)
(0.63, 2.09, 46.31)
τ −2 ∼ Gamma(0.5, 20)
(0.14, 0.47, 10.07)
σl−2 ∼ Gamma(1, 10)
(0.16, 0.38, 1.98)
Similar priors are used for the parameters of treeMNL and corMNL. For these two models, we again used one hyperparameter, σl−2 ∼ Gamma(1, 10) to control all parame−2 ters related to covariate xl . We also used one scale parameter τm ∼ Gamma(0.5, 100),
with 2.5, 50 and 97.5 percentiles of 0.06, 0.21 and 5.57, for all parameters (β’s in treeMNL, φ’s in corMNL) sharing the same node m. The prior for the intercepts was the same as in the MNL model. We used Hamiltonian dynamics (Neal, 1993) for sampling from the posterior distribution of coefficients. To reduce the random walk aspect of sampling procedure, we use
Chapter 2. Classification models with a hierarchy-based prior
24
3.5 Height Height divided by width 3
2.5
2
σ 1.5
1
0.5
0
0
20
40
60
80
100 Iteration
120
140
160
180
200
Figure 2.5: Trace plots of the ARD hyperparameters, σl , for two covariates of the corMNL model applied to the NIPS dataset. 4 τ9 τ3
3.5
3
2.5
τ
2
1.5
1
0.5
0
0
20
40
60
80
100 Iteration
120
140
160
180
200
Figure 2.6: Trace plots of two overall scale hyperparameters, τm , for two nodes of the corMNL model for two nodes applied to the NIPS dataset.
Chapter 2. Classification models with a hierarchy-based prior log-prob
acc (%)
pacc (%)
precision (%)
F1 (%)
∆-loss
Baseline
-2.38
29.4
44.1
47.2
2.4
1.44
LR (ML)
−
88.1
−
−
−
−
MNL
-0.429
88.8
93.0
93.1
74.6
0.22
treeMNL
-0.466
87.2
91.7
92.3
68.9
0.23
corMNL
-0.405
89.5
93.6
93.5
76.0
0.20
25
Table 2.3: Performance of models based on NIPS dataset. Here, “acc”, “pacc” and “∆loss” refer to accuracy, parent accuracy and taxonomy-based loss respectively. Larger values are better except for ∆-loss. a reasonably large number of leapfrog steps (L = 500). The stepsizes, �’s, are set to 0.02 in order to maintain an acceptance rate of about 90%. In the MNL and corMNL models, new values are proposed for all regression parameters simultaneously. Nested MNL models in treeMNL are updated separately since they are regarded as independent models. The coefficient parameters within each nested model, however, are updated at the same time. Gibbs sampling was used for sampling from the posterior distribution of hyperparameters. Convergence of the Markov chain simulations was assessed by plotting the values of hyperparameters and the average log-likelihood (on training cases). We ran each chain for 2500 iterations, of which the first 500 were discarded. Simulating the Markov chain for 10 iterations took about 5 minutes for MNL, 4 minutes for treeMNL and 9 minutes for corMNL, using a MATLAB implementation on an UltraSPARC III machine. Table 2.3 compares the results from different models. In this table, we present the logistic regression (LR) model (based on maximum likelihood) developed by Laven et al. (2005) as the benchmark. As we can see, the corMNL model outperforms all other models. In contrast, treeMNL performs worse than the non-hierarchical MNL model. To illustrate the effect of hyperparameter σ in identifying relevant features, in Figure 2.5 we show the trace plots of σl for two covariates in the corMNL model. These hyperprameters correspond to two features of a region: “height” and “height divided by
Chapter 2. Classification models with a hierarchy-based prior
26
width”. The latter is clearly a more relevant feature for this task. To show the effects of the τm hyperparemeters, in Figure 2.6 we present the trace plots of τ3 and τ9 (i.e., scale parameter of node 3 and node 9 in Figure 2.4). As we can see, the scale parameter in node 3 is large compared to the scale parameter in node 9.
2.4.3
WIPO-alpha Dataset
We also evaluated our models on the WIPO-alpha dataset of patent documents (available at http://www.wipo.int/ibis/datasets). These documents are classified according to a standard taxonomy known as the International Patent Classification (available at http: //www.wipo.int/classifications/en/). The classes in this taxonomy are arranged in a four-level tree structure. At the highest level, documents are divided to 8 sections. For our experiment, we use the documents in section “D” (textile; paper), which has 1710 documents and a total of 160 classes. A pre-processed dataset based on these documents was provided by Cai and Hoffmann (2004). This dataset was generated by indexing the title and claim contents. Document parsing, tokenization, and term normalization were performed using the MindServer retrieval engine. The result is a set of word (i.e., token) counts for each document. Overall, there are 18077 unique words, whose counts are used as covariates. We use a square-root transformation for these covariates in order to emphasize more the occurrence of a word rather than its frequency. The number of covariates is quite large compared to the number of documents. Cai and Hoffmann (2004) devised a variable selection strategy which provides an optimal solution according to their SVM model. Here, we apply Principal Component Analysis (PCA). We first centred the covariates but did not scale them to have variance one. We then projected the covariates on the 300 principal component directions with the highest variance, and used these 300 principal component scores as covariates for our models, rather than the original covariates. For all models, we use the same priors as discussed in section 4.2, with the exception of ARD hyperparameters, σl . For these
Chapter 2. Classification models with a hierarchy-based prior
27
hyperparameters, we used σl−2 ∼ Gamma(2, 1), where l = 1, ..., 300 (2.5, 50 and 97.5 percentiles of σl are 0.45, 0.78 and 1.98). Compared to the priors used in section 4.2, these priors are more concentrated close to 1. We used these priors to minimize the effect of the ARD hyperparameters since the task of variable selection and relevance determination are mainly performed through PCA. As before, Hamiltonian dynamics (L = 100 and � = 0.005) and Gibbs sampling were used for sampling from the posterior distribution of coefficients and hyperparameters respectively. We ran each chain for 3000 iterations and discarded the first 500 iterations. For 10 iterations, the Markov chain simulations took about 6 minutes for MNL, 2 minutes for treeMNL and 10 minutes for corMNL. Table 2.4 compares the performance of different models. Following Cai and Hoffmann (2004), the results are presented based on a three-fold cross-validation where singular classes (i.e., nj = 1) appear only in the training set. As we can see, the corMNL model outperforms both MNL and treeMNL. Although the results reported for the corMNL model are better than the hiearchical SVM (hSVM) developed by Cai and Hoffmann (2004), the difference could be due to several factors, such as randomness of crossvalidation, transformation of variables, or the efficiency of variable selection strategy, as well as the different approach to using the hierarchy. For this problem, treeMNL did by most measures improve on the non-hierarchical MNL model, though it was not as good as corMNL.
2.5
Conclusions and Future Directions
In this paper, we have introduced a new approach for modelling hierarchical classes. Our experiments show that when the hierarchy actually does provide information regarding the similarity of classes, our approach outperforms both the simple MNL model and models based on decomposing the hierarchy into nested MNL models.
Chapter 2. Classification models with a hierarchy-based prior log-prob
acc (%)
pacc (%)
precision (%)
F1 (%)
∆-loss
-4.492
3.6
13.8
12.1
0.04
2.47
SVM
−
41.8
65.4
52.3
−
1.20
hSVM
−
42.8
69.1
54.4
−
1.08
MNL
-2.622
42.0
66.9
55.1
18.4
1.10
treeMNL
-2.408
42.3
68.7
56.0
17.7
1.05
corMNL
-2.397
43.4
69.8
56.9
18.7
1.02
Baseline
28
Table 2.4: Performance of models based on WIPO-alpha dataset, section “D”. Here, “acc”, “pacc” and “∆-loss” refer to accuracy, parent accuracy and taxonomy-based loss respectively. The SVM and hierarchical SVM (hSVM) are developed by Cai and Hoffmann (2004). Larger values are better except for ∆-loss. Our method can be applied to many classification problems where there is prior knowledge regarding the structure of classes. One such problem, which was our original motivation, is annotation of gene function. Using a prior based on the class hierarchy, we have been able to predict gene function with a higher accuracy (Shahbaba and Neal, 2006). For this problem, we used a more elaborate prior for hyperparameters. We also introduced a new method for combining different data sources, which is a common issue in gene function classification. More experiments are needed to compare corMNL with other approaches to utilizing the hierarchy, such as hSVM (Cai and Hoffmann, 2004). One difference in our approach is that it is based on a probability model for hierarchical prior information, not on any particular hierarchy-based loss function. If a good probability model is used, the probability distributions obtained should provide the information needed to obtain good performance with any loss function. So far, we have focused only on simple tree-like structures. There are other hierarchical structures that are more complex than a tree. For example, one of the most commonly used gene annotation schemes, known as Gene Ontology (GO), is implemented as a directed acyclic graph (DAG). In this structure a node can have more than one parent.
Chapter 2. Classification models with a hierarchy-based prior
29
Our method, as it is, cannot be applied to these problems, but it should be possible to extend the idea of summing coefficients along a path to the class in order to allow for multiple paths. In our approach, we considered only one structure for each hierarchical classification problem. However, we might sometimes be able to think of more than one possible class hierarchy. It is possible to generalize our method to multiple hierarchies. As for the generalization to DAG’s, it should be possible to sum coefficients along the multiple paths within different hierarchies. We can further use a set of hyperparameters to discover the relevance of each hierarchy. If we have prior knowledge that leads us to prefer some structures over others, we can incorporate that knowledge into the priors for these hyperparameters. Finally, although the results presented in this paper are for linear models, we expect that a similar approach can be used in non-linear models such as neural networks.
Chapter 3 Gene function classification This chapter appears in BMC Bioinformatics, 2006, 7:448.
30
Chapter 3. Gene function classification
31
Abstract We investigate whether annotation of gene function can be improved using a classification scheme that is aware that functional classes are organized in a hierarchy. The classifiers look at phylogenic descriptors, sequence based attributes, and predicted secondary structure. We discuss three Bayesian models and compare their performance in terms of predictive accuracy. These models are the ordinary multinomial logit (MNL) model, a hierarchical model based on a set of nested MNL models, and an MNL model with a prior that introduces correlations between the parameters for classes that are nearby in the hierarchy. We also provide a new scheme for combining different sources of information. We use these models to predict the functional class of Open Reading Frames (ORFs) from the E. coli genome. The results from all three models show substantial improvement over previous methods, which were based on the C5 decision tree algorithm. The MNL model using a prior based on the hierarchy outperforms both the non-hierarchical MNL model and the nested MNL model. In contrast to previous attempts at combining the three sources of information in this dataset, our new approach to combining data sources produces a higher accuracy rate than applying our models to each data source alone. Together, these results show that gene function can be predicted with higher accuracy than previously achieved, using Bayesian models that incorporate suitable prior information.
3.1
Background
Annotating genes with respect to the function of their proteins is essential for understanding the wealth of genomic information now available. A direct approach to identifying gene function is to eliminate or inhibit expression of a gene and observe any alteration in the phenotype. However, analysis of all genes for all possible functions is not feasible at present. Statistical methods have therefore been employed for this purpose. One
Chapter 3. Gene function classification
32
statistical approach attempts to predict the functional class of a gene based on similar sequences for which the function is known. The similarity measures used for this task are produced by computer algorithms that compare the sequence of interest against all other sequences with known function. Two commonly used algorithms are BLAST (Altschul et al., 1997) and FASTA (Pearson and Lipman, 1988). A problem with using such similarity measures is that a gene’s function cannot be predicted when no homologous gene of known function exists. To improve the quality and coverage of prediction, other sources of information can be used. For example, King et al. (2001) used a variety of protein sequence descriptors, such as residue frequency and the predicted secondary structure (the structure of hydrogen bonding between different residues within a single polypeptide chain). DeRisi et al. (1997), Eisen et al. (1998) and Brown et al. (2000) used gene expression data, on the assumption that similarly expressed genes are likely to have similar function. Marcotte et al. (1999) recommended an alternative sequence-based approach that regards two genes as similar if they are together in another genome. Deng et al. (2003) predict the function of genes from their network of physical interactions. To address some of the problems associated with similaritybased methods, such as their non-robustness to variable mutation rates Eisen (1998); Rost (2002), annotation of protein sequences using phylogenetic information has been suggested by some authors (e.g., Eisen et al., 1998; Sj¨olander, 2004; Engelhardt et al., 2005). In this approach, the evolutionary history of a specific protein, captured by a phylogenetic tree, is used for annotating that protein Eisen et al. (1998). The above-mentioned sources of data can be used separately, or as proposed by several authors (e.g., King et al., 2001; Pavlidis and Weston, 2001; Deng et al., 2004), they can be combined within a predictive model. A variety of statistical and machine learning techniques for making such predictions have been used in functional genomics. These include neighbourhood-count methods (Schoikowski et al., 2000), support vector machines (Brown et al., 2000), and Markov random fields (Deng et al., 2003). A common feature of
Chapter 3. Gene function classification
33
these models is that they treat classes as unrelated entities without any specific structure. The assumption of unrelated classes is not always realistic. As argued by Rison et al. (2000), in order to understand the overall mechanism of the whole genome, the functional classes of genes need to be organized according to the biological processes they perform. For this purpose, many functional classification schemes have been proposed for gene products. The first such scheme was recommended by Riley (1993) to catalogue the proteins of Escherichia coli. Since then, there have been many attempts to provide a standardized functional annotation scheme with terms that are not limited to certain types of proteins or to specific species. These schemes usually have a hierarchical structure, which starts with very general classes and becomes more specific in lower levels of the hierarchy. In some classification hierarchies, such as the Enzyme Commission (EC) scheme (IUBMB, 1992), levels have semantic values (Rison et al., 2000). For example, the first level of the EC scheme represents the major activities of enzyme like “transferaces” or “hydrolases”. In some other schemes, like the ones considered here, the levels do not have any uniform meaning. Instead, each division is specific to the parent nodes. For instance, if the parent includes “metabolism” functions, the child nodes could be the metabolism of “large” or “small” molecules. Rison et al. (2000) surveyed a number of these structures and compared them with respect to their resolution (total number of function nodes), depth (potential of the scheme for division into subsets) and breadth (number of nodes at the top level). All these hierarchies provide additional information that can be incorporated into the classification model. The importance of using the hierarchy in classification models has been emphasized by many authors (e.g., Sattath and Tversky, 1977; Fox, 1997; Koller and Sahami, 1997). One approach for modelling hierarchical classes is to decompose the classification model into nested models, one for each node of the hierarchy. Goodman (2001) showed that using nested models can significantly reduce the training time of maximum entropy-based language models and results in slightly lower perplexities. He
Chapter 3. Gene function classification
34
illustrated his approach using a word labelling problem, and recommended that instead of predicting words directly, we first predict the class to which the word belongs, and then predict the word itself. Weigend et al. (1999) also used a two-level hierarchical model for document classification. They evaluated their model on the Reuters-22173 corpus and showed significant improvement, especially for rare classes. For text classification, McCallum et al. (1998) proposed a hierarchical naive Bayes model that smoothes parameter estimates of a child node by shrinking toward its parents in order to obtain more robust parameter estimates. More recently, new hierarchical classification models based on large margin principles, specifically support vector machines (SVM), have been proposed (Dumais and Chen, 2000; Dekel et al., 2004; Cai and Hoffmann, 2004; Tsochantaridis et al., 2004; Cesa-Bianchi et al., 2006). Dekel et al. (2004) introduced a large margin hierarchical classification model that uses the sum of parameters along the tree for classifying cases to the end nodes. These parameters are estimated based on a set of classifiers that assign cases to the intermediate nodes. Cai and Hoffmann (2004) suggested a similar approach based on the generalization of multiclass SVM. Many approaches to using the hierarchy of gene functions have been proposed. Eisner et al. (2005) build multiple binary classifiers with training sets modified according to Gene Ontology (GO). For each classifier associated with a node, they regard a gene as a positive example if it belongs to that node, and as a negative example if it does not belong to the node, or to the node’s ancestors and descendants. Barutcuoglu et al. (2006) also use a set of independent classifiers, whose predictions are combined using a Bayes network defined based on the GO hierarchy. In the methods recommended by both Eisner et al. (2005) and Barutcuoglu et al. (2006), the individual classifiers are built independently. Although the classifiers are modified to become consistent, it is more natural to model classes simultaneously. Many authors have shown that learning a set of related tasks at the same time will improve the performance of models (e.g., Caruana, 1997; Zhang et al., 2005). King et al. (2001) attempted to use the additional
Chapter 3. Gene function classification
35
information from the hierarchical structure of gene functional classes by simply using different decision tree models for each level of the hierarchy. Clare and King (2003) investigated a modified decision tree model, in which assignment of a functional class to a node in the decision tree implies membership of all its parent classes. They evaluated this method based on Saccharomyces cerevisiae data and found that the modified version is sometimes better than the non-hierarchical model and sometimes worse. Blockeel et al. (2002) suggested an alternative modification of decision trees for hierarchical classification models. Their model uses a distance-based measure, where distances are derived from the hierarchy. Struyf et al. (2005) followed the same idea but advocated a different distance measure, which is easier to interpret and is guaranteed to be positive. They evaluated their approach based on different datasets available for Saccharomyces cerevisiae, and showed that their model has better precision than the hierarchical C4.5 model proposed by Clare and King (2003). In a previous paper (Shahbaba and Neal, 2007), we introduced an alternative Bayesian framework for modelling hierarchical classes. This method, henceforth called corMNL, uses a Bayesian form of the multinomial logit model (MNL), with a prior that introduces correlations between the parameters for classes that are nearby in the tree. We also discussed an alternative hierarchical model that uses the hierarchy to define a set of nested multinomial logit models, which we refer to as treeMNL. In this paper, we apply these methods (described further below in the methods section) to the gene function classification problem.
3.2
Results and Discussion
We used our Bayesian MNL, treeMNL and corMNL models to predict the functional class of Open Reading Frames (ORFs) from the E. coli genome. E. coli is a good organism for testing our method since many of its gene functions have been identified through
Chapter 3. Gene function classification
36
direct experiments. We used the pre-processed data provided by King et al. (2001). This dataset contains 4289 ORFs identified by Blattner et al. (1997). Only 2122 of these ORFs, for which the function was known in 2001, are used in our analysis. The functional hierarchy for these proteins is provided by Riley and Labedan (1996). This hierarchy has three levels, with the most general classes at level 1 and the most specific classes at level 3. For example, lipoate-protein ligase A (lplA) belongs to class ‘Macromolecule metabolism’ at level 1, to class ‘Macromolecule synthesis, modification’ at level 2, and to class ‘Lipoprotein’ at level 3. After excluding categories 0 and 7 at level 1, the data we used had 6 level 1 categories, 20 level 2 categories, and 146 level 3 categories. Since 2001 many additional gene functions have been determined by direct experiment (see King et al., 2004). However, we use the same dataset as King et al. (2001), with the same split of data into the training set (1410 ORFs) and test set (712 ORFs), in order to produce comparable results. King et al. (2001) further divided the training set into two subsets and used one subset as validation data to select a subset of rules from those produced by the C5 algorithm based on the other part of the training set. Our Bayesian methods do not require a validation set, so we did not subdivided the training set. The covariates are based on three different sources of information: phylogenic descriptors, sequence based attributes, and predicted secondary structure. Following King et al. (2001), we refer to these three sources of data as SIM, SEQ and STR respectively. Attributes in SEQ are largely based on composition of residues (i.e., the number of residues of type R) and of pairs of residues (i.e., the number of residue pairs of types R and S ) in a sequence. There are 933 such attributes (see Table 1 in King et al. (2001)). Information in SIM (see Table 2 in King et al. (2001)) and STR (see Table 3 in King et al. (2001)) is derived based on a PSI-BLAST (position-specific iterative BLAST) search with parameters e = 10, h = 0.0005, j = 20 from NRProt 05/10/99 database. King et al. (2001) used the Inductive Logic Programming (ILP) algorithm known as Warmr (Dehaspe et al., 1998) to produce binary attributes based on the iden-
37
Chapter 3. Gene function classification Accuracy (%)
SEQ
STR
SIM
Level 1
Level 2
Level 3
Level 1
Level 2
Level 3
Level 1
Level 2
Level 3
Baseline
42.56
21.21
8.15
42.56
21.21
8.15
42.56
21.21
8.15
MNL
60.25
33.99
20.93
50.98
25.14
15.87
69.10
45.79
30.76
treeMNL
59.27
34.13
18.26
52.67
27.39
16.29
67.70
45.93
30.34
corMNL
61.10
35.96
21.21
52.81
27.95
16.71
70.51
47.19
30.90
Table 3.1: Comparison of models based on their predictive accuracy (%) using each data source separately. tified frequent patterns (1 if the pattern is present and 0 otherwise) in SIM and STR data. The rules created by Warmr and their corresponding attributes can be found at http://www.aber.ac.uk/∼dcswww/Research/bio/ProteinFunction. There are 13799 such attributes generated for SIM and 18342 attributes for STR. As described below in the methods section, we reduced the dimensionality for each dataset using Principal Component Analysis (PCA). We used 100 components for SEQ, 100 components for STR, and 150 components for SIM. Table 3.1 compares the three models with respect to their accuracy of prediction at each level of the hierarchy. In this table, level 1 corresponds to the top level of the hierarchy, while level 3 refers to the most detailed classes (i.e., the end nodes). For level 3, we use a simple 0/1 loss function and minimize the expected loss by assigning each test case to the end node with the highest posterior predictive probability. We could use the same predictions for measuring the accuracy at levels 1 and 2, but to improve accuracy, we instead make predictions based on the total posterior predictive probability of nodes at level 1 and level 2. To provide a baseline for interpreting the results, for each task we present the performance of a model that ignores the covariates and simply assigns genes to the most common category at the given level in the training set. As we can see in Table 3.1, corMNL outperforms all other models. For the SEQ dataset, MNL performs better than treeMNL. Compared to MNL, the corMNL model
Chapter 3. Gene function classification
38
achieves a slightly better accuracy at level 3 and more marked improvements at level 1 and level 2. For the STR dataset, both hierarchical models (i.e., treeMNL and corMNL) outperform the non-hierarchical MNL. For this dataset, corMNL has a slightly better performance than treeMNL. For the SIM dataset, the advantage of using the corMNL model is more apparent in the first and second levels. For analysing these datasets, King et al. (2001) used a decision tree model based on the C5 algorithm. They selected sets of rules that had an accuracy of at least 50% with the coverage of at least two correct examples in the validation set. In Table 3.2, we compare the accuracy of our models to those of King et al. (2001). In order to make the results comparable, we used the same coverage values as they used. Coverage is defined as the percentage of test cases for which we make a confident prediction. In a decision tree model, these test cases can be chosen by selecting rules that lead to a specific class with high confidence. For our models, we base confidence on posterior predictive probability, which is defined as the expected probability of each class with regard to the posterior distribution of model parameters. We assign each test case to a class with the maximum posterior predictive probability. The higher this probability, the more confident we are in classifying the case. We rank the test cases based on how high the highest probability is, and for a coverage of g, we classify only the top g percent of genes. In Table 3.2, the coverage values are given in parenthesis. All three of our models discussed here substantially outperform the decision tree model. Overall, corMNL has better performance than MNL and treeMNL. In an attempt to improve predictive accuracy, King et al. (2001) combined the three datasets (SEQ, STR and SIM). Although one would expect to obtain better predictions by combining several sources of information, their results showed no additional benefit compared to using the SIM dataset alone. We also tried combining datasets in order to obtain better results. Initially, we used the principal components which we found individually for each dataset, and kept the number of covariates contributed from each
39
Chapter 3. Gene function classification Accuracy (%)
SEQ
STR
SIM
Level 1
Level 2
Level 3
Level 1
Level 2
Level 3
Level 1
Level 2
Level 3
(20)
(18)
(4)
(10)
(1)
(5)
(29)
(26)
(16)
C5
64
63
41
59
44
17
75
74
69
MNL
81
79
88
83
100
67
96
90
84
treeMNL
81
76
70
70
86
69
95
87
84
corMNL
84
82
89
83
100
73
97
90
82
Table 3.2: Comparison of models based on their predictive accuracy (%) for specific coverage (%) provided in parenthesis. The C5 results and the coverage values are from King et al. (2001). data source the same as before. Principal components from each dataset were scaled so that the standard deviation of the first principal component was 1. We did this to make the scale of variables from different data sources comparable while preserving the relative importance of principal components within a dataset. Using the combined dataset, all our models provided better predictions, although the improvement was only marginal for some predictions. We speculated that some of the covariates may become redundant after combining the data (i.e., are providing the same information). One may often obtain better results by removing redundancy and reducing the number of covariates. To examine this idea, we kept the number of principal components from SIM as before (i.e., 150) but only used the first 25 principal components from SEQ and STR. The total number of covariates was therefore 200. Reducing the number of covariates from SEQ and STR may also prevent them from overwhelming the covariates from SIM, which is the most useful single source. This strategy led to even higher accuracy rates compared to when we used the SIM dataset alone. The results are shown in Table 3.3 (middle section). It is worth noting that when SEQ and STR are used alone, using 25 principal components (rather than 100 before) results in lower accuracy (results not shown). To improve the models even further, we tried an alternative strategy in which different
40
Chapter 3. Gene function classification Accuracy (%)
SIM only
Combined dataset
Combined dataset
single scale parameter
separate scale parameters
Level 1
Level 2
Level 3
Level 1
Level 2
Level 3
Level 1
Level 2
Level 3
MNL
69.10
45.79
30.76
69.66
48.88
32.02
70.65
49.16
33.71
treeMNL
67.70
45.93
30.34
68.26
46.63
30.34
68.82
46.63
31.74
corMNL
70.51
47.19
30.90
71.49
49.30
32.87
72.75
49.16
34.41
Table 3.3: Accuracy (%) of models on the combined dataset with and without separate scale parameters. Results using SIM alone are provided for comparison. Accuracy (%)
Coverage (%) 5
10
20
50
90
100
Level 1
100
98
96
92
76
73
Level 2
100
98
96
71
53
49
Level 3
100
97
80
52
36
34
Table 3.4: Predictive accuracy (%) for different coverage values (%) of the corMNL model using all three sources with separate scale parameters. sources of data are combined such that their relative weights are automatically adjusted. As we can see in Table 3.3 (right section), this strategy, which is described in more detail in the methodology section, resulted in further improvements in the performance of the models. We also examined this approach with larger numbers of covariates. We found that when we increased the number of principal components for SEQ and STR back to the original 100, the accuracy of predictions mostly remained the same, though a few dropped slightly. In practice, we might be most interested in genes whose function can be predicted with high confidence. There is a trade-off between predictive accuracy and the percentage of the genes we select for prediction (i.e., coverage). Table 3.4 shows this trade-off for results on the test set from the corMNL model applied to the combined dataset. In this table, the accuracy rates for different coverage values are provided. As we can see, our model can almost perfectly classify 10% of the genes in the test set.
Chapter 3. Gene function classification
41
Finally, we trained the corMNL model on all ORFs with known function to annotate the function of unknown ORFs. Many of these ORFs, whose function was previously unknown, have been recently annotated using direct biological experiments. However, since the functional ontology of E. coli genome (provided by the Riley group) has changed over time, it is not possible to compare our results directly. King et al. (2004) also faced this problem. They evaluated their predictions manually for a subset of ORFs. We present our predictions for the same set of ORFs (see Appendix C). We use the MultiFun Classification System (http://genprotec.mbl.edu/) to obtain the function(s) associated with each ORF through direct experiments. For many of these ORFs, our prediction is closely related to the confirmed function. For example, we classified yojH (b2210) hierarchically as “Metabolism of small molecules” at the first level, “Degradation of small molecules” at the second level, and “Carbon compounds” at the third level. Through a direct experiment, the function of this gene was classified as “Metabolism”, “Energy metabolism (carbon)”, and “Tricarboxylic acid cycle”, at levels 1, 2, and 3 respectively. In some cases, such as ybhO (b0789), there is an exact match between our prediction (Macromolecule metabolism : Macromolecule synthesis : Phospholipids) and the function provided by MultiFun (Metabolism : Macromolecule (cellular constituent) biosynthesis : Phospholipid). For some other cases, although our prediction does not exactly match the functions provided by MultiFun Classification System, the results are comparable up to the first or second level of the hierarchy. For example, we predicted that ydeD (b1533) is “Transport/binding proteins” and belongs to “ABC superfamily”. Direct experiment also show that in fact this gene does belongs to the “Transport” group, however, it is more specifically in the “Major Facilitator Superfamily” (MFS) class instead of ABC. The comparison of our predictions with MultiFun Classification System is not always as straightforward as the examples provided above. For instance, we predicted bfd (b3337) to be in the “Metabolism of small molecules : Energy metabolism, carbon : Anaerobic respiration” categories. The
Chapter 3. Gene function classification
42
hierarchical function provided by MultiFun is “Cell processes : Adaptation to stress : Fe aquisition”. At the first glance, these two seem to be unrelated. However, it is known that oxygen induces stress and results in enormous changes in E. coli (Spiro and Guest, 1991; Guest et al., 1996). E. coli adapts to this environmental change by switching from aerobic respiration (which is its preferred metabolic mode) to anaerobic respiration. More detailed examination of these predictions will be needed to definitively evaluate performance. Our predictions for ORFs of unknown function (in 2001) are available online at http: //www.utstat.utoronto.ca/∼babak. In this website, we also provide the combined dataset for E. coli, and the MATLAB programs for MNL, treeMNL and corMNL along with their respective outputs for the test set.
3.3
Conclusions
In this paper, we investigated the use of hierarchical classification schemes to perform functional annotation of genes. If the hierarchy provides any information regarding the structure of gene function, we would expect this additional information to lead to better prediction of classes. To examine this idea, we compared three Bayesian models: a non-hierarchical MNL model, a hierarchical model based on nested MNL, referred to as treeMNL, and our new corMNL model, which is a form of the multinomial logit model with a prior that introduces correlations between the parameters of nearby classes. We found corMNL provided better predictions in most cases. Moreover, we introduced a new approach for combining different sources of data. In this method, we use separate scale parameters for each data source in order to allow their corresponding coefficients have appropriately different variances. This approach provided better predictions compared to other methods. While our emphasis in this paper was on the importance of using hierarchical schemes
Chapter 3. Gene function classification
43
in gene classification, we also showed that even the non-hierarchical Bayesian MNL model outperforms previous methods that used the C5 algorithm. Overall, our results are encouraging for the prospect of accurate gene function annotation, and also illustrate the utility of a Bayesian approach with problem-specific priors. For our experiments, we used the pre-processed datasets provided by King et al. (2001), who used the Warmr (Dehaspe et al., 1998) algorithm to generate binary attributes. It is conceivable that the accuracy of predictions can be further improved by using other data processing methods. Similarly, it is possible that a method other than our use of PCA might be better for reducing dimensionally before doing classification. In the E. coli dataset we used here, each ORF was assigned to only one function. In the more recent classification system provided by Riley’s group (http://genprotec.mbl. edu/), ORFs may belong to more than one class. For such problems, one can modify the likelihood part of the models described here so that if a training case belongs to several classes, its contribution to the likelihood is calculated based on the sum of probabilities of those classes. The functional hierarchies considered here are simple tree-like structures. There are other hierarchical structures that are more complex than a tree. For example, one of the most commonly used gene annotation schemes, known as Gene Ontology (GO), is implemented as a directed acyclic graph (DAG). In this structure a node can have more than one parent. Our method, as it is, cannot be applied to these problems, but it should be possible to extend the idea of summing coefficients along the path to the class in order to allow for multiple paths. Our approach can also be generalized to problems where the relationship among classes can be described by more than one hierarchical structure. For these problems, different hyperparameters can be used for each hierarchy and predictions can be made by summing the parameters in branches from all these hierarchies.
44
Chapter 3. Gene function classification
3.4
Methods
In this section, we first explain our models using a simple hierarchy for illustration. Consider Figure 3.1, which shows a hierarchical classification problem with four classes. By ignoring the hierarchy, a simple multinomial logit (MNL) can be used for classifying cases to one of the four classes. If the class for a case is denoted by y, and the covariates for this case are x, then the MNL model is P (y = j|x, α, β) = P4
exp(αj + xβ j )
j 0 =1
exp(αj 0 + xβ j 0 )
For each class j (for j = 1, ..., 4), there is an intercept αj and a vector of p unknown parameters β j , where p is the number of covariates in x. The inner product of these parameters with the covariate vector is shown as xβ j . Alternatively, we can use the hierarchy to decompose the classification model into nested models (e.g., MNL). For example, in Figure 3.1, class 1 can be modeled as the product of two independent MNL models: P (y = 1|x) = P (y ∈ {1, 2}|x) × P (y ∈ {1}|y ∈ {1, 2}, x) We refer to models in which the tree structure is used to define a set of nested MNL models as treeMNL. For modelling hierarchical classes, we propose a Bayesian MNL with a prior that introduces correlations between the parameters of nearby classes. Our model, called corMNL, includes a vector of parameters, φ, for each branch in the hierarchy (Figure 3.1). We assign objects to one of the end nodes using an MNL model whose regression coefficients for class j are represented by the sum of the parameters for all the branches leading to that class. Sharing of common parameters (from common branches) introduces prior correlations between the parameters of nearby classes in the hierarchy. This way, we can better handle situations in which these classes are hard to distinguish. In Figure 3.1, parameter vectors denoted as φ11 and φ12 are associated with branches in the first
45
Chapter 3. Gene function classification ��
1
��
φ11
φ12
��
��
2
3
��
φ21
φ22
Class 1 Class 2 β1 = φ11 + φ21 β2 = φ11 + φ22
��
φ23
φ24
Class 3 Class 4 β3 = φ12 + φ23 β4 = φ12 + φ24
Figure 3.1: A simple representation of the corMNL model.
level, and φ21 , φ22 , φ31 and φ32 with branches in the second level. We assign objects to one of the end nodes using an MNL model with regression coefficients β1 = φ11 + φ21 , β2 = φ11 + φ22 , β3 = φ12 + φ31 and β4 = φ12 + φ32 for classes 1, 2, 3 and 4 respectively. Note that the intercept parameters, αj , are not treated hierarchically. We first used these models (i.e., MNL, treeMNL and corMNL) to predict gene function using each data source (SIM, STR and SEQ) separately. Since the numbers of covariates in these datasets are large, we applied Principal Component Analysis (PCA). Prior to applying PCA, the variables were centred to have mean zero, but they were not rescaled to have variance one. We selected the first p components with the highest eigenvalues. The cutt-off, p, was set based on the plot of eigenvalues against PCs (i.e., the scree plot). Since there was not a clear cut-off point at which the magnitude of eigenvalues drops sharply, the plots could only help us to narrow down the appropriate values for p. We decided to choose a value at the upper end of the range suggested by the scree plot. We selected 100 components from SEQ, 100 components from STR, and 150 components from SIM. Principal components are derived solely based on the input space and do not necessarily provide the best set of variables for predicting the response variable. In order to find
Chapter 3. Gene function classification
46
the relevant variables (among the principal components) for the classification task, we use the Automatic Relevance Determination (ARD) method suggested by Neal (1996). ARD employs a hierarchical prior to determine how relevant each covariate is to classification. In the MNL model, for example, one hyperparameter, σl , is used to control the variance of all coefficients, βjl (j = 1, ..., c), for covariate xl . If a covariate is irrelevant, its hyperparameter will tend to be small, forcing the coefficients for that covariate to be near zero. We also use a set of hyperparameters, τj , to control the magnitude of the β’s for each class. We use a third hypeparameter, ξ, to control the overall magnitude of all β’s. This way, σl controls the relevance of covariate xl compared to other covariates, τj controls the usefulness of covariates in identifying class j, and ξ controls the overall usefulness of all covariates in separating all classes. The standard deviation of βjl is therefore equal to ξτj σl . For the MNL model we used the following priors: αj |η ∼ N (0, η 2 ) βjl |ξ, σl , τj ∼ N (0, ξ 2 τj2 σl2 ) log(η) ∼ N (0, 1) log(ξ) ∼ N (−3, 22 ) log(τj ) ∼ N (−1, 0.52 ) log(σl ) ∼ N (0, 0.32 ) Since the task of variable selection is mainly performed through PCA, the ARD hyperparameters, σ’s, are given priors with fairly small standard deviation. The priors for τ ’s are set such that both small values (i.e., close to zero) and large values (i.e., close to 1) are possible. The overall scale of these hyperparameters is controlled by ξ, which has a broader prior. Note that since these hyperparameters are used only in the combination ξτj σl , only the sum of the means for log(ξ), log(τj ), and log(σl ) really matters. Similar priors are used for the parameters of treeMNL and corMNL. For these two
Chapter 3. Gene function classification
47
models, we again used one hyperparamter, σl , to control all parameters (β’s in treeMNL, φ’s in corMNL) related to covariate xl . We also used one scale parameter τk for all parameters related to branch k of the hierarchy. The overall scale of all parameters is controlled by one hyperparameter ξ. When we combine different sources of information, we sometimes used separate scale parameters, ξ, for each data source. This allows the coefficients from different sourcecs of data to have appropriately different variances in the model. This is additional to what ARD hyperparameters provide. The setting of priors described in this paper is different from what we used in a previous paper (Shahbaba and Neal, 2007), where we used one hyperparameter to control all the coefficients (regardless of their corresponding class) in the MNL model, and we used one hyperparameter to control the parameters of all the branches that share the same node in treeMNL and corMNL. The scheme used in this paper provides an additional flexibility to control β’s. In this paper, the hyperparameters are given log-normal distributions instead of the gamma distributions used in Shahbaba and Neal (2007). Using gamma priors has the advantage of conjugacy and, therefore, easier MCMC sampling. However, we prefer log-normal distributions since they are more convenient for formalizing our prior beliefs.
3.4.1
Implementation
These models are implemented using Markov chain Monte Carlo (Neal, 1993). We use Hamiltonian dynamics (Neal, 1993) for sampling from the posterior distribution of coefficients (with hyperparameters temporarily fixed). The number of leapfrog steps was set to 50. The stepsizes were set dynamically at each iteration, based on the current values of the hyperparameters (Neal, 1996). In the MNL and corMNL models, new values are proposed for all regression parameters simultaneously. Nested MNL models in treeMNL are updated separately since they are regarded as independent models. The coefficient parameters within each nested model, however, are updated at the same time.
Chapter 3. Gene function classification
48
We use single-variable slice sampling (Neal, 2003) to sample from the posterior distribution of hyperparameters. At each iteration, we use the “stepping out” procedure to find the interval around the current point and the “shrinkage” procedure for sampling from the interval. The initial values of the ARD hyperprameters, σ’s, were set to the inverse of the standard deviation of their corresponding covariates. The initial values of τ ’s and ξ were set to 1. Convergence of the Markov chain simulations was assessed from trace plots of hyperparameters. We ran each chain for 5000 iterations, of which the first 1000 were discarded. Simulating the Markov chain for 10 iterations took about 2 minutes for MNL, 1 minute for treeMNL, and 3 minutes for corMNL, using a MATLAB implementation on an UltraSPARC III machine.
Chapter 4 Nonlinear classification using Dirichlet process mixtures This chapter will be published as a technical report in the department of Statistics, University of Toronto.
49
Chapter 4. Nonlinear classification using Dirichlet process mixtures 50
Abstract We introduce a new nonlinear model for classification, in which we model the joint distribution of response variable, y, and covariates, x, non-parametrically using Dirichlet process mixtures. We keep the relationship between y and x linear within each component of the mixture. The overall relationship becomes nonlinear if the mixture contains more than one component. We use simulated data to compare the performance of this new approach to a simple multinomial logit (MNL) model, an MNL model with quadratic terms, and a decision tree model. We also evaluate our approach on a protein fold classification problem, and find that our model provides substantial improvement over previous methods, which were based on Neural Networks (NN) and Support Vector Machines (SVM). Folding classes of protein have a hierarchical structure. We extend our method to classification problems where a class hierarchy is available. We find that using the prior information regarding the hierarchical structure of protein folds can result in higher predictive accuracy.
4.1
Introduction
In regression and classification models, estimation of parameters and interpretation of results are easier if we assume a simple distributional form (e.g., normality) and regard the relationship between response variable and covariates as linear. However, the performance of the model obtained depends on the appropriateness of these assumptions. Poor performance may result from assuming wrong distributions, or regarding relationships as linear when they are not. In this paper, we introduce a new model based on a Dirichlet process mixture of simple distributions, which is more flexible to capture nonlinear relationships. A Dirichlet process, D(G0 , γ), with baseline distribution G0 and scale parameter γ, is a distribution over distributions. Ferguson (1973) introduced the Dirichlet process as a
Chapter 4. Nonlinear classification using Dirichlet process mixtures 51 class of prior distributions for which the support is large, and the posterior distribution is manageable anlytically. Using the Polya urn scheme, Blackwell and MacQueen (1973) showed that the distributions sampled from a Dirichlet process are discrete almost surely. The idea of using a Dirichlet process as the prior for the mixing proportions of a simple distribution (e.g., Gaussian) was first introduced by Antoniak (1974). We will describe the Dirichlet process mixture model as a limit of finite mixture model (see Neal (2000) for further description). Suppose y1 , ..., yn are drawn independently from some unknown distribution. We can model the distribution of y as a mixture of simple distributions such that: P (y) =
C X
pc f (y|φc )
c=1
Here, pc are the mixing proportions, and f is a simple class of distributions, such as normal with φ = (µ, σ). We first assume that the number of mixing components, C, is finite. In this case, a common prior for pc is a symmetric Dirichlet distribution: P (p1 , ..., pC ) = where pc ≥ 0 and
P
Γ(γ)
C Y
Γ(γ/C)C
c=1
p(γ/C)−1 c
pc = 1. Parameters φc are assumed to be independent under the
prior with distribution G0 . We can use mixture identifiers, ci , and represent the above mixture model as follows (Neal, 2000): yi |ci , φ ∼ F (φci ) ci |p1 , ..., pC ∼ Discrete(p1 , ..., pC ) p1 , ..., pC ∼ Dirichlet(γ/C, ...., γ/C)
(4.1)
φc ∼ G0 By integrating over the Dirichlet prior, we can eliminate mixing proportions, pc , and obtain the following conditional distribution for ci : P (ci = c|c1 , ..., ci−1 ) =
nic + γ/C i−1+γ
(4.2)
Chapter 4. Nonlinear classification using Dirichlet process mixtures 52 Here, nic represents the number of data points previously (i.e., before the ith ) assigned to component c. The probability of assigning each component to the first data point is 1/C. As we proceed, this probability becomes higher for components with larger numbers of samples (i.e., larger nic ). When C goes to infinity, the conditional probabilities (4.2) reach the following limits: nic i−1+γ γ P (ci = 6 cj ∀j < i|c1 , ..., ci−1 ) → i−1+γ P (ci = c|c1 , ..., ci−1 ) →
(4.3)
As a result, the conditional probability for θi , where θi = φci , becomes θi |θ1 , ..., θi−1 ∼
X 1 γ δ(θj ) + G0 i − 1 + γ j Cell envelop > Outer membrane constituents
Cell structure > Membrane Location of gene products > Outer membrane SE
b1519
3.2.8
Metabolism of small molecules > Biosynthesis of cofactors > Menaquinone, ubiquinone
Metabolism > Central intermediary metabolism > Unassigned reversible reactions SE
b1533
1.5.2
Cell processes > Transport/binding proteins > ABC superfamily (membrane)
Transport > Electrochemical potential driven transporters > Porters > MFS Cell structure > Membrane SE
b1981
1.5.21
Cell processes > Transport/bindingproteins > MFS
Transport > Electrochemical potential driven transporters > Porters > MFS SE
b2210
3.4.3
Metabolism of small molecules > Degradation of small molecules > Carbon compounds
Metabolism > Energy metabolism (carbon) > Tricarboxylic acid cycle SE
b3839
1.5.2
Cell processes > Transport/binding proteins > ABC superfamily (membrane)
Transport > Cell Substrate transported > Protein Cell structure > Membrane SE
b1822
2.2.1
Macromolecule metabolism > Macromolecule synthesis, modification > Amino acyl tRNA syn
Information transfer > RNA related > Modification SE
b3223
3.4.3
Metabolism of small molecules > Degradation of small molecules > Carbon compounds
Metabolism > Central intermediary metabolism > Amino sugar conversions SE
b3337
3.5.2
Metabolism of small molecules > Energy metabolism, carbon > Anaerobic respiration
Cell processes > Adaptation to stress > Fe aquisition SE
b3569
3.4.3
Metabolism of small molecules > Degradation of small molecules > Carbon compounds
Metabolism > Carbon compound utilization > Carbohydrate degradation SE
b3955
4.1.3
Structural elements > Cell envelop > Outer membrane constituents
Cell structure > Membrane SE
b3222
3.4.3
Metabolism of small molecules > Degradation of small molecules > Carbon compounds
Metabolism > Central intermediary metabolism > Amino sugar conversions SE
b0570
6.1.1
Global functions > Global regulatory functions
Regulation > Type of regulation > Transcriptional level SE
b0619
6.1.1
Global functions > Global regulatory functions
Regulation > Type of regulation > Transcriptional level SE
b2219
6.1.1
Global functions > Global regulatory functions
Regulation > Type of regulation > Transcriptional level SE
b0505
3.3.15
Metabolism of small molecules > Central metabolism > Conversions of intermed. met-m
Metabolism > Central intermediary metabolism > Allantoin assimilation SE
b0508
3.4.3
Metabolism of small molecules > Degradation of small molecules > Carbon compounds
Metabolism > Central intermediary metabolism SE
b0662
3.5.2
Metabolism of small molecules > Energy metabolism, carbon > Anaerobic respiration
Metabolism > Energy metabolism (carbon) > Aerobic respiration SE
b0789
2.2.7
Macromolecule metabolism > Macromolecule synthesis > Phospholipids
Metabolism > Macromolecule (cellular constituent) biosynthesis > Phospholipid SE
b2924
4.1.2
Structural elements > Cell envelop > Murein sacculus, peptidoglycan
Cell structure > Membrane SE
b2052
3.3.18
Metabolism of small molecules > Central metabolism > Sugar-nucleotide biosynthesis
Metabolism > Macromolecule biosynthesis > Colanic acid (M antigen) SE
b2889
2.2.3
Macromolecule metabolism > Macromolecule synthesis > DNA - replication, repair
Metabolism > Building block biosynthesis > Cofactor, small molecule carrier biosynthesis
Table C.1: Comparison of direct functional annotation of several ORFs (whose function was unknown in 2001) with predicted functions using our corMNL model. In this table, we only present genes for which there is a close match between our predictions and the results from direct biological experiments.
86
Appendix C.
Evidence
bNumber
Class
Class description
NE
b2392
3.5.2
Metabolism of small molecules > Energy metabolism, carbon > Anaerobic respiration
Transport > Substrate transported > Mn+/H NE
b0103
1.5.1
Cell processes > Transport/binding proteins > ABC superfamily (atp-bind)
Metabolism > Building block biosynthesis > Small molecule carrier > Coenzyme A NE
b2530
3.3.15
Metabolism of small molecules > Central metabolism > Conversions of intermed. met-m
Information transfer > Protein related > Posttranslational modification NE
b0162
3.5.2
Metabolism of small molecules > Energy metabolism, carbon > Anaerobic respiration
Regulation > Genetic unit regulated > Regulon NE
b0613
3.4.3
Metabolism of small molecules > Degradation of small molecules > Carbon compounds
Information transfer –> Protein related NE
b2972
3.4.3
Metabolism of small molecules > Degradation of small molecules > Carbon compounds
Information transfer > Protein related > Export, signal peptide cleavage NE
b0053
2.1.1
Macromolecule metabolism > Macromolecule degradation > Degradation of DNA
Information transfer > Protein related > Chaperone, folding NE
b0441
1.7.1
Cell processes > Cell division
Information transfer > Protein related > Chaperone, folding NE
b1199
1.5.23
Cell processes > Transport/binding proteins > Mechanism not stated
Metabolism > Central intermediary metabolism > Unassigned reversible reactions NE
b3836
4.2.2
Structural elements > Ribosome constituents > Ribosomal proteins - synthesis, modification
Cell structure > Membrane Location of gene products > Inner membrane NE
b3838
5.1.2
Extrachromosomal > Laterally acquirred elements > Phage-related functions and prophages
Cell structure > Membrane Location of gene products > Inner membrane
Table C.2: Comparison of direct functional annotation of several ORFs (whose function was unknown in 2001) with predicted functions using our corMNL model. In this table, we only present genes for which there is not a close match between our predictions and the results from direct biological experiments.
Appendix D
Chapter 2 of this dissertation is published in Bayesian Analysis (http://ba.stat.cmu. edu), and Chapter 3 is published in BMC Bioinformatics (http://www.biomedcentral. com/bmcbioinformatics). According to the copyright and license rules of both these journals, the authors are the copyright holders, and have the right to use, reproduce or disseminate their article. In this appendix, we provide the published version of our papers.
87
Bibliography Agresti A (2002). Categorical Data Analysis. John Willey and Son, Hoboken, New Jersy. Altschul SF, Madden TL, Schaffer AA, Zhang J, Zhang Z, Miller W, Lipman DJ (1997). “Gapped BLAST and PSI-BLAST: a new generation of protein database search programs.” Nucleic Acids Research, 25, 3389–3402. Antoniak CE (1974). “Mixture of Dirichlet process with applications to Bayesian nonparamteric problems.” Annals of Statistics, 273(5281), 1152–1174. Barutcuoglu Z, Schapire RE, Troyanskaya OG (2006). “Hierarchical multi-label prediction of gene function.” Bioinformatics, 22, 830–836. Blackwell D, MacQueen JB (1973). “Ferguson distributions via Polya urn scheme.” Annals of Statistics, 1, 353–355. Blattner FR, Plunkett Gr, Bloch CA, Perna NT, Burland V, Riley M, Collado-Vides J, Glasner JD, Rode CK, Mayhew GF, Gregor J, Davis NW, Kirkpatrick HA, Goeden M, Rose DJ, Mau B, Shao Y (1997). “The complete genome sequence of Escherichia coli K-12.” Science, 277, 1453–1474. Blockeel H, Bruynooghe M, Dzeroski S, Ramon J, Struyf J (2002). “Hierarchical multiclassification with predictive clustering trees in functional genomics.” In “Proceedings of the ACM SIGKDD 2002 Workshop on Multi- Relational Data Mining (MRDM 2002),” pp. 21–35. 88
BIBLIOGRAPHY Breiman L, Friedman J,
89 Olshen RA, Stone CJ (1993). Classification and Regression
Trees. Chapman and Hall, Boca Raton. Brown M, Nobel GW, Lin D, Cristianini N, Walsh SC, Furey T, Ares MJ, Haussler D (2000). “Knowledge-based analysis of microarray gene expression data by using support vector machines.” Proceedings of the National Academy of Sciences (USA), 97(1), 262–267. Bush CA, MacEachern SN (1996). “A semi-parametric Bayesian model for randomized block designs.” Biometrika, 83, 275–286. Cai B, Dunson DB (2006). “Bayesian covariance selection in generalized linear mixed models.” Biometrics, 62, 446–457. Cai L, Hoffmann T (2004). “Hierarchical document categorization with Support Vector Machines.” ACM 13th Conference on Information and Knowledge Management. Caruana R (1997). “Multitask Learning.” Machine Learning, 28, 41–75. Cesa-Bianchi N, Gentile C, Zaniboni L (2006). “Incremental Algorithms for Hierarchical Classification.” Journal of Machine Learning Research, 7, 31–54. Clare A, King RD (2003). “Predicting gene function in Saccharomyces cerevisiae.” In “Proceedings of the European Conference on Computational Biology (ECCB 2003), September 27-30, 2003, Paris, France,” pp. 42–49. Daniels MJ, Kass RE (1999). “Nonconjugate Bayesian estimation of covariance matrices and its use in hierarchical models.” Journal of the American Statistical Association, 94(448), 1254–1263. Dehaspe L, Toivonen H, King RD (1998). “Finding frequent substructures in chemical compounds.” In R Agrawl, P Stolorez, G Piatetsky-Shapiro (eds.), “Proceedings of
BIBLIOGRAPHY
90
the Fourth International Conference on Knowledge Discovery and Data Minging,” pp. 30–36. AAAI Press, Menlo Park, CA. Dekel O, Keshet J, Singer Y (2004). “Large margin hierarchical classification.” In “Proceedings of the 21st International Conference on Machine Learning (ICML),” . Deng M, Chen T, Sun F (2004). “An integrated probabilistic model for functional prediction of proteins.” Journal of Computational Biology, 11(2-3), 463–475. Deng M, Zhang K, Mehta S, Chen T, Sun F (2003). “Prediction of protein function using protein-protein interaction data.” Journal of Computational Biology, 10(6), 947–960. DeRisi J, Iyer V, Brown P (1997). “Exploring the metabolic and genetic control of gene expression on a genomic scale.” Science, 278, 680–686. Ding C, Dubchak I (2001). “Multi-class protein fold recognision using support vector machines and neural networks.” Bioinformatics, 17(4), 349–358. Dubchak I, Muchnik J, Holbrook S, Kim S (1995). “Prediction of protein folding class using global description of amino acid sequence.” Proceedings of the National Academy of Sciences (USA), 92, 8700–8704. Dumais ST, Chen H (2000). “Hierachical classification of Web content.” In “Proceedings of the 23rd ACM International Conference on Research and Development in Information Retrieval (SIGIR),” pp. 256–263. Eisen JA (1998). “Phylogenomics: Improving functional prediction for uncharacterized genes by evolutationary analysis.” Genome Research, 8, 163–167. Eisen M, Spellman P, Brown P, Botstein D (1998). “Cluster analysis and display of genome-wide expression patterns.” Proceedings of the National Academy of Sciences (USA), 95, 14863–14868.
BIBLIOGRAPHY
91
Eisner R, Poulin B, Szafron D, Lu P, R G (2005). “Improving Protein Function Prediction using the Hierarchical Structure of the Gene Ontology.” IEEE Symposium on Computational Intelligence in Bioinformatics and Computational Biology. Engelhardt BE, Jordan MI, Muratore KE, Brenner SE (2005). “Protein molecular function prediction by Bayesian phylogenomics.” PLoS Computational Biology, 1(5), 432– 445. Escobar MD, West M (1995). “Bayesian density estimation and inference usinng mixtures.” Journal of American Statistical Society, 90, 577–588. Ferguson TS (1973). “A Bayesian analysis of some nonparamteric problems.” Annas of Statistics, 1, 209–230. Fox J (1997). Applied Regression Analysis, Linear Models and Related Methods. Sage. Geman S, Geman D (1984). “Stochastic relaxation, Gibbs distributions, and the Bayesian restoration of images.” IEEE Transactions on Pattern Analysis and Machine Intelligence, 6, 721–741. Goodman J (2001). “Classes for fast maximum entropy training.” Proceedings of the IEEE International Conference on Acoustics, Speach and Signal Processing (ICASSP), IEEE press. Guest JR, Green J, Irvine AS, Spiro S (1996). The FNR modulon and FNR-regulated gene expression, pp. 317–342. in Regulation of gene expression in Escherichia coli (Lin, E.C.C. and Lynch, A.S. Eds) R.G. Landes Co., Austin, Texas. Hastings WK (1970). “Monte Carlo sampling methods using Markov chains and their applications.” Biometrika, 57(1), 97–109. Hobohm U, Sander C (1994). “Enlarged representative set of proteins.” Protein Science, 3, 522–524.
BIBLIOGRAPHY
92
Hobohm U, Scharf M, Schneider R, Sander C (1992). “Selection of a representative set of structure from the Brookhaven Protein Bank.” Protein Science, 1, 409–417. IUBMB (1992). Enzyme Nomenclature: Recommendations of the Nomenclature Committee of the International Union of Biochemistry and Molecular Biology. Academic Press, New York. Jain S, Neal RM (2007). “Splitting and merging components of a nonconjugate Dirichlet process mixture model.” to appear in Bayesian Analysis. King RD, Karwath A, Clare A, Dehaspe L (2001). “The utility of different representations of protein sequence for predicting functional class.” Bioinformatics, 17(5), 445–454. King RD, Wise PH, Clare A (2004). “Confirmation of data mining based predictions of protein function.” Bioinformatics, 20, 1110–1118. Koller D, Sahami M (1997). “Hierarchically classifying documents using very few words.” In “Proceedings of the 14th International Conference on Machine Learning,” . Laven K, Leishman S, Roweis S (2005). “A statistical learning approach to document image analysis.” Conference on Document Analysis and Recognition (ICDAR), Seoul, South Korea. Lo Conte L, Ailey B, Hubbard T, Brenner SE, Murzing A, Chothia C (2000). “SCOP: a structural classification of protein database.” Nucleic Acids Research, 28, 257–259. MacEachern SN, M¨ uller P (1998). “Estimating mixture of Dirichlet process models.” Journal of Computational and Graphcal Statistics, 7, 223–238. MacKay DJC (2003). Information Theory, Inference, and Learning Algorithms. Cambridge University Press.
BIBLIOGRAPHY
93
Marcotte EM, Pellegrini M, Ng HL, Rice DW, Yeates TO, Eisenberg D (1999). “Detecting protein function and protein-protein interactions from genome sequences.” Science, 285, 751–753. McCallum A, Rosenfeld R, Mitchell T, A N (1998). “Improving text classification by shrinkage in a hierarchy of classes.” In “Proceedings of the International Conference on Machine Learning (ICML),” pp. 359–360. McFadden D (1980). “Econometric models for probabilistic choice among products.” Journal of Business, 53, 13–36. Metropolis N, Rosenbluth AW, Rosenbluth MN, Teller AH, Teller E (1953). “Equation of state calculations by fast computing machines.” Journal of Chemical Physics, 21, 1087–1092. Mitchell TM (1998). “Conditions for the equivalence of hierarchical and flat Bayesian classifiers.” URL http://www.cs.cmu.edu/∼tom/hierproof.ps. M¨ uller P, Erkanli A, West M (1996). “Bayesian curve fitting using multivariate mormal mixtures.” Biometrika, 83(1), 67–79. Neal RM (1993). Probabilistic Inference Using Markov Chain Monte Carlo Methods. Technical Report CRG-TR-93-1, Department of Computer Science, University of Toronto. Neal RM (1996). Bayesian Learning for Neural Networks. Lecture Notes in Statistics No. 118, New York: Springer-Verlag. Neal RM (1998). “Regression and classification using Gaussian process priors.” Bayesian Statistics, 6, 471–501. Neal RM (2000). “Markov chain sampling methods for Dirichlet process mixture models.” Journal of Computational and Graphical Statistics, 9, 249–265.
BIBLIOGRAPHY
94
Neal RM (2003). “Slice sampling.” Annals of Statistics, 31(3), 705–767. Neal RM (2005). “The short-cut Metropolis method.” Technical Report 0506, Department of Statistics, University of Toronto. Pavlidis P, Weston J (2001). “Gene functional classification from heterogeneous data.” Proceedings of the 5th International Conference on Computational Modelcular Biology (RECOMB), pp. 249–255. Pearson WR, Lipman DJ (1988). “Improved tools for biological sequence comparison.” Proceedings of the National Academy of Sciences (USA), 85, 2444–2448. Riley M (1993). “Functions of the gene products of Escherichia coli.” Microbiology Review, 57, 862–952. Riley M, Labedan B (1996). “E. coli gene products: physiological functions and common ancestries.” In FN Neidhardt, RI Curtiss, ECC Lin, JL Ingraham, KB Low, B Magasanik, W Reznikoff, M Riley, M Schaechter, E Umbarger (eds.), “Escherichia coli and Salmonella: cellular and molecular biology, 2nd edition,” ASM Press, Washington, DC. Rison S, Hodgman TC, Thornton JM (2000). “Comparison of functional annotation schemes for genomes.” Functional and Integrative Genomics, 1, 56–69. Rost B (2002). “Enzyme function less conserved than anticipated.” Journal of Molecular Biology, 318, 595–608. Sattath S, Tversky A (1977). “Additive similarity trees.” Psychometrika, 42, 319–345. Schoikowski B, Uetz P, Fields S (2000). “A network of protein-protein interaction in yeast.” Nature Biotechnology, 18, 1257–1261. Shahbaba B, Neal RM (2006). “Gene function classification using Bayesian models with hierarchy-based priors.” BMC Bioinformatics, 7:448.
BIBLIOGRAPHY
95
Shahbaba B, Neal RM (2007). “Improving classification when a class hierarchy is available using a hierarchy-based prior.” Bayesian Analysis, 2(1), 221–238. Sj¨olander K (2004). “Phylogenomics inference of protein molecular function: Advances and challenges.” Bioinformatics, 20, 170–179. Spiro S, Guest JR (1991). “Adaptive responses to oxygen limitation in Escherichia coli.” Trends in Biochemical Sciences, 16(8), 310–314. Struyf J, Dzeroski S, Blockeel H, Clare A (2005). “Hierarchical multi-classification with predictive clustering trees in functional genomics.” In “Proceedings (Bento, C. and Cardoso, A. and Dias, G., eds.), vol 3808, Lecture Notes in Computer Science,” pp. 272–283. Tsochantaridis I, Hoffmann T, Joachims T, Altum Y (2004). “Support Vector Machine learning for independent and structured output spaces.” Proceedings of the 21st International Conference on Machine Learning (ICML). van Rijsbergen CJ (1972). Automatic Information Structuring and Retrieval. Ph.D. thesis, King’s College, Cambridge. Weigend AS, Wiener ED, Pedersen JO (1999). “Exploiting hierarchy in text categorization.” Information Retrieval, 1(3), 193–216. Zhang J, Ghahramani Z, Yang Y (2005). “Learning Multiple Related Tasks using Latent Independent Component Analysis.” In “Proceedings of NIPS 2005, Vancouver, Canada,” .