Aug 25, 1975 - on account of the decision of the graduation committee, .... 2.2 Design Science Methodology applied to the development of the TESNA ...... Figure 28: The Mid Office application Architecture and the task responsibilities .........
IMPROVING COORDINATION IN SOFTWARE DEVELOPMENT THROUGH SOCIAL AND TECHNICAL NETWORK ANALYSIS
Chintan Amrit
PhD Dissertation Committee Chairman Prof Dr. Cornelis Hoede Promoter Prof Dr. Jos van Hillegersberg Members Prof Dr. Kuldeep Kumar Prof Dr. Ir. Mehmet Aksit Prof Dr. Ir. Roel Wieringa Prof Dr. Ir. Jan van den Ende
CTIT PhD thesis series number 08-134 Centre for Telematics and Information Technology (CTIT) P.O. Box 217, 7500 CE Enschede – The Netherlands
ISBN: 978-90-365-2776-7 DOI-number: 10.3990/1.9789036527767 URL: http://dx.doi.org/10.3990/1/9789036527767 ISSN: 1381-3617 (CTIT PhD thesis series number 08-134) Cover Design: Usha Rashmi & Chintan Amrit Printed by : Wohrmann Print Service, Zutphen, The Netherlands Copyright © 2008, Chintan Amrit, Enschede, The Netherlands
ii
IMPROVING COORDINATION IN SOFTWARE DEVELOPMENT THROUGH SOCIAL AND TECHNICAL NETWORK ANALYSIS
DISSERTATION
to obtain the degree of doctor at the University of Twente, on the authority of the rector magnificus, prof.dr. W.H.M. Zijm, on account of the decision of the graduation committee, to be publicly defended on Wednesday the 3rd of December at 16.45 by Chintan Amrit born on the 25th of August 1975 in Ranchi, India
CONTENTS CONTENTS .......................................................................................................................... iv LIST OF TABLES .............................................................................................................. viii LIST OF FIGURES .............................................................................................................. ix ALGORITHMS.................................................................................................................... xii EQUATIONS ...................................................................................................................... xiii ACKNOWLEDGMENTS.................................................................................................. xiv 1. Research Overview.......................................................................................................... 1 1.1
Introduction ............................................................................................................ 1 1.1.1 Research Motivation ................................................................................. 1 1.1.2 Motivation from Practice .......................................................................... 2
1.2
Coordination Background ..................................................................................... 3
1.3
Research Questions................................................................................................ 6
1.4
Research Methodology.......................................................................................... 7
1.5
Case Studies ........................................................................................................... 7 1.5.1 Corporate Case Studies ............................................................................. 8
1.6
Goals and Thesis Outline..................................................................................... 10
2. Research Methodology.................................................................................................. 12 2.1
Design Science Research Methodology ............................................................. 13
2.2
Design Science Methodology applied to the development of the TESNA Prototype............................................................................................................... 15 2.2.1 Design as an Artefact .............................................................................. 15 2.2.2 Problem Relevance.................................................................................. 16 2.2.3 Research Contributions ........................................................................... 16 2.2.4 Research Rigour ...................................................................................... 17 2.2.5 Design as a Search Process ..................................................................... 17 2.2.6 Research Communication ....................................................................... 18
iv
2.3
Evaluation of the TESNA method and tool........................................................ 18 2.3.1 Evaluation through Case Studies............................................................ 19 2.3.2 Evaluation using Feedback on TESNA ................................................. 21
3. Literature Review and Research Focus ........................................................................ 22 3.1
Socio-Technical Theory ...................................................................................... 23
3.2
Software Development Process and Patterns ..................................................... 24
3.3
Patterns in Software Development...................................................................... 25
3.4
Overview of Patterns and Structure Clashes ...................................................... 28 3.4.1 Technical Structure Clashes.................................................................... 31 3.4.2 Social Structure Clashes.......................................................................... 32 3.4.3 Socio-Technical Structure Clashes......................................................... 35
3.5
Revisiting the Research Questions...................................................................... 37
3.6
Identifying Socio/Technical Structure Clashes.................................................. 38
3.7
Patterns and STSCs used in this Research ......................................................... 39
3.8
Conway’s Law Pattern......................................................................................... 41
3.9
Code Ownership Pattern...................................................................................... 42
3.10 Betweenness Centrality Match Pattern............................................................... 42 3.11 Modularity Pattern ............................................................................................... 43 3.12 Core-Periphery Shift Pattern ............................................................................... 45 4. TESNA Tool Design...................................................................................................... 46 4.1
The TESNA Method and Tool............................................................................ 46
4.2
Tool Overview ..................................................................................................... 48
4.3
The TESNA Visualization................................................................................... 53
4.4
Tool Functionality................................................................................................ 54 4.4.1 The Design Structure Matrix (DSM) ..................................................... 54 4.4.2 Technical Structure Analysis .................................................................. 55 4.4.3 Socio-Technical Structure Analysis ....................................................... 59
v
4.4.4 Social Structure Analysis ........................................................................ 63 4.4.5 Metrics ……………………………………………………………….65 4.4.6 Other TOOLS .......................................................................................... 66 5. Mendix Case Study........................................................................................................ 68 5.1
Introduction .......................................................................................................... 68
5.2
Conway’s Law and CTO feedback..................................................................... 70
5.3
Betweenness Centrality Match............................................................................ 74
6. eMaxx Case Study ......................................................................................................... 77 6.1
Case Study Details ............................................................................................... 77
6.2
STSCs in eMaxx and Feedback .......................................................................... 78
6.3
Mining Repositories............................................................................................. 79
6.4
Betweenness Centrality STSC ............................................................................ 80
6.5
Conway’s Law STSC .......................................................................................... 85
6.6
Code Ownership STSC........................................................................................ 89
6.7
Discussion............................................................................................................. 94 6.7.1 Conway’s Law ......................................................................................... 95 6.7.2 Betweenness Centrality........................................................................... 95 6.7.3 Evaluation using Feedback on TESNA ................................................. 97
7. Open Source Case Study ............................................................................................... 99 7.1
Introduction .......................................................................................................... 99
7.2
Comparing Open Source and Commercial Development Processes .............. 100 7.2.1 Discussion .............................................................................................. 108
7.3
Open Source Software Development Process.................................................. 110
7.4
Technical Structure Clash (Modularity Pattern) .............................................. 111 7.4.1 Discussion .............................................................................................. 115 7.4.2 OSS Community Structure ................................................................... 116 7.4.3 Literature Overview of Core-Periphery in Open Source .................... 119
vi
7.4.4 Identification of Core-Periphery STSC in Open Source..................... 124 7.4.5 Measuring the Core Periphery Shift metric ......................................... 125 7.4.6 Empirical Data....................................................................................... 126 7.4.7 Conclusion ............................................................................................. 132 8. Discussion of the Case Studies ................................................................................... 134 8.1
STSCs in the Commercial Software Development Cases............................... 134 8.1.1 Conway’s Law STSC............................................................................ 134 8.1.2 Code Ownership STSC ......................................................................... 135 8.1.3 Betweenness Centrality Match STSC .................................................. 136
8.2
STSCs in the Open Source Software Development Cases.............................. 137 8.2.1 Modularity STSC................................................................................... 137 8.2.2 Core-Periphery Shift STSC .................................................................. 138
9. Conclusions .................................................................................................................. 140 9.1
Limitations.......................................................................................................... 141
9.2
Threats to Validity ............................................................................................. 142
9.3
Contributions...................................................................................................... 145 9.3.1 Contributions to Research..................................................................... 145 9.3.2 Contributions to Practice....................................................................... 146
9.4
Future Work ....................................................................................................... 147
References........................................................................................................................... 149 About the Cover ................................................................................................................. 158 Summary in English........................................................................................................... 159 Summary in Dutch ............................................................................................................. 160
vii
LIST OF TABLES Table 1: The basic structure of a pattern (taken from (Gamma, Helm et al. 1995) )..... 26 Table 2: Literature Overview .............................................................................................. 30 Table 3: Overview of the papers on Technical Structure Clashes.................................... 32 Table 4: Overview of the papers on the Social Structure Clashes.................................... 34 Table 5: Overview of the papers on Socio-Technical Structure Clashes ......................... 37 Table 6: The Socio/Technical Patterns used for the Corporate Case Studies (Chapters 5 and 6), where the Pattern format is taken from Coplien et al. (Coplien and Schmidt 1995; Coplien and Harrison 2004)..................................................................................... 40 Table 7: The Socio/Technical Patterns used in the case of Open Source projects.......... 44 Table 8: Open Source Case studies in relation to Socio/Technical Pattern .................. 101 Table 9: Modularity Technical Pattern for Open Source projects ................................. 112 Table 10: Literature Overview for Core Periphery Shifts............................................... 122 Table 11: Core-Periphery Shift Pattern for Open Source projects ................................ 124 Table 12: The Core-Periphery trends of the different OSS projects studied ................. 132
viii
LIST OF FIGURES Figure 1 The Classic Typology of Task Interdependencies (from Van de Ven et al. (1976) (Ven, Delbecq et al. 1976)).................................................................................................... 4 Figure 2: Revised typology of Task Interdependencies (taken from Kumar et al. (Kumar, Fenema et al. Forthcoming))................................................................................................. 5 Figure 3: The Function-Behaviour-Structure (FBS) Design Process (Based on (Gero 1990)).................................................................................................................................... 15 Figure 4: The positioning of the Research Problem among Different Research Areas.. 22 Figure 5 : Pattern usage during the Project Planning...................................................... 25 Figure 6: The evolution of the project with time................................................................ 29 Figure 7: Pattern usage at both the Planned and Execution stages can help Project Management ......................................................................................................................... 31 Figure 8: The TESNA Method and the Planned Software Process .................................. 46 Figure 9: Class diagram for TESNA................................................................................... 50 Figure 10: Sequence diagram of the Technical Network Module of TESNA................... 51 Figure 11: Sequence diagram of Socio-Technical Network Module of TESNA ............. 52 Figure 12: Sequence diagram of Social Network Module of TESNA............................... 53 Figure 13: Example of a DSM ............................................................................................ 55 Figure 14: Call Graph of JEdit........................................................................................... 56 Figure 15: A clustered DSM in the DSMCluster tool........................................................ 58 Figure 16: Clustered Call Graph of jEdit .......................................................................... 59 Figure 17: The developer code Socio-Technical Call Graph of JEdit ............................. 60 Figure 18: Socio-Technical Clustered Call Graph of jEdit .............................................. 60 Figure 19: The developer dependency graph of jEdit ....................................................... 64 Figure 20: The complete developer-developer dependency network of jEdit................. 64 Figure 21: Social Network from the Mendix case ............................................................. 65 Figure 22: The Software Architecture along with the task responsibilities.................... 70 Figure 23: The social network mapped onto the Software Architecture for week I ........ 71 Figure 24: The social Network mapped onto the Software Architecture for week II ..... 72 Figure 25: The social Network mapped onto the Software Architecture for week III..... 73 Figure 26: The social Network mapped onto the Software Architecture for week IV..... 74 ix
Figure 27: The change in the betweenness centrality over the four weeks..................... 75 Figure 28: The Mid Office application Architecture and the task responsibilities ......... 77 Figure 29: The variation of the Betweenness Centrality of the people working on DPT Project................................................................................................................................... 82 Figure 30: The variation of Betweeness Centrality for the LPOC project. .................... 83 Figure 31: The variation of Betweenness centrality for the LR project ........................... 84 Figure 32: The variation of Betweenness centrality for the TRM project........................ 85 Figure 33: The ratio of the messages between BPEL team FrontOffice, Application Server teams ......................................................................................................................... 88 Figure 34: The ratio of messages between Support team FrontOffice, Application Server and BPEL teams ................................................................................................................... 89 Figure 35: The notice the software clusters of MC version 1.7.5 along with the developers, Thomas and David who modified the classes in the different clusters......... 90 Figure 36: The Core-Periphery Shift of the MC application module............................... 91 Figure 37: The Core-Periphery Shift of the MZM application module from the Application Server................................................................................................................ 92 Figure 38: The Core-Periphery Shift of the MLRD application module from the Application Server................................................................................................................ 92 Figure 39: The Core-Periphery Shift of the MGM application module from the Application Server................................................................................................................ 93 Figure 40: The Core-Periphery Shift of the MDDS application module from the Application Server................................................................................................................ 94 Figure 41: The variation of Propagation Cost of JBoss over different versions........... 115 Figure 42: The variation of Clustered Cost of JBoss over different versions................ 115 Figure 43: The Onion Model of an OSS Community....................................................... 117 Figure 44: Variation of KLOC with Version number of JBoss....................................... 117 Figure 45: Variation of the Number of eMail messages with JBoss Version number... 117 Figure 46: The Core-Periphery snapshot of JAIM at the first instance of time ............ 127 Figure 47: Snapshot of JAIM at the second instance, notice that the developer dingercat has moved to the periphery................................................................................................ 127
x
Figure 48: Snapshot of JAIM at the third instance, notice that dingercat has moved even further to the periphery...................................................................................................... 128 Figure 49: The steadily decreasing Average CPDM of JAIM plotted over equal time intervals .............................................................................................................................. 129 Figure 50: The oscillatory Average CPDM of Megameknet plotted over equal time intervals .............................................................................................................................. 129 Figure 51: The steady Average CPDM of jEdit plotted over equal time intervals........ 130 Figure 52: The Average CPDM of JBoss ......................................................................... 132 Figure 53: Average CPDM of ivy-ssh .............................................................................. 132 Figure
54:
Integration
Interdependence
versus
Reciprocal
with
Integration
Interdependence causing Conway’s Law STSC ............................................................... 134 Figure 55:Non-Sticky Integration Interdependence versus Fully Sticky Integration Interdependence causing the Code Ownership STSC...................................................... 136 Figure 56: The existing Fully Sticky Integration Interdependence typology versus the ideal Integration Interdependence typology..................................................................... 138
xi
ALGORITHMS Algorithm 1: The algorithm used for clustering the Software Module DSM (adapted from(MacCormack, Rusnak et al. 2006)) ........................................................................... 57 Algorithm 2: The Core Periphery Distance Metric (CPDM) algorithm .......................... 62
EQUATIONS Equation 1: The betweenness centrality of a Graph (Wasserman and Faust 1994) ....... 42 Equation 2: Calculation of the Dependency Cost (taken from (MacCormack, Rusnak et al. 2006))............................................................................................................................... 57 Equation 3: Calculation of Clustered Cost (adapted from (Fernandez 1998) and (MacCormack, Rusnak et al. 2006)) ................................................................................... 58 Equation 4: Calculation of the Distance from the Core Cluster....................................... 62 Equation 5: Calculating the Software Developer DSM (SD) (from (Cataldo, Wagstrom et al. 2006) and (Sosa 2008)) .............................................................................................. 63
xiii
ACKNOWLEDGMENTS This PhD work and dissertation would have been impossible without the help and support of my supervisor Prof Jos van Hillegersberg. I thank him for having faith in me and in my work and for inviting me to come to University of Twente. Furthermore, I thank him for the support and friendly encouragement throughout the PhD trajectory. One of the first hurdles a potential researcher has to face is getting the post as a PhD student. I thank Prof Kuldeep Kumar and Prof Jos van Hillegersberg for seeing the potential in me and recruiting me as a PhD researcher in Rotterdam School of Management. Prof Kumar also influenced and helped me in my research at many crucial and critical junctions of the trajectory, for which I am very grateful. During the trajectory of my PhD I have encountered many people who have helped through their inspiration and support. Due to space constraints I name only some of these people and events chronologically. In Twente, I have been helped quite a lot by the colleagues of the IS&CM department. Discussions with Mehmet Aydin and Daniel Moody were a big help in the development of the “theoretical underpinnings” of my PhD. Discussions and paper reviews with Jeff Hicks and Daniel Moody were extremely useful and educational, especially regarding content and style. Friends have also played a special part in making the PhD process enjoyable. The lunch time conversations (lunch papers) with Ulad, Hong and Georgi at RSM along with the chat sessions in their room were enjoyable. In Twente, I could always (and still do) rely upon Micheal, Peter, Diederik and Bjorn to enliven the work environment. Lunch discussions with my roommates and paranymphs: Diederik and Bjorn have never failed to bring up controversial and interesting topics. Pub sessions and corridor chats with Daniel, Jeff, Roland, Jos, Maria and the other department colleagues have helped in creating some great memories and bonhomie. If anyone is reading this and wondering why their name has been left out, remember, it is the thought that counts! I thank my extended family (brother and sister-in-law) who were a constant support. My parents and in particular, my father supported and encouraged me during the PhD and also during the writing of this thesis. Lastly (and most importantly), this PhD research process would have been difficult and boring without the constant support, encouragement and diligent help of my partner Simi (Usha). I especially thank her for her patience during the period of writing this thesis.
xiv
“Organizations which design systems (in the broad sense used here) are constrained to produce designs which are copies of the communication structures of these organizations” -Melvin Conway (1968)
xv
1. Research Overview 1.1 Introduction 1.1.1 Research Motivation There is no single cause for the problems in Software Development. A major factor though, is the problem of coordinating activities while developing large software systems (Kraut & Streeter, 1995). Kraut and Streeter (1995) mention scale of software projects, inherent unpredictability of software specifications and tasks as well as the interdependence of software components as some of the factors that lead to the necessity of efficient co-ordination between the different work groups involved in the development process. Curtis et al. (1988) in their case study, describe the coordination requirements for software engineers to the different levels in a software company, like at the individual, team, project, company and the business milieu levels. At all the different levels they describe how traditional coordination mechanisms like documentation do not work when the number of project members and as a result the coordination requirement increase. At the project level, they propose the formation of boundary spanners between teams in order to enable the exchange of information (Curtis, Krasner et al. 1988). They also observe the problem as previously described by Conway (1968), that the social structure of a project has to reflect the technical architectural structure in order to minimize the dependencies as well as the required amount of communication between the different people involved in the project (Curtis, Krasner et al. 1988). The reoccurrence and extent of some of these coordination problems stem from the fact that the fundamental characteristics of complexity, conformity, changeability and invisibility make software development particularly hard (Brooks 1987). Brooks (1987) describes software entities as being essentially complex, meaning that complexity is inherently a part of software. This complexity according to Brooks, causes difficulties in communication among team members that in turn lead to software being buggy, resulting in cost overruns and delays in schedule. He goes on to say that this essential complexity not only causes technical difficulties but also managerial problems. The inherent complexity of software makes the managerial overview as well as the identification and control of software problems difficult (Brooks 1987). Also, Brooks (1987) says that software is more susceptible to change compared to other manufactured goods (Brooks 1987). The reason Brooks (1987) provides is twofold, that as the functionality of systems is implemented as software and functionality generally subject to change and that software intrinsically is thought as a easier to change as it basically is “thought stuff” and composed through logic (Brooks 1987). This fundamentally complex nature of software makes it difficult to have a managerial overview of the software development process. 1
Kraut and Streeter (1995) in their survey of intergroup coordination practices of a large software development company, observed that project managers might have been misled by the software metric data and reviews to think that they had control over software development projects. While the customers as well as the staff members differed in their judgement of the projects. Furthermore, the software metric data and reviews were used exclusively by the senior project managers but these had little impact on the software development process according to staff members (Kraut and Streeter 1995). Curtis et al. (1988) in their case study of a research consortium, observed how companies were affected by managerial decisions that were based on relatively outdated technical knowledge. They describe how, though the managers had developed their technical progress tracking schemes, they were still less aware of the technical details as compared to the system engineers and were further frustrated at being left out of technical decisions made by engineers as well as the strategic decisions made by executives (Curtis, Krasner et al. 1988). Software development researchers have worked on solutions to these problems by providing explicit mechanisms for coordination. Planning, defining, following a process, defining requirements and design specifications, measuring process characteristics, regular status meetings etc. Further there has been increasing adoption of the Capability Maturity Model for Software (CMM) (Herbsleb, Zubrow et al. 1997) and Capability Maturity Model Integration (CMMI) (Boehm 2000). Such solutions provide a general direction and shared understanding of the process and the resulting outcomes. However, they are constrained by the necessity of everyone’s participation in the common process direction (Herbsleb and Grinter 1999). So the software development process becomes vulnerable to failure when the employees do not follow the explicit process direction as we shall discuss in Chapter 2. The success stories from Open Source, like Linux, Sendmail, Apache etc. are hard to ignore. Ever since Raymond (1999) published his popular paper comparing the “cathedral” (commercial closed source development) to the “bazaar” (Open Source development), there have been many research papers comparing the two (Mockus, Fielding et al. 2002; Dinh-Trong and Bieman 2005). So, it is interesting to see how the various coordination mechanisms used in the different development processes (Closed and Open Source) affect the coordination problems that one can identify in these processes. 1.1.2 Motivation from Practice In my experience as a software developer I faced many difficulties coordinating the development activities. The problem generally worsened before a particular release. The software was a web client-server system and many changes were required on different
2
parts of the web server code. I was in charge of some parts of the web server code, while another colleague was in charge of remaining parts. The different parts of the code (that we were working on) were highly dependent on each other. So each time my colleague checked in his changed code into the CVS code repository I had to go to his desk and ask him how the changes that he had made affected the code, for which I was responsible. The situation was problematic, as my colleague sat down the corridor and hence, during a particularly crunch period I had to run to his desk and back in order to clarify the dependencies (we could not be collocated in one room as he was a smoker). Moreover, the project manager was not aware of the problems developers like me faced. This motivated me to research a tool as well as a method that would help a software manager to locate problems in coordination.
1.2 Coordination Background In this section the finer details and concepts behind coordination are dealt with. Malone and Crowston (1994) in their interdisciplinary study of Coordination Theory, define coordination as “managing dependencies between activities”. They go on to look at different kinds of dependencies between activities and the coordination processes required to manage the dependencies. Malone and Crowston (1994) describe how different, diverse disciplines deal with coordination problems with similar coordination mechanisms (at a conceptual level). They state that organizations require some way of dividing activities among actors and some way of managing the interdependencies among the different activities (Malone and Crowston 1994). Thomson (1967) describes interdependencies among activities to be of three basic types (Thompson 1967), namely: (i) Pooled activity share or produce the same resources and are otherwise independent (ii) Sequential activities as the name suggests depend on the completion of the previous activity, and work flows in one direction (iii) Reciprocal where work and activities flow between intermediate actors in a “back and forth” manner over a period of time. Malone and Crowston mention coordination mechanisms that previous literature mention, to manage these dependencies such as: standardization, where rules govern the performance of each activity, direct supervision, where one particular actor manages the interdependencies in each case and mutual adjustment, where each actor manages interdependencies (Malone and Crowston 1994). Van de Ven, Delbecq & Koenig (1976) build on the typology defined by Thompson (1967), by adding a fourth type of interdependence namely team or intense interdepend3
ence. In intense interdependence work is undertaken jointly and simultaneously by the actors at the same point of time and hence “there is no measurable temporal lapse of the flow of work” (Ven, Delbecq et al. 1976) as is the case in sequential and reciprocal.
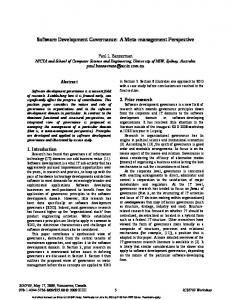
Figure 1 The Classic Typology of Task Interdependencies (from Van de Ven et al. (1976) (Ven, Delbecq et al. 1976))
Figure 1 shows the classic typology as described by Van de Ven (1976), where the rectangles represent work-sites or locations and the circles represent the actors at the different locations. Kumar and van Dissel (1996) describe Coordination as “ the level of specification of roles, obligations, rights, procedures, information flows, data, and analysis and computational methods used in the inter-organizational relationships”. They apply Thompson’s (1967) workflow dependencies (pooled, sequential, reciprocal) to inter-organizational collaboration and generate a typology in order to discuss coordination mechanisms, potential for conflict and types of Inter Organizational Systems (Kumar and Diesel 1996). Kumar et al. (Forthcoming) find the existing typology of interdependencies insufficient to describe work in a globally distributed scenario. They develop on the classic typology of interdependencies of Van de Ven et al. (1976) and apply it to work in a globally distributed scenario. They add integration interdependence along with recognizing and adding the concept of information “hand-offs” (indicating the amount of communication required during a work hand-off (Kumar, van Fenema et al. 2005)) as well as “stickiness” (that explicitly addresses the cost of information transfer (von Hippel 1994)) to the classic typology. Integration interdependence involves integrating the outcomes of parallel task segments into an integrated whole, and thus differs from pooled interdependence as pooled interdependence involves parallel activities that are independent of each other as are the outcomes of the activities (Kumar, Fenema et al. Forthcoming). The resulting interdependence diagrams can be seen in Figure 2. In Figure 2, the circular arrows represent the stickiness between the tasks thus implying the cost of information transfer for each activity. Figure 2 shows the distinction of non-sticky interdependence diagrams, where the costs of information transfer is close to zero (on the left) and the sticky interdependence diagrams, where the costs of information transfer are significant (on the right).
4
Figure 2: Revised typology of Task Interdependencies (taken from Kumar et al. (Kumar, Fenema et al. Forthcoming))
Crowston (1997) applies van de Ven et al.’s concept of coordination in a software development organization. Crowston suggests that when an organization is performing a task, one way to generate alternative processes is to first identify the particular dependencies and coordination problems faced by the organization and then consider what alternative coordination mechanisms could be used to manage them (Crowston 1997). Crowston builds on the typology of Malone and Crowston (1994) and applies it to an organizational context. Crowston defines three basic types of dependencies: (i) between task and resource, (ii) between two resources and (iii) between two tasks. He then describes the coordination mechanisms to manage the particular dependencies. Thus, the methodology suggested by Crowston consists of three heuristics (i) determine the dependencies managed by activities by first examining the activities in the current process (ii) listing the activities and resources and then determining the dependencies managed by them and (iii) looking for problems with the process that hint at unmanaged coordination problems (Crowston 1997). Malone et al. (1999) say that “identifying dependencies and coordina-
5
tion mechanisms offers special leverage for redesigning processes” ((Malone, Crowston et al. 1999), p429). Our research builds on the Coordination theory approach discussed in Crowston (1997). While the Crowston’s (1997) methodology is beneficial, it is unclear as to why a particular coordination mechanism has to be applied for a particular coordination problem. Also, it is not clear how the dependencies at the level of the software code, e.g. taskresource, task-task or resource-resource as well as the associated coordination problems can be identified, especially in a large software development organization. In order to address some of these specific coordination problems software engineering literature has suggested the use of Organization and Process Patterns (Coplien and Harrison 2004). But Organizational and Process Patterns address a very wide range of problems encountered in an organization. Moreover, these patterns have not been validated extensively. So, to summarise, there does exist support from previous literature for the identification of coordination problems in software development. However, the support is limited in scope and does not provide a link to the structure of the software product nor does it provide support in terms of a well defined method and a tool. In this thesis we aim to provide such a method and tool. Using the concept of STSCs (that we introduce in Chapter 3) related to Socio/Technical patterns we demonstrate how the identification of specific coordination problems is made easier as the project manager would find it easier to know what to look for, as we will show in the following Chapters. The next section provides an overview of the case studies and following that is a discussion on the structure of the thesis.
1.3 Research Questions Based on the motivation from research as well as practice we come up with the following research question: How can managers identify coordination problems in an ongoing software development project? Is it possible for a manager to know the current state of coordination among developers or teams in an organization that he needs to manage? Furthermore, can the manger identify emerging coordination problems? Currently a method is lacking to apply the rich coordination and pattern theory in order to detect coordination problems in software development. Moreover, given the size and complexity of data related to coordination what are needed are a tool as well as a method to deal with the coordination problems. So, the related problem which is:
6
Can a tool as well as a related method be developed in order to qualitatively as well as quantitatively identify coordination problems in a software development organization? As Open Source software and commercial closed source software are arguably two of the important streams of software development, we pay attention to both. As there are many differences in the closed source and Open Source development process, we can consider if the same coordination problems are found in both process. This motivates the following research question: Are the coordination problems in the Open Source software development process different from the coordination problems in commercial closed source environment? The concept of coordination as well as that of a coordination problem encompass many finer details and concepts and hence are ambiguous. In the next Chapter we will make this research question more precise along with a better definition and understanding of the coordination problem (by introducing the concept of a Socio/Technical Structure Clash).
1.4 Research Methodology The primary research methodology used in this thesis is the Design Research methodology (Hevner, March et al. 2004). The Design Research methodology (Hevner, March et al. 2004) was used along with the Function-Behaviour-Structure (FBS) design process (Gero 1990) for the development of the TESNA (short for TEchnical and Social Network Analysis) tool and method that are the backbone of this research. The primary means of evaluation of the TESNA method and tool were two commercial as well as multiple Open Source case studies. The case studies were conducted using the Case Study research methodology as prescribed by Yin (2003). The TESNA tool was used to gather as well as display data in the different case studies. The data from interviews of the different employees was used to augment and verify data collected from the different artefacts. The interview data analysed using the qualitative methods including the data coding technique by Miles and Huberman (1984). The research methodology is explained in greater detail in Chapter 2.
1.5 Case Studies We have tested the TESNA method and tool in a series of case studies in both Corporate as well as Open Source environments. 7
1.5.1 Corporate Case Studies We have conducted case studies in two comparative Software Development companies, Mendix and eMaxx. While Mendix had 12 managers and developers eMaxx had 22 and was hence was nearly double in size. The products the two companies develop are comparable. While Mendix develops a web-based Service Oriented Application (SOA), eMaxx develops Mid-office solutions for city administrations in Netherlands. Both companies employ three tier architecture for their products, namely a client (thin client), server and database. Mendix Case We started by studying the dependencies among the software modules at the core of the middleware application created by Mendix, using TESNA. We then read the log data on the software modules from the software repositories used in Mendix. We collected data about the communication structure over a period of three months, through participant observation, interviews and gathering work related documents from development tools and communication servers. Among the documents observed were the chat logs, which were stored in XML format. Logs of chat transcripts over four weeks, each week evenly distributed in the 3 month period, were mined and analysed with TESNA. It was ascertained through our interviews that almost all technical communication was done through online chat. This was because Mendix uses a dedicated Jabber chat server running for the company (which eliminated wastage of time due to external chats), and developers at Mendix consider the use of chat more efficient than face to face communication. The communication links as analysed from the chat logs corresponded with those that the interviewees had themselves provided. The developers were assigned to teams based on the part of the system’s architecture they were working on. So, developers working on the client system belonged to one team and so on. We analysed the developer dependencies versus the actual communication of the developers working on each of the different parts of the architecture. We realised that most of the problems related to dependencies in each of the architecture modules were discussed by the developers in the team meeting and/or through the jabber chat interface. However, what was striking was that dependencies between developers working in different teams (the client system and the workflow server for example) were not discussed and this was the cause of most of the problems in the development. Also, we determined which employee was in charge of the coordination in different projects over time. We were able to spot a coordination inconsistency between the assigned role and the actual roles. Once the data was displayed and analysed through the identification of 8
coordination inconsistencies, we took the data back for feedback from the CTO of Mendix. In this way we could ascertain that our technique was really useful to the CTO. eMaxx Case As in the Mendix case above, we started our data collection by studying the core software modules as well as modules related to the different parts of the Architecture, using TESNA. We then read the log data on the software modules from the software repositories used in eMaxx. We collected data about the communication structure over a period of six months, through participant observation, interviews and gathering work related documents from development tools and communication servers. We mined the Mantis bug tracker using TESNA and constructed a communication network based on the discussion thread on each page. We noticed, as in the Mendix case, that problems generated due to dependencies between the developers working in the same team were solved through face-to-face meetings and team meetings twice a week. But the problems due to dependencies between developers working on different teams were in most of the cases unsolved. This was further confirmed by analysing the data from the interviews. Also, as in the Mendix case, although in a more thorough fashion, we analysed which employee had the chief coordinating role in different projects. We also determined whether the coordinating role changed over time. In most of the projects we were able to spot a coordination inconsistency between the assigned role and the actual roles. Unlike in the Mendix case study, we used the newly developed functionality of the TESNA tool to also identify the changes in ownership of the code at the level of the software project. We did this through the use of a clustering algorithm on the data got from the source code. As in the Mendix case, we took all the data back to the employees and in a series of interviews tried to establish the reason behind some of the coordination problems. We also brought all the employees together in one room for a joint feedback workshop session. In this workshop a questionnaire was distributed among the employees for an evaluation of the TESNA method and tool. Open Source Case Studies Using the large amount of literature on Open Source software development we performed a Secondary Analysis of published case studies (Gallivan 2001). We used this analysis to establish how some of the patterns applicable to commercial closed source development are not applicable to Open Source projects.
9
We have analysed several open source software projects based on java technology. The projects range from small (1 to 3 developers) to middle (10 to 15 developers) to large (greater than 15 developers). As with the corporate case studies, we analysed the dependencies among the software modules using our tool TESNA. We then read the log data on the software modules from the software repositories of the software project. We tried to reason how the change in coupling of the software is related to the change in the communication among the developers. We tested this in a case study of the JBoss Open Source project. We also analysed seven different Open Source projects of various sizes and in different stages of development in order to determine whether the developers were working on the core or the periphery of the software. In order to carry out this analysis we clustered the dependency graph of the software based on dependencies of the software modules. Then, we combined the display of the clusters with the log data we got from the code repository. With this analysis we could determine the shifts of the developers between the core and the periphery of the software. We studied the projects over a period of time and analysed the people cluster image to see if developers were moving towards or away from the Core. We then calculated a metric (Core-Periphery metric) to understand the extent of this shift.
1.6 Goals and Thesis Outline The primary goal of the research presented in this thesis is to answer the question about how a manager can detect Coordination Problems in his team, or in the company in general. In attempting to answer this question, we realise that we need to utilize software process patterns (that we call Socio/Technical Patterns). In order to use these patterns, we need to identify and validate relevant Socio/Technical Patterns taken from different literature sources. Using these patterns is not an easy task in itself. Hence, the need arises to develop a tool along with an accompanying method that can be used to detect specific coordination problems in commercial as well as Open Source software development processes. Once such a tool is constructed (using the Design Science Research Methodology), we need to validate the tool and method in different case studies. Such a validation of the tool, method and the patterns themselves is the final goal of this research.
10
The rest of the thesis is structured as follows: Chapter
Summary
Chapter 1
This Introduction
Chapter 2
Describes the research methodology used in this thesis
Chapter 3
Provides an overview of the literature on Software Patterns and then goes on to describe the conceptual model and focus of this thesis by refining the Research Questions. This chapter also describes the different Socio/Technical Patterns used in this thesis
Chapter 4
Gives an overview of the TESNA method and functionality of the tool
Chapter 5
Describes the first Case Study conducted in a company called Mendix
Chapter 6
Describes the Case Study conducted in a company called eMaxx
Chapter 7
Starts with a comparison of STSCs found in commercial environments with those in Open Source environments and then goes on to describe two Case Studies on Open Source software projects
Chapter 8
Discusses the case studies and the management lessons that can be learned from the STSCs found
Chapter 9
Concludes the thesis by discussing the various contributions to research and practice while dealing with the limitations and the threats to validity of the Case Studies conducted
11
2. Research Methodology Research Methodology is the philosophy of a research process that “includes the assumptions and values that serve as a rationale for research and the standards or criteria the researcher uses for interpreting data and reaching a conclusion” (Basili, Selby et al. 1986). Basically, a research methodology applies a scientific method to solve a research problem (answer a research question). When trying to decide which research methodology to apply we considered the nature of the problem. Hevner et al. (2004) distinguish between design science and a more routine design or system building approach. While routine design is the application of existing knowledge to organizational problems, design science involves finding new solutions to previously unsolved problems or better and more efficient solutions to previously solved problems. Hevner et al. (2004) state that a Design Research methodology is appropriate to wicked problems (Brooks, (1987)) like: i. unstable requirements and constraints based upon ill defined environmental contexts ii. complex interactions among subcomponents of the problem and its solution iii. inherent flexibility to change the design processes as well as design artefacts (i.e. malleable process and artefacts) iv. a critical dependence upon human cognitive abilities (e.g. creativity) to produce effective solutions v. a critical dependence upon human social abilities (e.g. teamwork) to produce effective solutions (Hevner, March et al. 2004) The research problem in this dissertation is a wicked problem in the sense of what Brooks (1987) means as it satisfies most if not all the criteria that Hevner et al. (2004) mention in their article. Let us consider each point in more detail i. Coordination problems depend on the environmental context and change continuously and hence is an unstable requirement ii. We narrow the scope of coordination problems in this thesis and restrict it to the interaction between the social and the technical networks. Each of these networks (social and technical) involves complex interactions among the different actors of the network. iii. This research is focussed on identifying coordination problems in software development, that inherently has a flexible process as well as design artefacts. iv. Software development relies quite heavily on human cognitive abilities to produce effective solutions.
12
v.
Again as mentioned above, software development relies on human social abilities to coordinate and produce effective solutions
Given the above points, as well as the fact that we were looking for an innovative solution to an essentially unsolved problem in research we decided to pursue a design science methodology instead of a routine design or system building approach (Hevner, March et al. 2004).
2.1 Design Science Research Methodology In the literature survey done for Design Science methodology it soon became clear that the Information Systems discipline lags behind many in the Engineering domain like Artificial Intelligence when it comes to research using design science. This is further evident from the paper by March et al. (2000) where they extol the need for application driven technology-intensive research in the IS field. Literature on Design Science from Artificial Intelligence discipline is much more vast and elaborate as compared to the IS area. Yoshikawa (1981) came up with a “General Design Theory” (GDT) in 1981. However, this theory is not so widely used as it is more specific to CAD (Computer Aided Design) systems. This is partly due to the complexity of its mathematical formulation and partly due to the fact that the theory is too formal to be relevant to design (Reich 1995). Takeda et al. (1990) build on the GDT and develop a descriptive, cognitive and computable model of the design process. Again, as their concepts are not too intuitive it is not widely cited or used. Another paper from the same special issue of AI Magazine (1990, Winter), namely Gero (1990), “On a Knowledge Representation Framework of Design Prototypes” is very highly cited and used. Hevner et al. (2004) describes the following seven guidelines to perform design science research in Information Systems discipline: i. Design as an Artefact: an innovative and purposeful artefact of the kind a construct, model, method or an instantiation ii. Problem Relevance: the technology based solution must be important and relevant to Business iii. Design Evaluation: the design artefact must be rigorously evaluated iv. Research Contributions: the contribution in the areas design, foundations and methodologies must be made clear v. Research Rigor: rigorous methods in both the development and evaluation of the solution must be employed
13
vi.
Design as a Search process: the process of creating the artefact as well as the artefact itself incorporates a search process where a problem space is constructed and a mechanism constructed to find an solution vii. Communication of Research: the outcomes of the design science research must be communicated effectively to technology oriented practitioners and corporate managers. Though the design research methodology proposed by Hevener et al. (2004) is a comprehensive methodology for the overall design science approach, it does not deal with the complexity of the process of actually developing a design artefact (the search process itself). In order to address this, we follow the process framework from Gero (1990) for the design of the TESNA prototype. However, for the overall design research methodology of the TESNA method and tool we follow the design research methodology proposed by Hevner et al. (2004). In Gero’s Function-Behaviour-Structure framework three classes of variables for depict a design object are described: (i) Function (F) describes the various requirements for the design object (ii) Behaviour (B) describes the attributes that are derived (Bs) or is expected to be derived (Be) from the Structure (S) of the variables of the object and (iii) Structure (S) describes the components of the objects and how the components relate to each other. The eight processes labelled in Figure 7 are: (1) Formulation: transforms the requirements expressed in Function (F) to the Expected Behaviour (Be) (2) Synthesis: transforms the Expected Behaviour (Be) into a Solution (S) (3) Analysis: derives the Actual Behaviour (Bs) from the synthesised Solution (S) (4) Evaluation: compares the Actual Behaviour (Bs) derived from the solution with the Expected Behaviour (Be) in order to decide if the Solution (S) is acceptable (5) Documentation: produces the Design Description (D) for constructing the product (6) Reformulation type 1: addresses changes in the Solution (S) (structure variables or their ranges of values) if the Actual Behaviour (Bs) of the Solution is considered unsatisfactory (7) Reformulation type 2: addresses changes in the Expected Behaviour (Be) (behaviour variables or their ranges of values ) if the Actual Behaviour (Bs) of the Solution (S) is considered unsatisfactory (8) Reformulation type 3: addresses changes in the Formulation (F) (function variables or their ranges of values) if the Actual Behaviour (Bs) of the Solution (S) is considered unsatisfactory
14
Figure 3: The Function-Behaviour-Structure (FBS) Design Process (Based on (Gero 1990))
2.2 Design Science Methodology applied to the development of the TESNA Prototype In a pilot case study performed on four teams of Master Students (Amrit 2005), we observed how the structure of the social network in a team influences the performance of the team. The research was conducted in a globally distributed environment (part of each team was located in The Netherlands and the other part in India), and the team’s task was a design based project. The exercise revealed how the Centralization and Density of Advise and Task networks affect the performance of the team. Though the data was only good for a preliminary academic analysis, we got insights into how the structure of the social network of a team can affect its performance. As the performance was rated on the relevance of the solution according to the requirements given, we saw that monitoring the structure of the social network can help in identifying the coordination problems between team members. Along with the social network, we decided to look at the technical artefacts to help in identification of coordination problems based on literature available on socio-technical congruence (de Souza, Redmiles et al. 2004; Cataldo, Wagstrom et al. 2006; Wagstrom and Herbsleb 2006; Sosa 2008). Thus, a design research project to create a tool that identifies coordination problems qualitatively and quantitatively was embarked upon. 2.2.1 Design as an Artefact Simon (1996, p132) states “solving a problem simply means representing it so as to make the solution transparent”. This is exactly what is followed in this research. The tool TESNA displays the different social as well as the technical networks in such a way that
15
identifying a coordination problem (which is the solution to the research question) becomes easy and transparent. In Chapter 4, the design and the features of TESNA are described in more detail. March and Smith (1995) describe four different kinds of products that can be a result of design science research, namely: constructs, models, methods and implementations (March and Smith 1995). The constructs are the “basic language of concepts” (March and Smith 1995) or the “vocabulary and symbols used to define the problem and the solutions” (Hevner, March et al. 2004). In the case of TESNA the constructs are Design Structure Matrices (DSMs) that are widely used in the engineering discipline (Steward 1981; Eppinger, Whitney et al. 1994) as will be described in the next Chapter (Chapter 3). Models are higher order constructions combined from constructs and used to describe tasks, situations and artefacts (March and Smith 1995). TESNA uses Network Diagrams and Line Graphs to represent the DSMs as well as the coordination problems over time. Methods are techniques to build models or “goal directed activities” (March and Smith 1995). The method to detect coordination problems, as described in this Section, is also a design artefact developed as part of this research. Finally, the implementation is an instantiation or a physical representation to perform certain tasks (March and Smith 1995). The tool TESNA is developed as an instantiation of the constructs in order to represent the models that can be used as part of the method to detect specific coordination problems. 2.2.2 Problem Relevance Hevner et al. (2004) in their paper on Design Research methodology, describe the nature of a research problem as “the difference between the goal state and the current state of a system” ((Hevner, March et al. 2004), p85). As discussed in the Socio Technical Congruence literature (Herbsleb, Cataldo et al. 2008), the research problem in this paper involves the difference in coordination between the project execution phase and the software planning phase. The detection of specific coordination problems (STSCs) related to the software process can reduce this gap. Thus the problem addressed by this research is clearly relevant and important to IS research as well as practice. 2.2.3 Research Contributions The TESNA tool and the associated method (described in Chapter 4) are the primary contributions of this research. As TESNA is the first artefact to address the research problem of this thesis the development of such an artefact is contribution in itself. The evaluation, challenges to the improvement of the tool and method as well as a more
16
comprehensive list of contributions are dealt in the final Chapter (Chapter 9) of the thesis. 2.2.4 Research Rigour The research done as part of the development of TESNA has its theoretical foundations in the field of IS, CSCW as well as Software Engineering. Prior research done in the field of Product Design Engineering (Eppinger, Whitney et al. 1994; Sosa, Eppinger et al. 2004), CSCW (de Souza, Froehlich et al. 2005; Cataldo, Wagstrom et al. 2006) , Coordination Theory (Organizational Theory) (Malone and Crowston 1994; Crowston 1997) as well as Process Patterns (Software Engineering) (Coplien 1994; Coplien and Harrison 2004) have served as the basis for this work. The tool TESNA has been primarily evaluated using data collected from case studies in commercial as well as Open Source development environments. 2.2.5 Design as a Search Process The development and refinement to the tool of TESNA was carried out in a period of two years that involved evaluation in the different case studies. The development of TESNA followed the Function-Behaviour-Structure prototype development process (Figure 7 and based on (Gero 1990)). Initially the Expected Behaviour (Be) was quite different from the current implementation of TESNA. The Expected Behaviour was to have an automated recognition of coordination problems. Though this is possible in the case of a specific coordination problem, it is difficult to implement such a tool for all kinds of coordination problems. As the research question dealing with the detection of such a general coordination problem is quite wicked, and it is difficult to determine let alone explicitly describe the means ends and laws (Vessey and Glass 1998). For such a research problem with changing requirements a more exploratory approach is called for and hence it was decided to have human intervention in order to identify coordination problems. Hence, Reformulation of type 2 (Figure 7) was carried out (change in the Expected behaviour) and this was followed by a Reformulation of type 3, where a change in the basic Function (F) of TESNA was carried out (Figure 7). The identification of coordination problems involved extending TESNA with much additional functionality (that will be described in more detail in Chapter 4) and further, each time the tool had to be modified for reading a specific resource. The addition of each of these functionalities as well as the related modifications involved Reformulations of type 1 (Figure 7).
17
2.2.6 Research Communication The development of the TESNA tool as well as the results from the case studies has been communicated to technological as well as management oriented practitioners. The results were especially communicated to the developers and management staff involved in the two commercial cases conducted as part of the thesis. The feedback from this audience was carefully collected, analysed and included in the validation of the tool as part of this thesis. Furthermore, the tool design and outcomes from the case studies were also communicated to technological as well as management oriented research audiences in various workshops and conferences. The feedback from the different audiences was also used to refine the development of the tool and the associated method.
2.3 Evaluation of the TESNA method and tool Kaplan and Duchon (1988) classify the field of Information Systems under the field of social systems. They say that such social systems involve many “uncontrolled and unidentified” variables and hence methods used in closed systems are not very appropriate for such systems. They use a combination of quantitative and qualitative techniques in their case study. The qualitative methods used in their paper include open-ended interviewing, observation, participant observation, and analysis of responses to open-ended items on a survey questionnaire, while quantitative methods used include analysing the data collected from questionnaires (Kaplan and Duchon 1988). Saracevic (1995) describes six levels of prototype evaluation, namely: (i) Engineering (ii) Input (iii) Processing (iv) Output (v) Use or user, and (vi) Social level. According to Saracevic (1995) most of prototype evaluations focus on only one or two of these levels. Vokurka et al. (1996) discuss a list of quantitative and qualitative methods to validate prototypes. Zelkowitz and Wallace (1998) describe twelve validation methods that fall into three categories, namely observational, historical and controlled. An observational method collects relevant data as the project proceeds and there is little control over the project development. The historical method collects data from projects that are completed and for which the data is available. A controlled method provides data from multiple instances of observations and can thus check statistical validity of the data (Zelkowitz and Wallace 1998). Hevner et al. (2004) list five different types of design evaluation methods, namely, observational, analytical, experimental, testing and descriptive. They classify the different evaluation methods as follows: 1) Observational: a. Case Study: Study the artefact in a business environment b. Field Study: Monitor use of artefact in multiple projects 18
2) Analytical: a. Static Analysis: Examine the structure for static qualities (e.g. complexity) b. Architecture Analysis: Study the fit of the artefact into the IS architecture c. Optimization: Demonstrate inherent optimal properties of the artefact or provide optimal bounds on artefact behaviour d. Dynamic Analysis: Study artefact in use for dynamic qualities (e.g. performance) 3) Experimental: a. Controlled Experiment: Study artefact in a controlled experiment for different qualities like usability b. Simulation: execute artefact with artificial data 4) Testing: a. Functional (Black Box) Testing: Execute artefact to discover failures and identify defects b. Structural (White Box) Testing: Perform coverage testing of some metric in the artefact implementation like execution paths. 5) Descriptive: a. Informed Argument: Use information from the knowledge base (e.g. relevant research) to build a convincing argument for the artefact’s utility b. Scenarios: Construct detailed scenarios around the artefact to demonstrate its utility As the TESNA tool as well as the method is the first of their kind, we use a soft observational evaluation method like case study research for evaluation. The tool TESNA was tested in each iteration of its development using functional (black box) as well as structural (white box) testing methods. Here we describe the two ways in which the TESNA method and tool have been evaluated. 2.3.1 Evaluation through Case Studies The case studies were conducted using the Case Study research methodology as prescribed by Yin (2003). The tool was used to gather as well as display data in the different case studies. The data from interviews of the different employees was used to augment and verify data collected from the different artefacts. The interview data analysed using the qualitative methods including the data coding scheme by Miles and Huberman (1984). On the basis of the different network and graph displays, coordination problems related to the development process were identified. During the second case study (at
19
eMaxx, Chapter 6) a presentation was held in which seven of eMaxx employees (who were also involved in the projects studied) participated. After the presentation a feedback questionnaire on the TESNA method and tool was distributed among the attendees. The feedback from the questionnaire served as evaluation of the TESNA method and tool and can be seen in Chapter 6 (section 6.7.3). No formal comparison with related artefacts was conducted as there are no other tools that address the specific research problem. Although, there are tools that address subproblems like for the identification of specific coordination problems (called the Conway’s Law STSC as will be explained in Chapter 3) (de Souza, Froehlich et al. 2005). We have conducted case studies in two comparative Software Development companies, Mendix and eMaxx apart from multiple Open Source case studies. Both the companies (eMaxx and Mendix) adopted an iterative software development process and had development teams of similar size (between 15 to 20 developers each). The products the two companies develop are also comparable. While Mendix develops a web-based Service Oriented Application (SOA), eMaxx develops Mid-office solutions for city administrations in The Netherlands. Both companies employ three tier architecture for their products, namely a client (thin client), server and database. In the eMaxx case study the following s methodological steps were followed: (i) In a meeting with the company’s CTO; the technical architecture, the task and team allocation of the different employees were discussed (ii) The different code repositories used by the developers were analysed. The important core modules relating to different projects were then determined through interviewing the Managers and select employees. The call graph structure, the clustering and the coupling metrics of these modules were then analysed in more detail. (iii) The different communication and coordination mechanisms used by the employees were first analysed. Then, the most representative mode of communication and coordination was determined through various interviews of the managers and employees. The communication repositories (e-mail, chat and bug tracker) corresponding to these modes of communication and coordination were then analysed in more detail. (iv) After analysing the data from the code repositories, the data in the form of graphs was taken back to the developers for their feedback (v) The same procedure (as (iv)) was repeated with the data analysed from the communication repositories. This time, the data (especially the accuracy of the mined social network) was discussed with each of the employees involved through face-to-face interviews. 20
(vi)
(vii)
(viii)
(ix)
After determining if the data was valid and an accurate representation of the social and technical structures, the data was analysed to identify coordination problems. After identifying coordination problems, the Managers responsible for the particular projects in which the coordination problems were identified, were again interviewed. This was done to obtain their feedback on the findings. A research presentation and feedback session was arranged with the employees of the company in order to get their feedback on many of the coordination problems. Follow-up interviews of the project members were then held in order to ascertain the reason for the occurrence of some of the coordination problems.
In the Mendix case study only steps (i) to (vii) was followed, as it was a first case study and we thought that the data was not too extensive to warrant a presentation to the company’s employees. On the other hand, in the Open Source case studies, only data from the repositories was considered. This was done, as it was very difficult to obtain a large number of responses to our online questionnaires from the Open Source developers. Hence, we used the data from the repositories and verified the presence of coordination problems using additional data (in the case of the Modularity Pattern) or additional case studies (in the case of the Core-Periphery Shift Pattern). 2.3.2 Evaluation using Feedback on TESNA After the presentation (on the analysed data) given to the eMaxx employees, we also distributed questionnaires for feedback on the method and tool. We later discussed the feedback with all the participants of the talk, in order to get more qualitative data on their feedback. In total eight developers, support personnel and project leaders attended the presentation and also filled the questionnaires. The summary of the responses can be seen in the Chapter on the eMaxx case study (Chapter 6). In the next Chapter (Chapter 3) we describe the theoretical underpinnings of this research.
21
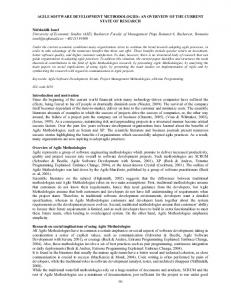
3. Literature Review and Research Focus In this chapter we position the research problem in research literature. This chapter also provides a framework to position the main research problem in a broader context of different literature, while at the same time, refining it to a narrower scope and focus. In order to create such a framework, concepts from literature belonging to various fields were taken. The research done as part of the development of TESNA has its theoretical foundations in the field of IS, CSCW and Software Engineering. Prior research done in the field of Product Design Engineering (Eppinger, Whitney et al. 1994; Sosa, Eppinger et al. 2004), CSCW (de Souza, Froehlich et al. 2005; Cataldo, Wagstrom et al. 2006) , Coordination Theory (Organizational Theory) (Malone and Crowston 1994; Crowston 1997) as well as Process Patterns (Software Engineering) (Coplien 1994; Coplien and Harrison 2004) have served as the basis for this work.
Figure 4: The positioning of the Research Problem among Different Research Areas.
We have already discussed Coordination in the Research Motivation section in Chapter 1. The rest of this chapter deals with the literature in the other three research areas depicted in Figure 3. But, rather than using the structure presented in the Venn diagram from Figure 3, we group the literature under Social, Technical and Socio-Technical Patterns. We perform such a grouping as then it is easier to focus on the research question.
22
The Socio-Technical concept used in this thesis differs from the widely used SocioTechnical notion in the Information Systems literature as we shall explain in the following section.
3.1 Socio-Technical Theory The Tavistock Institute of Human Relations (Institute) is credited with the development of the concept of Socio-Technical design, beginning in the 1940’s. The institute initially focused on the work systems in factories and offices, and on traditional non-computing manufacturing systems (Emery and Trist 1960). In the 1970’s the institute began research in the area of design and introduction of computing systems as Socio Technical Systems for use in Organizations. The Socio-Technical Design theory was then associated with terms such as user involvement, participatory design , user satisfaction, human relations and workplace democracy (Kling and Scacchi 1980). This theory of SocioTechnical design is prescriptive in nature rather than the descriptive or empirically grounded studies preferred by scholars in the Computer Supported Cooperative Work (CSCW) or human computer interaction field (Scacchi 2004). In order to overcome this limitation, a specific socio-technical network model called Socio-Technical Interaction Network (STIN) was advanced by Kling, Kim and King (2003). They define a STIN to be “a network that includes people (including organizations), equipment, data, diverse resources (money, skill, status), documents and messages, legal arrangements and enforcement mechanisms, and resource flows” ((Kling, McKim et al. 2003), p48). The theory behind STINs can be considered to have evolved from the socio-technical system theory (Emery (1960)) and actor network theory (ANT) (Latour (1987)). Actor network theory deals with relations between material things as well as semiotic (between concepts). ANT encourages the need for empirical research rather than prescriptive strategies or studies based on the motivation behind why people should participate in system design. Especially empirical research on what people do in their work, the tools, resources and artefacts they create, use or consume (Latour 1987). STINs thus builds on the Socio-Technical System as well as the ANT concepts and focuses on “the importance the character of interactions between people, between people and equipment, and even between systems of equipment” ((Kling, McKim et al. 2003), p49). Hence STINs can be used to examine and understand the software development process and in particular provide a framework in which the Research Question addressed in the Introduction can be answered. Recently there has been an emergence of a subfield of CSCW called Socio-Technical Congruence as evidenced by a workshop on the topic at the International Conference for Software Engineering (Herbsleb, Cataldo et al. 2008). Socio-Technical Congruence is 23
typically the difference between the coordination requirements (Wagstrom and Herbsleb 2006) due to the technical dependencies and the actual coordination. Where, congruence is achieved when the coordination capabilities match or exceed the required coordination (Herbsleb, Cataldo et al. 2008). The term “Socio-Technical”, as used in this thesis is based on a similar conceptualisation of STINs.
3.2 Software Development Process and Patterns A Software Process is a “partially ordered set of activities undertaken to manage, develop and maintain software systems”(Acuna and Juristo 2005). The software process is hence a representation of the process of construction and not of the end product. A Software Process Model on the other hand is an “abstract representation of the software process” (Acuna and Juristo 2005). As described briefly in the research motivation section earlier, software development projects often prove to be both a costly and risky endeavour. Poor software project execution continues to result, in the best cases, in missed deadlines, and in the worst cases, in escalations in commitment of additional resources as a cure-all for runaway projects (Kraut and Streeter 1995). In this section we look at the research problem and scope in more detail. Some of these problems stem from the differences between the development process model and software architecture at the project planning phase to what actually occurs at the development phase (Curtis, Krasner et al. 1988; Amrit, van Hillegersberg et al. 2004). Curtis et al.(1988) describe the project manager’s predicament when there are changes in the software application and related technologies due to fluctuating specifications or requirements. They describe how the tracking schemes most managers had developed were of no use and they had to rely on system engineers for their managerial input. Figure 5 illustrates this problem. On the left hand side of Figure 5 we have the design phase where the software development process model and the software architecture are planned and designed, while on the right hand side the actual implementation of the software development is described. The implemented software often evolves into something completely different from what was envisioned at the design phase over a period of time, as shown in Figure 5. In order to develop and maintain quality software in a repeatable predictable fashion and to prevent the software process from getting out of hand the industry has come up with what are called software best practices. These best practices have been used enough times to be commercially proven approaches to strike at the root of the software development problems (Kruchten 1998). During software development, just knowledge of the best practices is not enough to guarantee successful comple24
tion of software projects. The problem with the usage of best practices as generic solutions is that they are not precisely formalized and hence not easily applicable. What are needed are generic solutions to specific problems one encounters during the actual practice of software development. Experienced software designers and developers try to reuse solutions which have worked in the past rather than solve every problem from first principles. This practice has led to the collection and use of software patterns, which are generic solutions to recurrent software development problems. These patterns are applied in the design stage of the product (Figure 5) and are not applied in the actual implementation part of the software development.
Figure 5 : Pattern usage during the Project Planning
3.3 Patterns in Software Development While there are many ways to describe patterns, Christopher Alexander, who originated the notion of patterns in the field of architecture, described patterns as “a recurring solution to a common problem in a given context and system of forces” (Alexander, Ishikawa et al. 1977). In software engineering patterns are attempts to describe successful solutions to common software problems (Schmidt, Fayad et al. 1996). Patterns reflect common conceptual structures of these solutions and can be used repeatedly when analyzing, designing and producing applications in a particular context. Coplien and Harrison (2004) define pattern as “a recurring structural configuration that solves a problem in a context, contributing to the wholeness of some whole, or system that reflects some aesthetic or cultural value” ((Coplien and Harrison 2004), p14). Patterns represent the knowledge and experience that underlie many redesign and re-engineering efforts of de25
velopers who have struggled to achieve greater reuse and flexibility of their software. The different types of patterns are: ·
Design Patterns: Are simple and elegant solutions to specific problems in software design (Gamma, Helm et al. 1995).
·
Analysis Patterns: Capture conceptual models in an application domain in order to allow reuse across applications (Fowler 1997).
·
Organizational Patterns: Describe the structure and practices of human organizations (Coplien and Harrison 2004).
·
Process Patterns: Describe the Software Design Process (Lonchamp 1998; Coplien and Harrison 2004)
The basic format of a pattern that we use in this thesis is taken from the Process Pattern format (Coplien and Harrison 2004) and can be seen in Table 1. Pattern Format Problem: A problem growing from the Forces Context: The current structure of the system giving the context of the problem Forces: Forces that require Resolution Solution: The solution proposed for the problem Resulting Context: Discusses the context resulting from applying the pattern. In particular, trade-offs should be mentioned Design Rationale/Related patterns: The design rationale behind the proposed solution. Patterns are often coupled or composed with other patterns, leading to the concept of pattern language. Table 1: The basic structure of a pattern (taken from (Gamma, Helm et al. 1995) )
26
The pattern name should be descriptive in order to communicate the essence of the pattern (Coplien and Harrison 2004). The context gives an indication of the current structure of the system and hints on other possible patterns that might be applicable. Both the problem, and the pattern that addresses it, are context dependent. The problem the pattern address lies in this particular context and in general is not context free. The forces describe the different considerations that need to be balanced in the solution and hence can be considered a part of the problem. The solution represents the preferred way to deal with the problem based on knowledge from best practice solutions gathered from practitioners and researchers. The resulting context discusses the situation after the solution has been applied and the design rationale describes the reason behind the prescribed solution. Finally the related patterns list the patterns that can be and are often coupled with the pattern under consideration to form a pattern language. As an example we can consider the Core-Periphery Shift Pattern that we describe later in Table 7. The problem of this pattern describes the loss of interest among the developers in the particular project. The context describes the context of Open Source where developers have implicit roles of either working on the Core or the Periphery (including documentation) of the software. The forces describe the constraints that require resolution, namely, that core developers lose interest in the project and move to developing the peripheral parts of the software and later leave the project. The solution describes a resolution of the problem through creating more interest among the core developers for the Open Source project. The resulting context describes the situation after the solution has been applied to the problem and in the case of this pattern this results in more number of developers being interested in the core modules of the software project. Some of the problems concerning development activities have been collected and described by Coplien et al.(2004) including a set of what they call Process Patterns to deal with these coordination problems. As the term process patterns is also used in business process management and workflow, we prefer to use the term Socio/Technical Patterns to refer to those patterns involving problems related to the social, technical and the socio-technical aspects of the software process. Lonchamp (1998) provides one such example of process patterns in the context of process centered systems (workflow management systems). He uses the concepts of tasks, control flows, data flows (and sharing) to come up with process patterns that cover some of the most important collaborative situations(Lonchamp 1998). As they capture a wide variety of knowledge and experience, Socio/Technical Patterns are potentially very useful to aid the project manager in planning and monitoring a complex development project. For example, the Conway’s Law Pattern (described later in this section) describes the problem that occurs when the communication structure of the company does not match the technical dependencies. A software manger could use this 27
pattern to identify the members of the project who communicate frequently when there are no technical dependencies as well the technical dependencies that are not satisfied through communication (Sosa, Eppinger et al. 2004; Cataldo, Wagstrom et al. 2006; Sosa 2008). However, these patterns have not been extensively validated empirically and can be hard to implement. The lack of empirical validation makes it complex for the project manager to decide on which Socio/Technical patterns to apply to his project. The reason why the patterns are hard to implement is that the problems addressed by the patterns are hard to identify, as existing techniques are labour intensive and as both social as well as technical networks continuously evolve during a project.
3.4 Overview of Patterns and Structure Clashes There are three kinds of structure clashes, those at the social level (where the planned process model doesn’t match the actual social network, Figure 5), those at the technical level (where the actual software architecture doesn’t match the planned, Figure 5) and those at the Socio/Technical level (where the planned module level task allocations 1do not match the actual, Figure 5). In this Chapter we focus on specific coordination problems that we call Socio/Technical Structure Clashes (STSCs) (the set of Social, Technical and Socio-Technical Structure Clashes). A Socio/Technical Structure Clash occurs if and when a Socio/Technical Pattern exists that indicates that the social network of the software development team does not match the social/technical dependencies within the software architecture under development. Though these clashes are present as patterns in literature (Coplien 1994; Coplien and Harrison 2004), these patterns are not always applied in the implementation phase of software development. Over a period of time the designed process model evolves into a social network of developers with a different task allocation than that planned at the design phase. The software architecture also evolves over time and usually becomes very different from what was envisioned at the planning phase (Guo, Atlee et al. 1999; Murphy, Notkin et al. 2001)(Figure 5). This is a problematic scenario as the manager responsible has no control over the project anymore. This lack of control could cause too many connections and errors in the architecture leading to extensions and project overruns. In the case of Structure Clashes in the software architecture, one choice is to ignore the transformation and to proceed with the task based on information from the source-code. In the case of the gap in the process model, one can continue with the development based on tasks assigned locally within the project teams. Though these strate1
A module level task allocation specifies which developers need to develop the specific module or group
of modules.
28
gies may work in small systems and teams, in larger development projects this could lead to inappropriate choices and delays in development (Murphy, Notkin et al. 2001) that result in financial losses for the project. Though there have been research works highlighting the gap between planning and execution in software architecture (Guo, Atlee et al. 1999; Murphy, Notkin et al. 2001), there is not much research conducted in identifying and remedying the gap between planning and execution in the organization and process of implementation of Software Development. While applying Software Patterns can keep the software architecture under managerial control (Guo, Atlee et al. 1999), the same can also be done by applying Socio/Technical patterns to the process and the planned task allocation (Figure 6). In this research we use Socio/Technical patterns in order to spot STSCs. Regular identification of these STSCs can help the manager to apply Socio/Technical patterns to the software process model and thereby keep the software process evolution under control (Figure 6). As seen in Table 2, we approach the literature review of clashes in three separate sections, the purely technical, purely social and the Socio/Technical.
Figure 6: The evolution of the project with time
29
Papers
Technical Clashes
Murphy, Notkin & Sullivan 2001
√
Guo, Yanbing & Atlee 1999
√
Woods & Qiang 1995
√
Baldwin, Bedell & Johnson 1999 Lindvall & Muthig 2008
Social Clashes Socio/Technical Socio/Technical Clashes in En- Clashes in gineering Software Engineering
√ √
Faraj & Sproull, 2000
√
Stewart & Barrick, 2000
√
Cummings & Cross, 2003
√
Yang &Tang 2000
√
Sparrow, Liden, Wayne & Kramer 2001 Morelli, Eppinger, IEEE TEM1995 Sosa & Eppinger 2004
√
√
√
Wagstrom & Herbsleb, 2006
√
Cataldo, Wagstrom, Herbsleb, 2006
√
Sosa, 2008
√
Ovaska, Rossi & Marttiin 2003 MacCormack & Rusnack, 2004
√
√
√
Table 2: Literature Overview
30
Figure 7: Pattern usage at both the Planned and Execution stages can help Project Management
3.4.1 Technical Structure Clashes A Technical Structure Clash occurs if and when a Technical Pattern exists that indicates that the technical architecture of the software development project does not match the actual technical dependencies within the software architecture under development. The technical architecture of the software system may drift from the documented architecture if architecture changes are made during software implementation and no effort is made to maintain the architecture documents. In the past, reverse engineering methods have been used to prevent the software architecture from drifting. One of the reverse engineering methods has been to extract the software’s call-graph and compare it with the expected call-graph ((Woods and Yang 1998); Murphy, Notkin et al. (2001)). Guo et al.(1999) describe a semi-automatic analyses that codifies heuristics (in accordance to Design Patterns) in order to apply existing reverse-engineering tools. Also, there are a number of reverse engineering tools developed to automatically extract, manipulate and query source model information. For example, Rigi (Wong, Tilley et al. 1995), LSME (Murphy and Notkin 1996) , IAPR (Kazman 1998), Reflexion Model Tool (Murphy, Notkin et al. 2001) and Deli (Kazman and Carriere 1998) are some of the reverse engineering tools used in practice. Lindvall and Muthig (2008)describe a tool and an accompanying process called SAVE to align a software system with its planned architecture. The SAVE method consists of finding the original architecture and comparing it with the actual architecture (generated from the
31
source code) and then determining if the deviations are critical enough to take action (Lindvall and Muthig 2008). Though there are many tools for reverse engineering the software architecture we find very few tools to do that same with the Software Process Model. Table 3 provides an overview of the papers on Technical Structure Clashes. Papers
Description
Wong, Tilley Provide a method of identifying, building and documenting legacy systems through et al, 1995 their software tool called Rigi. Woods & Yang 1998
Guo, Yanbing & Atlee 1999 Murphy, Notkin & Sullivan 2001
Present a model of program understanding through constraint satisfaction. They “build mappings” from the legacy code to the program design plans and vice-versa, in order to assist an expert in reverse engineering, program re-use or translation of the source to another programming language. Describe a semi-automatic analyses that codifies heuristics (in accordance to Design Patterns) in order to apply existing reverse-engineering tools Provide a software reflexion model technique to bridge the gap between high-level models and the software artefacts of a software system.
Lindvall & SAVE method consists of finding the original architecture and comparing it with the Muthig 2008 actual architecture (generated from the source code) and then determining if the deviations are critical enough to take action Table 3: Overview of the papers on Technical Structure Clashes
3.4.2 Social Structure Clashes A Socio Structure Clash occurs if and when a Social Pattern exists that indicates that the social network of the software development team does not match the social dependencies within the software development team or organization. In this section we deal with Social Network based structure clashes or Social Structure Clashes. A Social Network “consists of a finite set or sets of actors and the relation or relations defined on them” (Wasserman and Faust 1994). Where actors are discrete individual, corporate or collective social units and relations are a “collection of ties of a specific kind among members of a group” (Wasserman and Faust 1994). Teams are the basic building block for many contemporary business organizations. Structure clashes are dealt with in organizational literature by focussing on how one can improve coordination in software development projects using the concepts of coordination between and among teams keeping task assignment as a moderating variable. Coordination refers to team-situated interactions aimed at managing resources and expertise 32
dependencies (Faraj and Sproull 2000; Fenema 2002). Research on software development teams has found that team performance is linked with the effectiveness of teamwork coordination (Kraut and Streeter 1995). Faraj and Sproull (2000) take two perspectives on coordination: administrative coordination and expertise coordination. They claim that administrative coordination (management of tangible and economic resource dependencies) is good for simple routine tasks, while for complex non-routine intellectual tasks, expertise coordination (the management of knowledge and skill dependencies) become more important. Through expertise coordination the team can recognize and access expertise when it’s needed. Stewart and Barrick (2000) build on organization-level findings and show that differences in how responsibilities are apportioned and coordinated correspond to variance in performance at the team level. They also show that the effect of these social elements is moderated by technical demands (tasks), consistent with socio-technical systems theory. Sparrowe et al. (2001) hypothesize that centrality in a work group’s advice network will be positively related to an individual’s job performance. Where centrality in the advice network reflects an individual’s involvement in exchanging assistance with co-workers and engaging in mutual problem solving. An individual who is central in the advice network is, over time, able to accumulate knowledge about task-related problems and workable solutions (Baldwin, Bedell et al. 1997). While the central individual develops problem solving capability and serves as a valued resource for future exchanges with coworkers, those individuals who are in peripheral positions in the advice network find it difficult to develop expertise and competencies for high levels of performance (Sparrowe, Liden et al. 2001). Hence, Sparrowe et al. (2001) hypothesize that centralization in a work group’s advice network is negatively related to group performance. Cummings and Cross (2003) study how the structure of groups relates to the group’s performance given that the group performs complex and non-routine tasks. They conduct a case study of different work groups in a telecommunications firm and find that the greater the hierarchical structure of the group the worse is the performance of the group’s members and manager. They also conclude that the greater is the core-periphery structure of the group the better is the performance of the group’s members. Furthermore, they find that the greater the structural holes (Burt,(1992)) of the leader the worse would be performance of the team. Yang and Tang (2004) analyse the relation between team structure and the performance of information systems development using a social network approach. They show how the structural properties of the work groups fluctuate during the various phases of software development, and how group cohesion and centrality are related to the final ISD 33
performance. Though Yang and Tang (2004) do show how social research methods can be used to tackle “group process” factors, they do not deal with task allocation nor do they illustrate how one can solve the problem of task allocation among team members. Robert et al.(2008) study the performance of distributed student teams using a laboratory experiment. In particular, they analyse the extent to which team members were able to integrate information they uniquely possessed in order to influence the team decision making. They find that structural capital (the frequency and decentralization of prior communication in the group) is associated with better knowledge integration when the teams communicate using a synchronous text based chat. Table 4 provides an overview of the papers on Social Structure Clashes. Papers
Description
Baldwin, Be- Determine how individual centrality in the communication and friendship networks affect the dell & Johnson perception of learning and enjoyment among students. They also determine how the relation1999 ships within and between teams effect the perceptions of team effectiveness and team performance. Take two perspectives on coordination: administrative coordination and expertise coordinaFaraj & tion. They show that administrative coordination is good for simple routine tasks, while for Sproull, complex non-routine intellectual tasks, expertise coordination becomes more important 2000 Stewart & Build on organization-level findings and show that differences in how responsibilities are apBarrick, portioned and coordinated correspond to variance in performance at the team level 2000 Sparrow, Liden, Wayne & Kramer 2001 Cummings & Cross, 2003
Hypothesize that centrality in a work group’s advice network will be positively related to an individual’s job performance.
Yang &Tang 2004
Analyse the relation between team structure and the performance of information systems development using a social network approach. They show how the structural properties of the work groups fluctuate during the various phases of software development, and how group cohesion and centrality are related to the final ISD performance. Study the performance of distributed student teams using a laboratory experiment. In particular, they analyse the extent to which team members were able to integrate information they uniquely possessed in order to influence the team decision making. They find that structural capital (the frequency and decentralization of prior communication in the group) is associated with better knowledge integration when the teams communicated in a chat room.
Robert et al.(2008)
Study how the structure of groups relates to the group’s performance given that the group performs complex and non-routine tasks. They conduct a case study of different work groups in a telecommunications firm and find that the greater the hierarchical structure of the group the worse is the performance of the group’s members and manager
Table 4: Overview of the papers on the Social Structure Clashes
34
3.4.3 Socio-Technical Structure Clashes A Socio-Technical Structure Clash occurs if and when a Socio-Technical Pattern exists that indicates that the social network of the software development team does not match the technical dependencies within the software architecture under development. STSCs are thus indicative of coordination problems in a software development organization. We find a lot of literature in the organizational, production engineering domain that deals with task allocation and coordination among the workers. While the use of Design Structure Matrices (DSM) to locate coordination problems in the field of software engineering is relatively less. DSMs (also known sometimes as Dependency matrices) have been used in engineering literature to represent the dependency between people and tasks (Steven, Daniel et al. 1994). Recent empirical work uses DSMs to provide critical insights into the relationship between product architecture and organizational structure. Morelli et al. (1995) describe a method to predict and measure coordination-type of communication within a product development organization. They compare predicted and actual communications in order to learn, to what extent an organizations communication patterns can be anticipated. Sosa et al.(2004) find a “strong tendency for design interactions and team interactions to be aligned,” and show instances of misalignment are more likely to occur across organizational and system boundaries. Sullivan et al. (2001) use DSMs to formally model (and value) the concept of information hiding, the principle proposed by Parnas to divide designs into modules (Parnas 1972). In the field of software engineering the application of DSM principles has been less and infrequent compared to other engineering domains. The following paragraphs give an overview of the literature in software engineering that deals with problems of coordination between people and technical tasks using DSM concepts. de Souza et al. (2004) describe the role played by APIs (Application Program Interfaces) which limit collaboration between software developers at the recomposition stage (Grinter 1998). Cataldo et al.(2006) as well as Wagstrom and Herbsleb (2006) do the same study of predicted versus actual coordination in a study of a software development project in a large company project. Their work provides insights about the patterns of communication and coordination among individuals working on tasks with dynamic sets of interdependencies.
35
Sosa (2008) builds on the DSM based method of Cataldo et al. (2006) and provides a structured approach to identify the employees who need to interact and the software product interfaces they need to interact about. Ovaska, Rossi and Marttiin (2003) describe the role of software architecture in the coordination of multi-site software development through a case study. They suggest that in multi-site software development it’s not enough to coordinate activities, but in order to achieve a common goal, it is important to coordinate interdependencies between the activities. The interdependencies between various components are described by the software architecture. Therefore, if the coordination is done by using the software architecture, the work allocation is made according to this component structure. In splitting work along the lines of product structure one must consider the modular design of the product in order to isolate the effect of changes (Parnas 1972). MacCormack and colleagues (2006) reiterate Conway’s argument (Conway 1968) when they compare commercial and open source development . As the software developers, in their study were collocated in the commercial project, it was easier to build tight connections between the software components, therefore producing a system more coupled compared to the similar open source project with distributed developers. While the Conway’s Law relation between the task and coordination of the developers has been described through empirical studies (Curtis, Krasner et al. 1988; Morelli, Eppinger et al. 1995; Grinter, Herbsleb et al. 1999; Herbsleb and Grinter 1999), we use this Conway’s law as a means to identify a possible STSC in the software development process (as we shall explain in the section that follows). Table 5 provides an overview of the papers on Social-Technical Structure Clashes.
36
Papers
Description
Morelli, Eppinger, IEEE TEM1995 Sullivan et al, 2001
Describe a method to predict and measure coordination-type of communication within a product development organization. They compare predicted and actual communications in order to learn to what extent an organizations communication patterns can be anticipated
Ovaska, Rossi & Marttiin 2003
Describe the role of software architecture in the coordination of multi-site software development through a case study. They suggest that in multi-site software development it’s not enough to coordinate activities, but in order to achieve a common goal, it is important to coordinate interdependencies between the work allocations made according to the software architecture.
Sosa & Eppinger 2004
Find a “strong tendency for design interactions and team interactions to be aligned,” and show instances of misalignment are more likely to occur across organizational and system boundaries.
deSouza et al, 2004 Cataldo, Wagstrom, Herbsleb, 2006 Sosa, 2008
Use DSMs to formally model (and value) the concept of information hiding, the principle proposed by Parnas to divide designs into modules (Parnas 1972).
Describe the role played by APIs (Application Program Interfaces) which limit collaboration between software developers at the recomposition stag Study the predicted versus actual coordination in a study of a software development project in a large company project. Their provide insights on the patterns of communication and coordination among individuals working on tasks with dynamic sets of interdependencies Builds on the DSM based method of Cataldo et al. (2006) and provides a structured approach to identify the employees who need to interact and the software product interfaces they need to interact about Table 5: Overview of the papers on Socio-Technical Structure Clashes
3.5 Revisiting the Research Questions Given an understanding of Socio/Technical Patterns as well as the related Socio/Technical Structure Clashes (STSCs), we can now provide a more precise statement of the research problem, namely: How can a manager identify STSCs in an ongoing software development project? The related research question is then: Can a tool as well as a related method be developed in order to qualitatively as well as quantitatively identify STSCs in a software development organization? In the case of Open source software development the STSCs that one can possibly identify depends on which Socio/Technical patterns are applicable to the Open Source software development context. So, first we need to see if the patterns applicable to the com-
37
mercial closed source development process are also applicable in the Open Source context. Are the Socio/Technical Patterns applicable to the commercial closed source software development process also applicable to the Open Source software development process? If the Socio/Technical Patterns applicable to closed source software development are not applicable to the Open Source software development process then we can ask the following question: What are the Socio/Technical Patterns applicable for the Open Source development process and how can we identify STSCs related to the Open Source Socio/Technical Patterns? Existing work related to identifying STSCs needs further explanation; this is provided in the next section. While the research methodology used as well as the construction design and validation of the software tool used to identify STSCs is described in more detail in the following Chapters.
3.6 Identifying Socio/Technical Structure Clashes Pentland et al.(1999) suggest that there are two ways of identifying appropriate set of dependencies in an organization namely the top-down and the bottom-up approach. The top-down approach proposes a dependency and then tries to find the activities that coordinate the dependency. While the bottom-up approach proposes dependent activities and then tries to find the dependencies the activities manage or participate in. Osborn (1993) provides the following three heuristics to identify dependencies and coordination mechanisms: (i) activities in the current process can be examined in order to identify the dependencies they manage, (ii) the activities and resources in a particular process can be listed in order to identify the dependencies between them as well as the coordination mechanisms used to manage the dependencies and finally (iii) process can be scanned in order to indentify problem in them that indicate unmanaged coordination problems and then identify the underlying dependencies from of these problems. Both the papers mentioned above use the concepts from a Coordination Theory perspective (Malone and Crowston 1994; Crowston 1997; Malone, Crowston et al. 1999). Such a perspective is broad and a little abstract to apply in an organizational setting. In order to have a more practical approach researchers in the field of CSCW and Software Engineering have come up with tools that read the software source code and generate visuali38
sations in order to identify Socio/Technical Structure Clashes. While there are many tools available for dealing with Technical Structure Clashes, there are few tools available for Socio/Technical Structure Clashes. ‘Augur’ is a visualization tool that supports distributed software development process by creating visual representations of both the software artefacts and the software development activities (Froehlich and Dourish 2004). de Souza et al. (2004) have developed a tool that checks dependency relationships between software call graphs and developers. Also DSMs are used for forecasting dependencies and checking for Conway’s Law STSC between developers (Cataldo, Wagstrom et al. 2006). These tools check for only one particular STSC and do not provide extensive software process re-engineering guidance. Identifying the STSCs related to Socio/Technical patterns (Coplien and Harrison 2004) can prove difficult for medium to large distributed or collocated teams working on large software projects. These Socio/Technical patterns apply to ambitious, complex endeavours, that may comprise hundreds of thousands or millions of lines of code, while the size of the organizations range from a handful to a few dozen (Coplien and Schmidt 1995). The Socio/Technical patterns can however be applied to larger organizations, if they are broken into smaller decoupled parts, where the patterns can be applied to the smaller parts of the organisation. We contend that this problem related to a lack of control of the software project can be solved by a periodic assessment of STSCs through using a proper tool and method. In the next section we discuss the Socio/Technical Patterns used in this thesis
3.7 Patterns and STSCs used in this Research In this thesis we have applied and tested Social, Technical and Socio-Technical as earlier. As described earlier we refer to the three Patterns simultaneously with the term Socio/Technical Pattern. Table 6 provides an overview of the Socio/Technical Patterns used in the context of Corporate Case Studies in Chapters 5 and 6. While the Socio/Technical Patterns used for the Open Source case studies (Chapter 7) are displayed in Table 7. Let us now look at each of the Patterns in more detail.
39
Betweenness centrality match (Freeman, Roeder et al. 1979; Mullen, Johnson et al. 1991; Hossain, Wu et al. 2006) Centrality of important people
Pattern Name
Conway’s Law (Conway 1968; Herbsleb and Grinter 1999a)
Code Ownership Pattern(Coplien 1994; Nordberg 2003)
Problem: A problem growing from the Forces.
Aligning Organization and Architecture
Context: The current structure of the system giving the context of the problem
An architect and development team are in place.
A Developer cannot keep up with a constantly changing base of implementation code. A system with Social Network of the mechanisms to document team at different stages and enforce the software of software development architecture, and developers to write the code
Forces: Forces that require resolution
Architecture shapes communication paths in the organization. Formal organization shapes architecture.
Solution: The solution proposed for the problem
Make sure organization is compatible with the architecture
Resulting Context: Discusses the context resulting from applying the pattern. In particular, tradeoffs should be mentioned
The organization and product architecture will be aligned.
Design Rationale/Related patterns: The design rationale behind the proposed solution. Patterns are often coupled or composed with other patterns, leading to the concept of pattern language.
Historical
Most design knowledge lives in the code; navigating unfamiliar code to explore design issues takes time. Not everyone can know everything all the time. Each code module in the system is owned by a single Developer. Except in exceptional and explicit circumstances, code may be modified only by its owner. The architecture and organization will better reflect each other.
People who are not central to the software development or management take a central role in coordination
Lack of code ownership is a major contributor to discovery effort in large-scale software development today.
Betweenness centrality is a key predictor for coordination
Make sure the important people take a more central role in coordination.
Project critical information will be conveyed to all team members.
Table 6: The Socio/Technical Patterns used for the Corporate Case Studies (Chapters 5 and 6), where the Pattern format is taken from Coplien et al. (Coplien and Schmidt 1995; Coplien and Harrison 2004)
40
3.8 Conway’s Law Pattern The classic paper by Conway (1968) states organizations which design systems are constrained to produce designs which are copies of the communication structure of these organizations. In other words, if the teams involved in software production have shortcomings in their interpersonal relationships, the resulting technical architecture of the software is likely to be flawed. Also, Parnas (1972) described modularisation as a “responsibility assignment” rather than a subprogram, thus implying that software modules must be assigned to different developers as tasks (Parnas 1972). When taken together, the two papers Conway (1968) and Parnas (1972) imply that the dependencies between the software modules should reflect the communication structure of the Software Team in the ideal situation. When this fails to happen then the dependencies between the modules would not be met with communication between the developers. This concept of “homomorphism” between the social communication structure and the technical architectural dependencies has come to be known as Conway’s Law. In this research we call such a situation a Conway’s Law STSC as described in Table 6. Herbsleb and Grinter (1999; 1999a) in their case study of a software development company show that unpredicted events that are difficult to manage can occur due to coordination problems in the particular project. In particular, they refer to coordination problems due to the presence of Conway’s Law STSC and in their words “ qualitative data from the case study strongly supports Conway’s and Pranas’ positions that the essence of good design is facilitating coordination among developers” ((Herbsleb and Grinter 1999a), p69). Morelli et al. (1995) describe a method to predict and measure coordination-type of communication within a product development organization. They compare predicted and actual communications in order to learn to what extent an organizations communication patterns can be anticipated. Sosa et al.(2004) find a “strong tendency for design interactions and team interactions to be aligned,” and show instances of misalignment are more likely to occur across organizational and system boundaries. Sullivan et al. (2001) use DSMs to formally model (and value) the concept of information hiding, the principle proposed by Parnas to divide designs into modules (Parnas 1972). de Souza et al. (2004) describe the role played by APIs (Application Program Interfaces) which limit collaboration between software developers at the recomposition stage (Grinter 1998). Cataldo et al.(2006) as well as Wagstrom and Herbsleb (2006) do the same study of predicted versus actual coordination in a study of a software development project in a large company project. Their work provides insights about the patterns of communication and coordination among individuals working on tasks with dynamic sets of interdependencies. Sosa (2008) builds on the DSM based method of Cataldo et al. (2006) and provides a structure
41
approach to identify the employees who need to interact and the software product interfaces they need to interact about.
3.9 Code Ownership Pattern As described in Table 6, the Code Ownership STSC is based on the Code Ownership pattern (Coplien 1994). The related coordination problem is that a developer would find it difficult to cope with a changing base of code. The same STSC applies to a situation where a developer who was not involved in the development of a particular code is all of a sudden given the responsibility for a particular release of the code. When such a situation occurs, there is a lot of coordination that needs to be done in order to get the new developer instructed on the history of the changes that have been done until then. This situation can create a large coordination requirement, depending on the number of developers who have made changes to the module and on the kinds of changes made until then. The Code Ownership STSC is especially a problem when the developers don’t follow an XP methodology with collective ownership guidelines like continuous integration, 100 percent unit testing and strong coding style guidelines (Nordberg 2003). Code ownership has been widely cited as a coordination mechanism (Mockus, Fielding et al. 2002; Dinh-Trong and Bieman 2005). However, relatively less has been published on the lack of code ownership or the coordination requirements caused by faulty code ownership practices (Nordberg 2003). LaToza et al. (2006) in a survey conducted on developers of a software organization describe how developers maintain mental models of the code. They conclude that personal code ownership is usually tacit and written records are considered out of date and ignored. On the other hand they describe a stronger notion of team code ownership among developers (LaToza, Venolia et al. 2006).
3.10 Betweenness Centrality Match Pattern Centrality index gives us an idea of the potential importance, influence and prominence of an actor in a network. Betweenness refers to the frequency with which a node falls between pairs of other nodes in the network. In other words, betweenness centrality is a measure of, “the degree that each stands between others, passes messages and thereby gains a sense of importance in contributing to a solution, .. , the greater the betweenness, the greater his or her sense of participation and potency” (Freeman 1977). For a graphG (V , E ) , with n vertices, the Betweenness Centrality CB(v ) is defined as: C B (v )
s v t V s t
s t (v ) st
Equation 1: The betweenness centrality of a Graph (Wasserman and Faust 1994)
42
Where, st is the number of shortest geodesic paths from s to t, and st(v ) is the number of shortest geodesic paths through a vertex v. This may be normalised by dividing the number of pairs of vertices not including v. Freeman et al. (1979) performed an experiment where five people (with no previous history of interaction) were placed them in different structural positions while enforcing a strict pattern of communication. They tried to determine which network positions were most conducive to coordination. In the post experimental interviews it emerged that betweenness was the most useful for coordination (Freeman, Roeder et al. 1979). This result was further reiterated by Mullen et al. (1991) who state “the individual in the most centralised position in a network in terms of Betweenness is likely to emerge as the leader…”. They further go on to state “this indicates that the potential for the control of communication is a critical contribution to the participation in, and satisfaction with performance in communication networks.” ((Mullen, Johnson et al. 1991), p13). Hossain et al. (2006) establish a statistically significant relationship between the values of betweenness centrality and coordination using the Enron corpus mailing list (Hossain, Wu et al. 2006). In terms of coordination, betweenness maybe the most appropriate measure of centrality as it provides a measure of the influential control of each node (employee) on the whole networks. This is the reason why betweenness centrality was used to analyse potential STSCs. As de-
scribed in Table 6, a Betweenness Centrality Match STSC occurs when people who are not central to the software development or management take a central role in coordination. Analysing the change in the betweenness centrality index (Freeman 1977) can give us an idea of how the most important employee (or the employee who handles most of the communication) in the network changes depending on the tasks at hand.
3.11 Modularity Pattern Software Modularity has been considered a very important and critical parameter for successful Open Source projects. Authors like O’Reilly (1999) have claimed that Open Source software is inherently more modular than commercial software. While other authors have reasoned that Open Source software needs to be more modular, such that the development process can be coordinated more easily (Mockus, Fielding et al. 2002). On the other hand, there exists literature that have analysed Open Source software quantitatively and that do not agree that it is indeed more modular. Schah et al. (2002) study Linux’s kernel modules and count the number of instances of common coupling (coupling between files due to calls to external variables) and find them to have exponential
43
growth in common coupling for successive Linux version, thus leading to high failure proneness. Pattern Format
Modularity Pattern
Problem: A problem growing from the Forces
Making sure Open Source software has few interdependencies (low coupling) The Open Source software project has software code in place
Context: The current structure of the system giving the context of the problem Forces: Forces that require Resolution
Solution: The solution proposed for the problem Resulting Context: Discusses the context resulting from applying the pattern. In particular, trade-offs should be mentioned Design Rationale/Related patterns: The design rationale behind the proposed solution. Patterns are often coupled or composed with other patterns, leading to the concept of pattern language.
Core-Periphery Shifts Pattern (de Souza, Froehlich et al. 2005) Developers have sustained interest in working on the Core Modules of the software. Developers working on the different areas (Core/Periphery) of the Software.
When the modularity of the software under development has a sharp decrease in modularity (increase in the interdependence of the modules). Make sure that the modularity of the software is kept high, by refactoring the code if necessary
When core developers move on to developing peripheral parts of the software.
The software code will increase its modularity
Make sure that more people are interested in the core part of the software project.
Open Source software needs to be very modular (have low coupling) in order to make coordination easier
The core of the FLOSS project is vital to its performance and hence needs more work in order to reach stability.
Get more developers interested in the core part of the software
Table 7: The Socio/Technical Patterns used in the case of Open Source projects
Yu et al. (2006) compare the common coupling of Linux kernel to the kernels of different software for Open Source projects (FreeBSD, NetBSD and OpenBSD) and find that the amount of common coupling for Linux is much greater than the other Open Source software projects. Paulson et al. (2004) compare the coupling of Open Source projects (Apache, Linux and GCC) with three closed source projects by comparing the growing versus the changing rate for software (as a tighter coupling will require more changes with each additional feature). Their results indicate that Open Source projects need more changes when new features are added, suggesting tighter coupling in Open Source projects than previously understood. MacCormack et al. (2006) compare the architectures of Linux and Mozilla by comparing the pattern of distribution of their software coupling. They find that while Linux had a more modular structure than the first version of Mozilla, after a redesign the resultant architecture of Mozilla was more modular than the 44
previous versions and even more modular than Linux. As Mozilla was redesigned in an effort to make it an Open Source project, this result is in line with the view that in order to have a successfully coordinated Open Source project one needs to have a loosely coupled and modular software (MacCormack, Rusnak et al. 2006). So, in view of this literature background, we claim that a Modularity Technical Structure Clash occurs when the interdependence or coupling of the software under development has a sharp increase (Table 7).
3.12 Core-Periphery Shift Pattern de Souza et al. (2005) identify changes in developer positions in different Open Source projects by studying the Socio-Technical network of developers. They notice a core periphery shift by mining software repositories. The core-periphery shift in a healthy Open Source project is when the peripheral developers move from the periphery of the project to the core, as their interest and contribution in the project increases (de Souza, Froehlich et al. 2005). The notion of Core-Periphery used in this research is not from the perspective of the social structure of the developers as described by Crowston et al. (2006). It is from the Socio-Technical perspective similar to the Core-Periphery definition from de Souza et al.(2005) and Lopez-Fernandez et al.(2006). At the same time it is different, as we cluster the software and then determine the core and periphery of the clustered graph. So, in this research we build on the definition of Core-Periphery by de Souza et al. (2005). They define Core and Periphery in terms of the dependencies between developers, i.e. from the developer to developer dependency network. The notion of Core-Periphery developed in this research is Socio-Technical in nature and different from the notion of Core-Periphery in Socio Network literature (Borgatti and Everett 2000). We propose that a Core-Periphery Shift STSC occurs if and when the developers working on the core of the project move towards working on the periphery of the project and at the same time developers working on the periphery don’t move to the core. This is especially true if the core of the software is not stable, but on studying different Open Source projects with stable software cores we think one can safely say that its true for most if not all Open Source projects. This Open Source STSC is illustrated in Table 7. In order to better understand the notion of Core-Periphery Shift a longer more exhaustive literature review is presented in Chapter 7 where the Core-Periphery Shift Pattern is also validated using case studies on eight Open Source software projects. In the next Chapter (Chapter 4) we shall the TESNA method and tool in more detail.
45
4. TESNA Tool Design 4.1 The TESNA Method and Tool The overall Method consists of several steps. First, we assume that the Project Manager has a fairly good idea about the different Socio/Technical Patterns and about which specific pattern or groups of Patterns have to be applied in the current project situation. Next, TESNA accepts input for the Social Network as well as the Software Architecture (and the software code), and the tool provides a visual description of the networks and metrics, based on the Socio/Technical Patterns selected. If the Project Manager identifies an STSC, he can decide whether his planned software process model is good or needs to be changed. The Project Manager can also decide to alter the social network as well as the software architecture and then carry out this process iteratively until he is satisfied. Figure 8 indicates two labelled loops, namely loop SN (the Social Network loop) and loop ST (the Socio/Technical loop). The SN loop corresponds to the Social Network Module of TESNA. The Social Network Module reads input on the Social Network, by mining Chat/Mail/Bug tracker Repositories. The Social Network data can later be confirmed through more qualitative interviews and questionnaires.
Figure 8: The TESNA Method and the Planned Software Process
46
The tool then creates social network images and calculates metrics to show the changes of the networks over time. The application of the method involving the SN loop can be seen in Chapters 5 and 6. The ST loop corresponds to the Socio/Technical Module of TESNA. The Socio/Technical module reads input on the Socio/Technical aspects of the software development process. In order to read the technical network the tool reads the source code (currently TESNA can handle java source code) and in order to find out the Socio-Technical links the tool mines Software Configuration Management Systems like CVS (Concurrent Versioning System) and SVN (SubVersion). TESNA uses different displays to help identify the existence of STSCs related to the social network or the software call graph. The tool uses both qualitative as well as quantitative data to help in the identification of STSCs. The qualitative data is represented in the form of different kinds of visualizations of the social as well as the technical networks, while the quantitative data consists of various metrics that the tool calculates to augment the qualitative data. The display requires the manager to decide if a particular STSC is problematic and needs to be worked on while the metric related to the STSC shows the manager the extent of the problem. The reason we adopted this approach was that for the purposes of this research a “software archaeology” (Hunt and Thomas 2002) approach sufficed and a “real time” STSC identification system was not required. In Chapter 5 the case study in a company called Mendix is discussed (Amrit and Van Hillegersberg 2007), where only the SN loop is applied. While, in Chapter 6, in a case study of a company called eMaxx both the SN and ST loops are applied. The primary reason behind this is that as an iterative Design Research methodology was used in the design of the TESNA method and tool, the tool did not have the requisite functionality (for the ST loop) during the first Mendix case study. This functionality was developed after the data collection in the Mendix case (Chapter 6). The complete TESNA method (as described in Section 2.3.1) is described in the Mendix case study and follows the following steps: i. ii.
iii.
In a meeting with the company’s CTO; the technical architecture, the task and team allocation of the different employees is discussed The different code repositories used by the developers are analysed. The important core modules relating to different projects are then determined through interviewing the Managers and select employees. The call graph structure, the clustering and the coupling metrics of these modules are analysed in more detail. The different communication and coordination mechanisms used by the employees are first analysed. Then, the most representative mode of communication and coordination are determined through various interviews of the Managers and em-
47
ployees. The corresponding communication repositories (e-mail, chat and bug tracker) are then analysed in more detail. iv. After analysing the data from the code repositories, the data in the form of graphs is taken back to the developers for their feedback v. The same procedure (as (iv)) is repeated with the data analysed from the communication repositories. This time, the data (especially the accuracy of the mined social network) is discussed with each of the employees involved through faceto-face interviews. vi. After determining if the data is valid and is an accurate representation of the social and technical structures, the data is analysed to identify STSCs. vii. After identifying STSCs, the Managers responsible for the particular projects in which the STSCs were identified are again interviewed in order to obtain their feedback on the findings. viii. A research presentation and feedback session is arranged with the employees of the company in order to get their feedback on many of the STSCs. ix. Follow-up interviews of the project members are then held in order to ascertain the reason for the occurrence of some of the STSCs. In the next section an overview of the TESNA tool functionality is presented.
4.2 Tool Overview TESNA mines the code repository in order to gather the software call graph, as well as the e-Mail, Chat, Bug tracker (depending on the availability) archive in order gather the communication network of the development and management teams. A manager, with the help of TESNA can see a snapshot of the social network of the development team, call graph of the software, as well as who is modifying which part of the software. TESNA uses different displays to help identify the existence of different Socio/Technical Structure Clashes (STSCs) related to the social network or the software call graph. TESNA also displays who is currently working/modifying the different classes in the call graph, in order to identify STSCs associated with the software process. The tool uses both qualitative as well as quantitative data to help in the identification of STSCs. The qualitative data is represented in the form of different kinds of visualizations of the social as well as the technical networks, while the quantitative data consists of various metrics that the tool calculates to augment the qualitative data. While the display requires the manager to decide if a particular STSC is problematic and needs to be worked upon, the metric related to the STSC shows the manager the extent of the problem. Figure 9 represents the complete UML diagram of the TESNA tool. The UML diagram shows the central control centre the TesnaToolGUI, which displays the networks 48
generated as a result of possessing one of the three modules, namely the Technical, Socio-Technical and the Social Network Module. Unless mentioned specifically, all the components were developed by the author of this thesis. The different Open Source module libraries used in TESNA are described in the TESNA functionality section that follows. The visualization of the network is in the form of a graph that can either be a one mode or a two mode network (bipartite graph). The graph consists of vertices and edges and the vertices can be clustered to improve understanding. We now represent the functioning of the tool. To begin with, one must shortlist the Socio/Technical patterns applicable to the case study in concern. The TESNA tool process starts when the input is selected and fed into the tool. Once the data is fed into the tool, one must decide on which STSCs one is interested in identifying. Depending on the choice of the STSCs, TESNA displays different graphical visualizations as well as metrics that can help in the identification of the particular STSCs. The tool then displays the visualization as well as the metrics. The manager can then see the social and technical structures and decide if an STSC exists (with the help of the display) and if the STSC is serious enough (with the help of the metric) to take action upon. The user then has a choice to continue or exit the tool. As all the three modules can analyse longitudinal data, the user has to start by selecting a time slice for the data.
49
Figure 9: Class diagram for TESNA
Then the different data in the time slice can be taken as input in order to generate the longitudinal metrics and graphs. The sequence diagram of the Technical Network Module of TESNA is displayed in Figure 10. The Technical Network Module starts by reading the Source Code and constructing and displaying the call graph of the Source Code file (jar file for Java source). The call graph of the software is computed with the help of libraries from the Open Source project called Dependency Finder (Tessier). The user then can choose to cluster the call graph. The clustering is done by the DSM Clusterer 50
(developed as part of this research with the help of Erik Hegeman (Hegeman 2007)) that also calculates metrics related to the Design Structure Matrix (DSM) of the source code, namely Propagation Cost and Clustered Cost (explained later in Section 4.4.2). These metrics are then displayed along with the Clustered Call Graph (Figure 16).
Figure 10: Sequence diagram of the Technical Network Module of TESNA
In Figure 11, the sequence diagram of the Socio-Technical Network Module of TESNA is represented. The Socio-Technical Network Module starts by mining the software repository for the developer code information (who has worked/modified which of the software modules). TESNA can then access the Technical Network Module that reads the Source Code of the software and creates the call graph of the software (as described above). On user input TESNA can then calculate and display who has modified which part of the call graph. This information is displayed as a Socio-Technical Call Graph (a slightly modified two mode or bipartite network, Figure 17). On user input TESNA can also cluster the call graph of the source code by invoking the DSM Clusterer module. The DSM Clusterer also calculates the Propagation as well as the Clustered Cost, while the Socio-Technical Network Module calculates the Core-Periphery Metric. The SocioTechnical Clustered Call Graph (a two mode or bipartite network with the call graph Clustered, Figure 18) is then returned to the TESNA Tool GUI for display.
51
Figure 11: Sequence diagram of Socio-Technical Network Module of TESNA
The sequence diagram of Social Network Module is represented in Figure 12. The Social Network Module first connects and then mines the communication repository (Mail Server, Chat server or Bug tracking software according to the availability in the particular case) for data relating to who has spoken to whom and when. We then check if the communicated information is work related. The Social Network Module then creates a graph related to the work related Social Network. On user input the Social Network Module also calculates the Betweenness and the Degree centrality of the networks and displays the trend of the change of betweenness centrality as a graph. Depending on the particular case study the user can decide which metrics should be collected.
52
Figure 12: Sequence diagram of Social Network Module of TESNA
4.3 The TESNA Visualization Novick et al. (2001) consider three spatial diagrams for describing graphs namely the matrix, network and the hierarchy. In an empirical study on college students, they ask the students to determine which spatial diagram is better for a specific scenario. They conclude that a Matrix representation is better for the representation of absent links while a hierarchy or a network is better suited for the representation of a node link diagrams. Hence, we use the node-link representation in TESNA for the visualization of the DSMs in TESNA. Affiliation networks (networks that include both social actors and events) has been represented by affiliation matrices (or incidence matrices), bipartite graphs and hypergraphs (Seidman 1981). TESNA uses the Java Universal Network Graphics (JUNG; Madadhain, Fisher et al. 2005) package to display the node-link diagrams and in particular bipartite graphs to represent affiliation networks (consisting of both software developers and the software modules they are developing). In order to differentiate the software class modules and the developers the software class nodes are coloured red while the developers are coloured blue. The developer’s names are displayed while the names of the software class modules appear only as a tool tip (in order to not complicate the graph further). Large graphs can cause problems of usability and discern-ability. Though, large graphs can give an indication of the overall structure or that of some location within it, in general, the display of large graphs makes them difficult to comprehend. It follows that it is easier to comprehend and perform a detailed 53
analysis of graph structures when the size of the graph is small (Moody and Flitman 1999). Moody (2007) describe the possibility of cognitive overload in Information Systems diagrams when the number of elements is more than nine (using the famous seven plus or minus two rule) which build on the work by Miller (1956). For this reason TESNA clusters the call graph in nine clusters (Algorithm 1). Though, the number of clusters can be changed quite easily, as it is a parameter for the program.
4.4 Tool Functionality The TESNA tool contains functionality to identify STSCs both qualitatively (with the different visualizations and quantitatively (with the help of metrics). In both cases TESNA uses the Design Structure Matrix in order to store and process the network data. This Design Structure Matrix data structure is explained in more detail in the next section. 4.4.1 The Design Structure Matrix (DSM) TESNA uses the Dependency Structure Matrix as the basic data structure for the tool. Since the concept of the Design Structure Matrix was first proposed by Steward (1965; 1981), Dependency Structure Matrices have been used in engineering literature to represent the dependency between tasks. A DSM highlights the inherent structure of a design by examining the dependencies between its component elements in a square matrix (Steward 1981; Eppinger, Whitney et al. 1994; Amrit and van Hillegersberg 2007). Morelli and Eppinger (1995) describe a way to compare the predicted and actual communication in an organization (Morelli, Eppinger et al. 1995). Sosa, Eppinger et al.(2002) describe factors that influence the frequency of communication and choice of media in a geographically distributed development organization (Sosa, Eppinger et al. 2002). In another study Sosa, Eppinger and Rowles (2003) compare the DSM formed through the interaction of system components with the DSM of the technical interactions among team members (Sosa, Eppinger et al. 2003). Sosa, Eppinger and Rowles (2004) highlight the factors that impact the misalignment of the product and the organizational structures (Sosa, Eppinger et al. 2004). Figure 13 shows an example of a simple DSM. The letters A-E, on both axis of the matrix, represent tasks. An ‘x’ in location (a,b) of the matrix means that the task of row a depends on the task in column b. Dependencies below the gray diagonal represent ‘feed forward information’, while tasks above the diagonal represent feedback, for example, task E gives feedback on task C. In this example, tasks A and B depend on each other.
54
Figure 13: Example of a DSM
MacCormack et al. (2006) compare the DSMs of a commercial and a pure open source project and show how the structure of the code in the project reflects the organizational structure that created it (MacCormack, Rusnak et al. 2006). This is similar to what Conway said in his paper (Conway 1968). More recently Li et al. use dependency matrices to analyse dependencies between components in a Component Based System (Li, Zhou et al. 2005). While Cataldo et al. show how DSMs can be used to predict coordination in a software development organization and then they compare the predicted coordination DSM with the actual communication DSM (Cataldo, Wagstrom et al. 2006). Dependency Structure matrices have been used in engineering literature to represent the dependency between people and tasks (MacCormack, Rusnak et al. 2006). Cataldo et al. define what they call Task Dependency Matrix and Task Assignment Matrix that represents the task dependencies and the people working on specific tasks respectively (Cataldo, Wagstrom et al. 2006). In this research we define a Software Module DSM (SM) to represent the dependencies between the software classes (We take the software class to be the smallest unit of measurement as in MacCormack et al. (2006)) We now discuss the functionalities of TESNA based on the different DSMs. We consider the following DSMs for each of the different functionalities: 1) Technical Structure Analysis: Software Module DSM (SM) & Cluster Dependency Matrix 2) Social-Technical Structure Analysis: Software Module Affiliation DSM (SMA) & People Cluster Matrix 3) Social Structure Analysis: Software Developer DSM (SD) & Social Network DSM (SN) 4.4.2 Technical Structure Analysis To perform the Technical Structures Analysis TESNA first captures the dependencies between the software modules and stores it in a Software Module DSM (SM). In the current implementation SM represents function call dependencies. In order to calculate the call graph (technical dependencies) between the software components TESNA uses the 55
libraries of an open source project called Dependency Finder (Tessier). We could also add other kinds of dependencies like logical coupling (Gall, Hajek et al. 1998). TESNA can read the source code file and construct the call graph of the software. At present, the tool supports reading java code files (jar files) to determine the technical dependencies between the different components or modules of the software. TESNA uses JUNG (O’Madadhain, Fisher et al. 2003) to display the SM as shown in Figure 14.
. Figure 14: Call Graph of JEdit
Figure 14 represents the Call Graph or the dependency graph of an open source project called JEdit. Each red node represents one java class object of JEdit. As this Call Graph is already quite complex, we don’t display the names of the class objects and instead use the tool tip if the user hovers above interesting areas of the Call Graph. We will show later how we reduce this complexity further by clustering the Call Graph. 4.4.2.1 The Clustering of Class Objects To represent the people and the software in an understandable way we cluster the software into clusters according to the class level dependencies (Fernandez 1998) and display who is working at which cluster for the particular time period of the data. The algorithm we use is as follows:
56
Algorithm 1: The algorithm used for clustering the Software Module DSM (adapted from(MacCormack, Rusnak et al. 2006))
In the above algorithm the vertical buses are those elements in the SM whose “vertical dependencies” (ones in the vertical columns of the SM matrix) to other elements is more than a specific threshold (MacCormack, Rusnak et al. 2006). These elements are important, as they are common functions called by other modules (MacCormack, Rusnak et al. 2006). Once these vertical buses are identified a DependencyCost is assigned to each module, element of SM. This DependencyCost is assigned as follows: DependencyCost(i j | j is a vertical bus) dij
DependencyCost(i j | j is a vertical bus) dij n
DependencyCost(i j | j is a vertical bus) dij N Equation 2: Calculation of the Dependency Cost (taken from (MacCormack, Rusnak et al. 2006))
Where dij is a binary variable indicating dependency between i and j (so in our case it is
SM (i, j ) SM ( j, i ) ) , n is the size of the cluster when i and j located within the cluster
and N is the size of the SM matrix (when i and j are not located in the same cluster). is a user defined parameter and is found by trial and error (depending on the variation of the results) to be optimum at 2. Adding an element to a cluster increases the cost of other dependencies in the cluster (as the size of the cluster increases), hence an element is only added to a cluster when the reduction in the sum of DependencyCosts with the element exceeds the added costs borne by other dependencies(MacCormack, Rusnak et al. 2006). Now the summation of the DependencyCosts of all the elements of SM gives us the ClusteredCost of the matrix for the particular iteration. Hence the ClusteredCost can be expressed as: 57
2
n
CC (i ) (SM (i, j ) SM ( j, i )) size(i, j ) j 1
Equation 3: Calculation of Clustered Cost (adapted from (Fernandez 1998) and (MacCormack, Rusnak et al. 2006))
In Equation 2 CC(i) represents the Clustered Cost for the element SM (i, j ) In order to cluster the SM DSM we searched for available DSM based tools that could be used as well as integrated into TESNA. On not finding such a tool we went ahead and developed a tool that we call DSM Clusterer (Hegeman 2007). The DSM Clusterer tool takes the SM DSM as input and outputs the Cluster Dependency Matrix according to Algorithm 1 and is shown Figure 15.
Figure 15: A clustered DSM in the DSMCluster tool
The black squares in Figure 15 represent a 1 (or the presence of a dependency) and nonblack square represents a 0 (or the absence of a dependency). The 9 clusters of the Cluster Dependency Matrix can be displayed as a graph where the size of the node represents the number of modules in it as shown in Figure 16.
58
Figure 16: Clustered Call Graph of jEdit
4.4.3 Socio-Technical Structure Analysis TESNA also uses a matrix similar to Task Assignment Matrix (Cataldo, Wagstrom et al. 2006) we call this matrix Software Module Affiliation DSM (SMA). SMA represents the particular software modules the developers are working on. The developers are represented by the rows of the matrix while the columns represent the software modules the developers are working on. TESNA can mine version control systems like CVS and SVN and find out the SocioTechnical Dependencies (the people working on the different parts of the software). For mining CVS (Concurrent Versioning System) repository, TESNA uses the libraries of the open source project jCVS. In order to mine SVN (SubVersion), TESNA uses the libraries of another open source project called JavaSVN(JavaSVN Retrieved 1st August 2008). In order to display which developer has modified which source code file (class file in this case), TESNA reads the log files from the software repository and produces a SMA. From the SMA a Socio-Technical Call Graph (a bipartite or two mode graph) is constructed and displayed as in Figure 17.
59
Figure 17: The developer code Socio-Technical Call Graph of JEdit
The red nodes in Figure 17 represent the software class objects that the developers, represented by the blue nodes, have last modified. The names of the developers are displayed by the labels next the nodes. This graphic representation uses the normal bipartite graph functionality of JUNG. So, the links between the class objects are not displayed. Such a complex graph can provide us with limited information, for example, which developer modified how many files. Using the tool tips of the red class objects one can find out the names of the class objects and in-turn find out which developer modified which class object.
Figure 18: Socio-Technical Clustered Call Graph of jEdit
60
As described in the Technical Structure Analysis section the call graph of the software can be clustered with the help of TESNA. Now, in order to find out which developers have modified which clusters TESNA combines the DSMs of Figures 16 and 17 to produce a People Cluster Matrix that is represented as a Socio-Technical Clustered Call Graph of the software as shown in Figure 18. The Core Periphery Distance Metric As described in Chapter 3 (Table 6), the Code Ownership STSC is based on the Code Ownership pattern (Coplien 1994). This, in turn, is related to the problem that a developer faces with a changing base of code. The same STSC applies to a situation, where a developer, who was not involved in the development of a particular code, is all of a sudden given the responsibility for a particular release of the code. When such a situation occurs, there is a lot of coordination that needs to be done. As, the new developer, needs to be instructed on the history of the changes that have been made until then. This situation can create a large coordination requirement, depending on the number of developers who have made changes to the module. The coordination requirement also depends on the kinds of changes made until then. The Code Ownership STSC is especially a problem when the developers don’t follow an XP methodology with collective ownership guidelines like continuous integration, 100 percent unit testing and strong coding style guidelines (Nordberg 2003). In order to identify this STSC we mined the CVS server of eMaxx. After mining the log history and source files, we calculated the call graph of the software package from the source file and then clustered it using the dependency based clustering algorithm (Algorithm 1). Clustering the call graph makes the identification of Code Ownership STSC easier, as otherwise the call graph can be very large and as a result the bipartite graph of the developers modifying the source code files can get very complex (Fernandez 1998; MacCormack, Rusnak et al. 2006). We use this DSM clustering algorithm over other clustering algorithms as it clusters based on the number of dependencies between source code files. So, when a developer modifies a file in a particular cluster, depending on the kind of modification, all the dependent files that need to be altered as a result of the modification (Cataldo, Wagstrom et al. 2006) would lie in the same cluster. The clustering together with the calculation of the Core Periphery Distance Metric (CPDM) simplifies the identification of the Code Ownership STSC as we shall show in the case study that follows.
61
Algorithm 2: The Core Periphery Distance Metric (CPDM) algorithm
In the above algorithm, in order to identify the core and the periphery of the Cluster Dependency Matrix we realize that the core-ness of a particular cluster depends not only on the size of the cluster but also the dependencies of the particular cluster with other clusters. We hence multiply the Cluster Dependency Matrix with the Cluster Size Matrix (the matrix with the sizes of the corresponding clusters). The resulting matrix gives us an indication of the core and the periphery clusters with the larger entries being more core than the smaller entries. So if we arrange the columns of this matrix in the descending order we would have the clusters in the descending order of core-ness. Also in Algorithm 2, the Distance from the Core Cluster is given by Equation 5. k
DCC
(d j 1
ij
j)
k
Equation 4: Calculation of the Distance from the Core Cluster
In the above Equation 5 dij represents the (i,j) element of the People Cluster Matrix, while k are the number of columns (9 in our case). So the closer the CPDM is to k the more number of clusters in the core the developer has modified. Once the manager finds a Code Ownership STSC at the level of the clusters the manager can then zoom into the clusters to see the Code Ownership at the level of the source code files and decide if the problem is indeed severe enough to justify action.
62
4.4.4 Social Structure Analysis In order to see how the developers working on the different source code files are dependent on each other we consider two types of graphs namely: (i) the source code developer-developer dependency graph and (ii) the complete developer-developer dependency graph (that includes documentation and other non source code files). In the case of the source code developer-developer dependency graph, we calculate the Software Developer DSM (SD) using the same method as (Cataldo, Wagstrom et al. 2006) and (Sosa 2008). SD SMA SM SMAT Equation 5: Calculating the Software Developer DSM (SD) (from (Cataldo, Wagstrom et al. 2006) and (Sosa 2008))
Where SMA is the Software Module Affiliation DSM that describes the developers working on the different software modules and SM is the Software Module DSM (as explained earlier) that describes the dependencies between the software modules. From SD we can create the graph of the developer dependencies as shown in Figure 19. Figure 19 shows the source code developer dependencies of the jEdit project, while Figure 20 shows the complete developer-developer dependency graph for jEdit. The reason why we need two visualisations of the developer-developer dependency is that one can find out the different kinds of dependencies between developers and act accordingly. An analysis of the call graph dependencies while providing a code level understanding of the developer-developer dependencies does not cover all the dependencies related to the artefacts. A more thorough analysis of dependencies needs to cover dependencies due to working on the same file (source code or documentation) as well as dependencies due to separation of concerns (Gall, Hajek et al. 1998). The blue nodes represent the developers working on the different modules of jEdit and the directed links represent the dependency, for example karianna is dependent on pjdb and vice versa. The use of this developer dependency network is that such a graph can be compared with the Social Network of the same developers in order to find the dependencies between developers that are not met with communication and vice-versa, as done by (Cataldo, Wagstrom et al. 2006) and (Sosa 2008).
63
Figure 19: The developer dependency graph of jEdit
Figure 20: The complete developer-developer dependency network of jEdit
To analyse the Social Structures, TESNA can construct and analyse metrics from logs of chat messages (from a chat server like Jabber). Using the data from logs we construct a Social Network DSM (SN) that also represents the number of messages between the actors. In order to display the social network (from SN) got through mining these repositories, TESNA uses libraries from the Java Universal Network/Graph Framework (JUNG), an open source library widely used by Network researchers. The display of the social net64
work from the Mendix case is shown in Figure 21. Here, each of the nodes represents a member of the social network (whose name is indicated by the label next to the node) and the thickness of the line as well as the number on the line between the nodes represents the number of messages exchanged between the people represented by the nodes. The more the number of messages, the thicker the line gets. TESNA can also mine bug tracking websites (like Mantis) to gather data on the social thread of responses for each bug posted. We have used this feature in the eMaxx case discussed in the sixth Chapter.
Figure 21: Social Network from the Mendix case
While the people dependencies graph (Figure 19) based on whether people are working on the same or dependent modules provides the Coordination Requirement (Wagstrom and Herbsleb 2006) we can compare this with the actual social network of the developers in order to identify Conway’s Law STSC (Cataldo, Wagstrom et al. 2006; Sosa 2008). TESNA also displays the different metrics of the social network (Chapter 5, 6) over a period of time. We have used this option to identify the Betweenness centrality match pattern (in the Mendix case study) by calculating the betweenness centrality of the social networks (Freeman 1977) over the period under study. 4.4.5 Metrics TESNA calculates different metrics like ClusteredCost and PropagationCost (MacCormack, Rusnak et al. 2006) for the Technical Network Module. ClusteredCost is the final value obtained from Equation 2 when using the algorithm presented in Algo65
rithm 1. PropagationCost is a measure of the transitive dependencies present in the DSM. Warshall’s Theorem states that the successive powers of a matrix yield the transitive dependencies of the matrix (Warshall 1962). Hence the PropagationCost is obtained by taking the successive powers of the Software Module DSM (SM) until a null matrix is obtained and then adding all the intermediate matrices generated (the matrix with power zero, one, two,… etc.). Now, the summation of all the rows or the columns provides the fan-in or the fan-out dependency metric (MacCormack, Rusnak et al. 2006). In the case of the Socio-Technical module, TESNA calculates the core-periphery metric (Algorithm 2, Chapter 3) and in the case of the Social Network module, TESNA calculates the betweenness centrality (Chapter 5, 6) of the social networks. In the following Chapters we provide further explanation and demonstrate the empirical usage of the metrics. 4.4.6 Other TOOLS There are a few tools available to display the social network as well as the social call graph. Augur is a visualization tool that supports distributed software development process by creating visual representations of both the software artefacts and the software development activities (Froehlich and Dourish 2004). Ducheneaut (Ducheneaut 2005) extends the functionality of the Conversations Map system (Sack 2000) (a software that can visualise semantic information in social networks) to incorporate information on the software modules. Their software called OSS Project Browser is built on the following requirements, “(i) The software must make the hybrid nature of a project visible by showing the connections not only between people, but also between people and material artefacts (ii) The software must offer a dynamic perspective on activities and allow observations over time” ((Ducheneaut 2005), p 331). The OSS Project Browser is also based on the requirement of facilitating ethnographic data on the project (so the user has the possibility of accessing the raw data) as well as the requirement of being able to track the progress of an OSS developer over the course of time (Ducheneaut 2005). Though the OSS Browser is not meant for identification of STSCs per say, it can be used for a qualitative understanding of STSCs. Though there are no tools to identify all the different kinds of STSCs, there are tools and methods to identify Conway’s Law STSC. Cataldo et al. (Cataldo, Wagstrom et al. 2006) and Sosa (Sosa 2008) provide a quantitative method using DSMs based on the PCANS (short for Precedence Commitment Assignment Network Skill) model of (Krackhardt and Carley 1998) to identify Conway’s Law STSC.
66
de Souza et al. (de Souza, Redmiles et al. 2004) on the other hand, use more qualitative techniques as used in TESNA. In their tool called Ariadne (now called Theseus) they check dependency relationships between software call graphs and developers. . In the next Chapter (Chapter 5) we analyse the first commercial case study conducted for evaluating the TESNA method and tool.
67
5. Mendix Case Study 5.1 Introduction The first case study to test the TESNA method and tool was conducted in a software company called Mendix, who develop a large middleware product. One version of the middleware product was already released at the time of the study. The reason behind choosing this case was that Mendix followed an agile approach (iterative incremental software development by incorporating frequent feedback) and it was interesting to see whether even a small company like Mendix has STSCs and if we could identify them. The system architecture of Mendix (at the time of this study) consisted of a client system, a work flow server and a modelling server (Figure 22). The project staff included 15 full-time personnel; 8 full-time developers, 2 project leaders, 2 project managers, 2 sales people and one system administrator. The personnel were divided into 3 teams, with 3 developers, one project leader and one project manager for the client system, 3 developers for the Modelling Server and 3 developers and one project manager for the workflow server. Figure 22 gives a sense of the dependencies as a result of task allocations related to the software architecture of the system. The XML interchange indicates that there exists an input and output dependency between the Server, the XML server and the Client System. Most of the literature on Socio-Technical dependencies (de Souza, Redmiles et al. 2004; Wagstrom and Herbsleb 2006) focuses on gathering the dependencies from the recently modified source code (from CVS). The research approach was adopted by analysing the source code of the company Mendix with the help of our tool. As the company, Mendix is small most of the dependencies in each section of the architecture (client, xml server, and modeller server) were satisfied by the communication among the developers working on them. Also, knowledge of the technology used in the particular platform (Java, JavaScript or Delphi) was an essential prerequisite for a developer to be working in that part of the project. Due to this fundamental skill requirement, developers seldom worked on projects or changed code other than their own assigned part of the architecture. As each developer worked on only specific parts of the code and architecture, there were workflow dependencies between the colleagues due to the architecture. The dependencies due to the XML input and output between the client/server and the servers couldn’t be identified by only analysing the call graph and function call dependencies. Thus, analysing source code of the software product isn’t very helpful in analysing the dependencies for a small company like Mendix. So, we used the technical architecture as a basis 68
to understand the coordination dependencies between the software developers as previously done by Ovaska et al. (Ovaska, Rossi et al. 2003). The data was collected in fall 2006 over a period of 3 months, through participant observation, interviews and gathering work related documents from development tools and communication servers. Among the documents observed were the chat logs, which were stored in XML format. Four weeks of logs of chat transcripts, each week evenly distributed in the 3 month period, were analysed with the help our software tool, TESNA. All the main developers, project leaders and project managers were interviewed. Among the questions asked in the interview were; who they discuss work related subjects with (advice, discussion and work flow), how much data was exchanged per communication, and, what the mode of communication was. It was ascertained that almost all technical communication was done through online chat. This was because Mendix uses a dedicated Jabber chat server running for the company (which eliminated wastage of time due to external chats), and developers consider the use of chat more efficient than face to face communication. The primary ties in the social networks analysed from the chat log corresponded with those that the interviewees had themselves provided. Further, through participant observation of the software developers (in 6 separate visits lasting a day each) it was ascertained that indeed almost all technical communication was through the online chat. The data was analysed and then discussed with the CTO of the company, who doubled as a project manager (roakr in Figure 22.). With the help of our software tool TESNA, the social networks for four different weeks (each with cumulative chat data over the period of a week) of only the developers and project leads/managers were constructed. The chat records were parsed and displayed as social networks by TESNA with the chat ids, as labels for our nodes in the social network. This was also done in compliance with the company policy of protecting the identity of the employees. We calculated the degree and betweenness centrality (Freeman 1977) of the nodes and plotted a graph showing its variation over the 3 month period. The resultant diagram was shown to the CTO for his input that was then used for the identification of STSCs according to the Betweenness Centrality Match pattern (Table 6, Chapter 3). TESNA can construct and analyse software metrics from XML logs of chat messages (the chat server being Jabber). Moreover, TESNA displays the different metrics of the social network over a period of time. This option was used to analyse the betweenness centrality of the social networks over the period under study. The data was taken back to the CTO once it was displayed and analysed. In this way we could ascertain whether our technique was really useful to the CTO. 69
The cumulative chat logs were analysed over a period of a week and converted into a social network of the developers and project leaders with the help of our tool (we use JUNG (Madadhain, Fisher et al. 2005) to display and calculate metrics). The social network was represented with labels, and the strength of each link was determined by the number of chat messages exchanged. The black links were drawn for the maximum number of chat messages exchanged, and dotted links if the number of chat messages was less than half of the maximum that week. The system architecture (which didn’t change in the period of observation) was then superimposed on the social networks in order to assist the identification of STSCs, according the Conway’s Law pattern (Table 6, Chapter 3).
Figure 22: The Software Architecture along with the task responsibilities
5.2 Conway’s Law and CTO feedback The CTO considered Conway’s law pattern (Chapter 3, Section 3.8), very important, in his words “..it is very important that the organization of the company is according to the architecture and I want all the developers to communicate to resolve their problems”. So, the CTO was quite pleased when we showed our tool which maps the social networks to the software architecture of his company’s product. When asked how he would 70
expect the social network of the developers and project leads in his company to look, the CTO said “I would expect vla, jonve and micka to be central, as they are the Gurus in the work they do and no one knows the functioning of the server, xml server and the client better than them”
Figure 23: The social network mapped onto the Software Architecture for week I
The social network from week I (Figure 23) was interesting as the CTO immediately spotted a STSC, which was the missing link between Jonve and Judva, both of whom are developers for the XML server (Figure 22). The CTO found the social network from week II (Figure 24) more reasonable than week I, even though there was no connection to johde (who was away doing a project). The three central players were jasva, micka and jonve which was what he had expected according to the tasks and results in that week. He found that there was little communication with derkr (who is the project manager for the client part of the architecture Figure 22), which he found odd as there was some trouble with the client that week. 71
Figure 24: The social Network mapped onto the Software Architecture for week II
Week III (Figure 25) was interesting as many of the employees were on vacation, and the CTO was interested in how the employees communicated. There was no communication between jasva and micka, as jasva was supposed to work on the Client that week. This could be an indication of a potential problem (or STSC). Also, the CTO found the fact that mne was central quite surprising.
72
Figure 25: The social Network mapped onto the Software Architecture for week III
In week IV (Figure 26) the fact that micka was not communicating was surprising as the deadlines were near and it would have been important that he spoke with his fellow client developers. The reason behind pan and matku (having high out-degree) being central was that there was a product shipment on week IV which caused the project leaders to play a more central role. The strong link between jonve and matku was quite odd according to the CTO as they wouldn’t have the need to communicate on technical problems. The fact that bruva had a central role seemed quite odd to the CTO, while the CTO was quite surprised that derkr wasn’t communicating much in the week with the shipment deadline.
73
Figure 26: The social Network mapped onto the Software Architecture for week IV
5.3 Betweenness Centrality Match Centrality index gives us an idea of the potential importance, influence and prominence of an actor in a network. Betweenness (as described in Chapter 3, Section 3.10) refers to the frequency with which a node falls between pairs of other nodes in the network. In other words, betweenness centrality is a measure of, “the degree that each stands between others, passes messages and thereby gains a sense of importance in contributing to a solution, .. , the greater the betweenness, the greater his or her sense of participation and potency” (Freeman 1977). In terms of coordination, betweenness maybe the most appropriate measure of centrality as it provides a measure of the influential control of each node (employee) on the whole networks. This is the reason why betweenness centrality was used to analyse potential STSCs.
74
Figure 27: The change in the betweenness centrality over the four weeks
The change in the betweenness centrality index (Chapter 3, Section 3.10) over the 3 month period can give us an idea of how the most important employee (or the employee who handles most of the communication) in the network changes depending on the tasks at hand. On observing Figure 27, one can see that the employees who are important to each part of the software architecture (or the gurus as the CTO called them) namely, jonve, micka and vla were very central during the period around the first week. This period was exclusively meant for software development where their expertise was very much in demand (as the CTO named them as the experts in their domain) by fellow developers and project leaders. However, as the project moves towards delivery of the product we find the core developers taking a more passive role in the network while the non-core developers like jasva, bruva and mne as well as the system integration experts take a more central role. This can be explained by the fact that a greater amount of integration and front end work is required near the delivery deadline. We also notice that the project leaders and managers (pan and derkr) assume a more central role when the project is nearer to the deadline for delivery to the customer (week IV). This movement to a more central role is required by the project leaders and managers in order to be able to control all the possible contingencies that might crop up near the delivery time. This display of the variation of betweenness centrality index of the social network can also help a manager in recognizing STSCs relevant to different stages in an agile software process. When a person is too central for the wrong reasons, i.e. when a developer is taking responsibility to communicate with the rest of the team, then 75
such a scenario would be a structure clash. For example, the CTO was surprised that mne had a central role in the week III when not much work was required at the client side; he was also surprised that bruva was central in week IV. There is also cause for concern (potential STSC) when two employees working on (or managing) the same part of the architecture (that is being modified) are not communicating with each other, for example micka and derkr were not communicating in any of the weeks under observation. This Chapter dealt with a preliminary investigation of the method of identifying STSCs in a corporate environment. In the next Chapter (Chapter 6) a more detailed analysis of different STSCs is carried out in a different but comparable corporate environment.
76
6. eMaxx Case Study 6.1 Case Study Details We conducted our case study in a software development company called eMaxx. eMaxx is one of the leading providers of Web Portals and Mid Office solutions for city halls in The Netherlands. They have between 30 to 40 percent of the market share among all the companies who supply mid office solutions to Municipalities. The solutions offered by eMaxx are personalized for each municipality so their software development is manpower intensive. eMaxx has around 20 developers distributed among three teams and follows a variant of the waterfall development methodology. In the recent past they have merged with another company called XL21, who also work on Mid Office solutions for city halls.
Figure 28: The Mid Office application Architecture and the task responsibilities
77
eMaxx develops software in the java platform while XL21 develops in the .NET platform and employs a variant of the waterfall model for their software development. Over period of 6 months we mined the Software Repository (CVS) as well as the Bug Tracker repository (Mantis (Tracker Retrieved 1st August 2008)) used by the developers at eMaxx. We also interviewed the support staff, developers as well as the project leaders of each primary software development team, where each team is represented by a different part of the architecture in Figure 28. For example, the developers working on the Front Office part of the architecture was considered to be a part of the Front Office team and so on. In total we took nine interviews covering all the teams in eMaxx. Each interview lasted between 1 to 2 hours. Among the many questions asked were questions related to what was the communication network (as well as frequency) of the employee was, what the modes of communication were and whether the employee had observed STSCs in the functioning of the projects he or she was involved in. For the interview process and the subsequent analysis of data gathered we used the coding technique described my Miles and Huberman (1984). The architecture of the main Mid Office application, the various teams as well as the task responsibilities of the developers are described in Figure 28. As seen in Figure 28, the architecture of the primary product Mid Office that eMaxx develops consists primarily of the Front office, Application Server and the BPEL Engine. The business logic in the Mid Office application is modelled using BPEL (Business Process Engineering Language). The business logic is embedded in the Application Server as well as the Front Office, which make them both dependent on the BPEL specification. The Front Office and the Application Server part communicate through XML (SOAP) messages. All the corresponding task responsibilities that changed during the period of the study were duly noted.
6.2 STSCs in eMaxx and Feedback We identified three primary STSCs based on the three Socio/Technical Patterns. Just as in the Mendix case study (Amrit and van Hillegersberg 2008), we noticed the occurrence of STSCs based on Conway’s Law Pattern, and the Betweenness Centrality match pattern. Additionally, we also noticed the occurrence of an STSC based on CodeOwnership pattern. The three patterns are explained in more detail (in the pattern format) in Table 6 (Chapter 3). The patterns are based on the Social (betweenness centrality) as well as Socio-Technical STSCs (Conway’s Law and Code ownership). While the Betweenness Centrality Match STSC at eMaxx was based on analysing only the social network of the employees and calculating the betweenness centrality over time, the Conway’s Law STSC at eMaxx was based on analysing the social network of the em78
ployees as well as their dependencies at the architectural level (similar to what was done in the Mendix Case) and the Code Ownership STSC was based on analysing the Technical dependencies at the level of the application code over time and determining who is responsible for the particular version of the application. We mined the Mantis bug tracker in order to determine the project specific communication links. We compared and verified these links to the ones we got through the individual interviews. The data from the Bug tracker after verification with the interview data was used to identify the Betweenness Centrality STSC. In order to identify the Conway’s law STSC, we also used the communication link data from the bug tracker along with the interview data and compared it with the dependencies between teams at the level of the architecture. On the other hand the Code Ownership STSC was identified by mining the software repository (CVS) used in eMaxx and by determining the ownership of the modifications done on the software over time. After the data was analysed we took the data back to the CTO David for his feedback and we used some of the feedback to locate and validate the STSCs. We also asked the project leader from the Support Team, Oliver for his feedback on the data. We followed up on the data we got from observing the Betweenness Centrality STSC. By interviewing the different people involved in the particular STSC we tried to get arrive at a better understanding of the reason behind the STSC. We presented the data to the developers of eMaxx to get more feedback on the data and the STSCs found. We used the opportunity to also get feedback on our software tool TESNA. All the names used in this case study are pseudonyms at the request of the CTO of eMaxx. All theSTSCs and their identification are explained in the following subsections, but first we will explain how the Mantis bug tracker and the CVS software repository were mined with TESNA.
6.3 Mining Repositories eMaxx uses the Mantis bug tracker (Tracker Retrieved 1st August 2008) to keep track of the progress on software bugs specific to different projects. The reason for choosing the bug tracker was that the CTO of the company informed us, that the bug tracker discussion was an accurate representation of not only the bug finding and fixing activities but also the coordination activities required surrounding it. We were able to mine 2250 pages from the Bug tracker corresponding to 23 different customer oriented projects. The bug tracker pages spanned a period of four years, starting from 2004 and ending in the beginning of 2008. Each web page of the bug tracker dealt with a specific bug concerning a software component of a project. From each page we were able to extract the sequence in which the developers tackled the particular 79
software bug in question. Data on the names of the developers, the dates at which they posted the message as well as the name of the project in concern was mined with the help of TESNA. The social network of the people who posted messages on the bug tracker was built as follows: if developer A posted a message and developer B replied to it, then a link was established from A to B, similar to the method used by Howison et al. (2006). In this way we arrived at one social network from each bug tracker page. As the number of such networks was 2250, which was too many to analyse, we had to group the networks together. We grouped 25 networks belonging to a particular project at one time, to end up with 90 social network diagrams. We then calculated the betweenness centrality of the networks and plotted the change of the betweenness centrality of each individual involved in a project over time. We also analysed the ratio of the messages between any two teams to the total number of messages in order to determine the projected related communication among the different teams. eMaxx uses CVS (Concurrent Versions System) to keep track of eMaxx’s Mid Office application code. We used TESNA to mine the CVS in order to retrieve data on the name of the software class file which had been modified, the name of the developer who modified the file as well as the date at which the file was modified. We also obtained the different versions of the compiled source code (jar files) of each of the core Mid Office modules that was also checked into the CVS. We used TESNA to analyse and display the call graphs of each of the application modules (jar files). We could then conduct a temporal analysis of the call graphs, to determine changes in the responsibilities for different versions of the application modules. In total we analysed 29 application modules of the core, belonging to Application Server part of the Mid Office architecture (Figure 28). Of these 29 application modules we found 14 very interesting in terms of their call graph dependencies and importance in the functioning of the Application Server. We analysed the core-periphery nature (Chapter 3, Section 3.12) of these 14 application modules (as we shall describe later). We determined which developer modified (and as a result was responsible for) which part of the application module and when.
6.4 Betweenness Centrality STSC As we explained in the previous section, the social network diagrams were grouped based on the projects the bugs addressed. We could then calculate the betweenness centrality (Chapter 3, Section 3.10) of the people involved in the bug tracker of each project over time. As explained previously, betweenness refers to the frequency with which a node falls between pairs of other nodes in the network. Scott, J (2000) defines betweenness as the extent to which an actor can play the role of a broker or a gate80
keeper with a potential to control others. In the case of the usage of the bug tracker at eMaxx, we analysed the messages posted and observed that most of the coordination work was the allocation of bugs and in routing the replies to the attention of other developers. This had to be done, as the developers at eMaxx did not respond to a bug report unless and until the message was addressed to them. Hence, in this case the coordinating role did correspond to the person with the higher betweenness centrality. This is unlike the case reported by Howison et al. (2006). According to whom, as bug tracker in an Open Source project is readable by everyone, one cannot use betweenness centrality as means of ‘information brokerage’(Howison, Inoue et al. 2006). We could then see who has a higher betweenness centrality at which period of the project. Depending on whether this is different from what was planned in the project planning stage or expected with the job description, we would have an STSC (Table 3). The 90 social network diagrams (as explained in the previous section) were distributed among 23 different projects. Among these different projects we found four projects interesting as they involved more developers than others and were spread across a comparatively larger timeline. The interesting projects were DPT, TRM, LR and LPOC (all pseudonyms). As described earlier, each network was culled from 25 pages of the Bug Tracker, and each page had postings from eMaxx employees. The employees included XL21 employees as well as employees from the customer side (the city halls involved in the project). DPT had 28 people working in the project with 9 employees from eMaxx, including 2 employees from Support (Oliver and Paul), 1 employee from Front Off (Joshua), 2 employees from Application Server and 4 employees from BPEL team ; 9 employees from the company XL21 (including their service desk, Nuru and Nico) and 10 employees from the Customer side.
81
Figure 29: The variation of the Betweenness Centrality of the people working on DPT Project
When we asked the CTO of eMaxx about who should be coordinating the DPT project, he mentioned the names of three Project Leaders, two of whom were from eMaxx and one from XL21. While the project leader of the Support Team; Oliver mentioned the names of himself and Nuru. As none of the Project Leaders participated in the discussions in Bug Tracker for this project one would expect the support staff (as this was their role, in the planning stage) to take over the coordination of the project. The support staff members that did participate in the DPT project (as seen in Figure 29) were Oliver and Paul (for eMaxx). When we observe the change in betweenness centrality of the employees who participated in the project, we see Oliver taking the main coordinating role from the beginning of the project (week 0) to around week 12. Then from week 13 we see Nuru from the Front Office team of XL21 taking over the main coordinating role till around week 26. From week 26 till week 28 we see another member of XL21, Nico taking over the main coordinating role. As no one from eMaxx support is involved in the coordination of the DPT project from week 26 to 28, this can be considered as a possible Betweenness Centrality STSC. Also, what is interesting is that the project leaders from the customer side of the DPT project namely, Madison and Riley did not play a very important role in coordinating the Bug Tracker discussion.
82
Figure 30: The variation of Betweeness Centrality for the LPOC project.
LPOC and LR were two phases of the same project. While LPOC was the initial design phase, LR was the implementation phase. In Figure 30 we see the variation of the Betweenness Centrality of the LPOC project. In this project there were 24 employees involved of whom 6 were from eMaxx and the rest were from the customer side. Again we asked the CTO, who had the central role of coordinating this project. The CTO mentioned a project leader from eMaxx. As there were no project leaders from eMaxx participating in the Bug Tracker discussion, we would expect the eMaxx support staff to take over the role of coordinating the discussion in the Bug Tracker. When we analyse the betweenness centrality of the LPOC project we see Robert, who is the project manager for the customer, taking over the central coordinating role in the Bug Tracker discussion of the project from its inception to around week 8. Around week 8 we see Joshua, who is in the Front Office team taking over. Again, as there are no employees from eMaxx support team involved in the Bug Tracker message coordination for most of the project, we can conclude that there is a Betweenness Centrality STSC for this project.
83
Figure 31: The variation of Betweenness centrality for the LR project
In Figure 31 we see the variation of Betweenness centrality in the LR project. The LR project had 34 employees participating in the Bug Tracker discussions 15 of whom were from eMaxx. Among employees who participated in the Bug Tracker from eMaxx were 2 Project Leaders (Gavin and Luis), 2 support staff (Oliver and Paul), 4 employees from the Front Office team (Joshua, Karsten, Ryan and sander), 4 employees from the Application Server team (David, Ethan, Thomas and Ian) and 3 employees from the BPEL team (Faron, Brian and Nathan). When we asked the CTO of eMaxx about who had the main coordinating role in the LR project, the CTO mentioned 2 project leaders (Gavin and Luis) as well as one Front Office member namely Joshua. While Oliver said that Joshua, Luis and himself (Oliver) had the main coordinating role for the project in the Bug Tracker. On analysing the change in betweenness centrality of the LR project, we notice that Tristan, (belonging to the customer side (of the LR project)) has the central coordinating role in the discussions in the Bug Tracker from the inception of the project (week 0) to around week 6. Around week 6 Joshua takes over the coordinating role (as expected) till around week 14. Then from week 14 the central coordinating role in the Bug Tracker discussion is again taken up by Tristan. As Tristan was not supposed to take the central coordinating role, we see a clear case of a Betweenness Centrality STSC.
84
Figure 32 shows the change in the betweenness centrality of the TRM project. The TRM project involved 9 employees; 4 from the client side (Peter, user30, user 33 and user14), 2 from the application server team (David and Ethan), 2 from eMaxx support team (Victor and Oliver) and Max, the Project Leader from eMaxx. On calculating the betweenness centrality for the project we see that Max has very high betweenness centrality throughout the project. When the CTO was asked who had the main coordinating role in the TRM project, the CTO mentioned the names of himself and that of the CEO. This clearly shows a discrepancy from the expected coordination role to the actual coordination.
Figure 32: The variation of Betweenness centrality for the TRM project
6.5 Conway’s Law STSC Conway in 1968 stated that there is an inherent homomorphism between the communication structure and the structure of the system design (Conway 1968). When this alignment between the system structure and the communication structure are not met then we have what we call the Conway’s Law STSC (Table 6). The Conway’s Law STSC we identified at eMaxx involves technical dependencies at the level of the system architecture (Figure 28) that are not met with corresponding communication between the people involved with the technical artefacts. As in the Mendix case study (Chapter 5), we analysed the technical dependencies at the level of the software application modules as well as at the level of the system architecture. Just as in the case of Mendix, we found that the dependencies at the level of the software application modules were fulfilled with face to face communication (team members located in the same room) or communication via chat and e-mail (in the case 85
of team members located in different rooms). Also, the project planning stage of eMaxx ensured that developers or testers who worked on the same software application module were located nearby or had access to a quick and reliable communication route. Hence, we concentrated our analysis at the architectural level of technical dependencies and the communication among teams, working on the different parts of the architecture (Figure 28). The technical dependencies at the level of the architecture were found through gathering information on the architecture and through individual interviews. We realised that the main architectural dependency that was critical to the process was the dependency between BPEL, Front Office and that between BPEL and the Application Server. We gathered the social network of the developers, support staff as well as project leaders through the open ended interviews. We asked each developer who they spoke with (other developers, support personnel and project leaders) and how much. We also asked them if they had encountered any coordination problems/inconsistencies in the projects they were working on. One of the main developers: Ryan of the Front Office Team had this to say: “There is a communication problem between teams.., between Front Off and the BPEL team, they (BPEL team) decide things they should not decide.., they should ask us” … “I think the communication within teams internally is more than between teams” … “Sometimes they (BPEL team) decide things that are difficult to do with the framework, but most of the time BPEL (BPEL Team) just decides process specific logic, with process specific logic it’s easier to accept things” Sometimes they decide things that really have to change in the framework that is more difficult” … “When they (BPEL team) communicate with us (Front Office Team) it’s about standard, not process specific things” The framework that the developer mentioned above refers to the core data structure implemented in the Front Office application based on the BPEL process specifications. So every time the BPEL process specific logic dealing with the framework changed, the particular Front Office developers (like the developer Ryan) had to be contacted. The technical dependency between Front Office team and the BPEL team made the lack of a smooth communication link between the Front Office team and the BPEL team a coordination bottleneck. This point was also brought up by another Front Office developer: Kyle who had this to say: 86
“there were problems between BPEL (team) and Front End (team), because BPEL did things differently than before ... So you develop things and you think that now I can communicate with BPEL (to the Application Server), but it doesn’t work, all I have are errors and faults ... Then you walk to the BPEL team and they say “Oh we do it differently now, we have changed it”” .. The whole communication within this company should be much better a lot of problems in this company are related to bad communication!” What Kyle means, by the above statements, is that, when the BPEL team makes changes to the business logic used by the Front Office applications, they do not inform the Front Office development team of the changes. This lack of relevant communication and transfer of important information, in spite of the existence of a dependency between the teams causes problems in the development process. This communication problem was further ascertained from the interview with Project Manager Lin. She had this to say: “..When the clients find an error, we have the Bug Tracker to report the errors, they always go to BPEL first, mostly, they (BPEL team) look at it, but they look at it by themselves, they don’t go to the Mid Office (Application Server team), Front Office (team) to discuss and look at the problem and how they can fix it, they (Mid Office team) do it just by themselves” … “So what I did after a while, when I noticed that is that I went to BPEL (team) and then I went upstairs to the Mid Office (Application Server team) and the Front Office (team) and I put the three together to solve the problem, because they don’t do it by themselves” … “Some people do it by themselves, but most people think “Oh well it’s not my problem! It’s the Mid Office (team’s) problem or the Front Office (team’s) problem”. Many times it’s the interaction between the two where the real problem is.” “In the beginning I thought that the two people know it’s a problem between them, and they will solve it together, but I realised it’s not always the case”
87
When asked her which team, in her opinion, was problematic, she had this to say: “It looks like the problem lies with the BPEL guys, because the problem comes to them and they have to look, as they are the middle ones (in the architecture) to see who can solve it, whether it’s a Front Office (problem) or a Mid Office (problem), they have to look to see who can solve it. So most of the time they say it’s your problem you solve it, but it’s (the company) a team so they all have to solve the problem together.” On realising that most of the dependencies were between teams we also measured the ratio of messages between teams in the Bug Tracker to the total number of messages in the Bug Tracker. On measuring the ratio of messages over time between BPEL and Front Office as well as the Application Server teams, to the total messages in the Bug Tracker during the same period we got a graph that is shown in Figure 33. We divided with the total number of messages in the Bug Tracker in order to normalise the data.
Figure 33: The ratio of the messages between BPEL team FrontOffice, Application Server teams
The mean of the ratio of messages was 0.07 while the standard deviation was 0.18. We would get a better feel of the lack of communication between these teams if we compare these numbers to the similarly normalized number of messages between the Support and the three teams (Front Office, Application Server and BPEL). We arrive at the graph shown in Figure 34. The mean of the ratio in this case was 0.11, while the standard deviation was around 0.19. This clearly shows that the communication in the bug tracker was also more between the Support and the three teams (Front Office, Application Server and BPEL), as compared to the communication among the three teams 88
(BPEL and Front Off and Application Server teams). This result confirms what the Project Manager, Lin told us that even though the BPEL team got the bug report from the customer, they did not assign or discuss it with the other teams through the Bug Tracker.
Figure 34: The ratio of messages between Support team FrontOffice, Application Server and BPEL teams
6.6 Code Ownership STSC In this section we use the concept of Code Ownership STSC (described in Chapter 3, Section 3.9) and the Core Periphery Distance Metric (CPDM, described in Chapter 4, section 4.4.3.1). In Figure 37 we notice the software clusters of MZM, an application module in the Application Server along with the developers who modified the different clusters. Here the size of the cluster indicates the number of dependent source files in the cluster. We consider a cluster to be more Core the larger and the more connections it has. We then calculated the CPDM of the developers from this clustering process and displayed it as a graph. From this graph we can elicit the Code Ownership STSC. The CPDM ranges from 0 which represents the most periphery part of the application code module to 9 which represents the most core part of the application module. A higher CPDM implies that the developer modified the core part of the software. While a low CPDM indicates that the developer modified the periphery of the software. In Figure 35 we notice the software clusters of MC, an application module in the Application Server along with the developers who modified the different clusters. We then calculated the CorePeriphery metric (from now on called CPDM) from this clustering process and dis89
played it as a graph. From this graph we can identify the Core-Periphery STSC as we have described earlier. The CPDM ranges from 0 which represents the most periphery part of the program to 9 which represents the most core part of the program. A higher CPDM implies that the developer modified the core part of the software. While a low CPDM indicates that the developer modified the periphery of the software.
Figure 35: The notice the software clusters of MC version 1.7.5 along with the developers, Thomas and David who modified the classes in the different clusters.
In Figure 35, we see the 1.7.5 version of the MC application module. In the figure, we see Thomas working on classes in cluster number 6, while David works on classes in cluster number 1 and 3. As cluster 6 is more central (in terms of connectivity to cluster 1 and 3), we find the CPDM of Thomas to be higher than David as seen in Figure 35. Figure 36 represents the variation of CPDM for the MC software application module. The MC module is one of the most important modules of the Application server and has the three main developers of the Application server team working on it namely, David, Ethan and Thomas. In Figure 36, we see David and Ethan work on the core parts of MC in the version 1.7.2. In the next version, we see David working on the core (having a high CPDM of 6) while Ethan is not working on the software. From the next version, we see the trend that one of David or Ethan works on the core while the other works on the lesser core modules (more peripheral modules). This causes a coordination requirement between David and Ethan where the developers need to discuss the changes in the code from the previous version. But as they have worked on the Core of MC earlier, the coordination requirement is not as large as the case in which they had not
90
worked on the core (or had a low CPDM) earlier. When Thomas enters the project in version 1.7.5, we see that he has David (who is also working near the core) to discuss the previous project’s changes with.
Figure 36: The Core-Periphery Shift of the MC application module
Figure 37 describes the variation of the CPDM of the different versions of MZM, which is one of the main application modules of the Application Server. The versions of MZM started with version 1.7.1 and developed to version 1.7.3.2. The versions also represent the timeline of development of the software, i.e. 1.7.1 was developed before 1.7.2 and so on (these also correspond to the versions in the CVS). From the figure we can arrive at the conclusion that there are two developers creating and modifying the application module, namely David and Ethan. In Figure 37 we see that David has a CPDM of 5 while initiating the project and working on version 1.7.1 of MZM, while Ethan has a CPDM of 0. This implies that while David was working on the core part of the software, Ethan was not modifying the software at all. While for version 1.7.2, we see that David’s CPDM hasn’t changed, Ethan’s CPDM is 3.5.
91
Figure 37: The Core-Periphery Shift of the MZM application module from the Application Server
This shows that, in this version Ethan modified a reasonably core part of the software. What we can see from the trend of this graph is that, from version 1.7.1 to version 1.7.3.2 David consistently has the highest CPDM indicating that he is modifying the most core part of the software module. Thus we see that David has Subsystem Code Ownership (Nordberg 2003) of this software application module.
Figure 38: The Core-Periphery Shift of the MLRD application module from the Application Server
In Figure 38 we observe the variation of CPDM for another application module called MLRD. In this application module we have three developers creating and modifying
92
the application, namely David, Thomas and Ian. In this graph we see that Thomas initiated the project and hence was creating/modifying the core of the software and consequently has a very high CPDM of nearly 7. In version 1.7.1 we see David entering the project and modifying core modules with a similar CPDM as Thomas for version 1.7.1. While David has a high CPDM for alternate versions, we see that Thomas is constantly working at the core of the software. This indicates Code Ownership of the application module and we think it reduces coordination problems. Having seen these three positive examples of work practice, let us consider a counter example that is also an example of an occurrence of Code Ownership STSC. We do see an occurrence of Code Ownership STSC in Figure 39. The figure represents the variation of CPDM for the MGM module. In the figure we see Ethan working on the core of the different versions of MGM, implying that he is the main developer of MGM. Except in version 1.7.6.1, even though it’s meant to be a subsidiary version of 1.7.6 (with the naming convention adopted in CVS), through our CPDM we find that David modified quite a core part of the MGM application module. This implies that though David didn’t work on the software until version 1.7.6.1, he had to learn about all the changes that have been done on it and the reason behind those changes. So this situation makes the coordination requirement quite high between David and Ethan, causing an occurrence of a Code Ownership STSC.
Figure 39: The Core-Periphery Shift of the MGM application module from the Application Server
93
Figure 40: The Core-Periphery Shift of the MDDS application module from the Application Server
Figure 40 shows the variation of the CPDM for the different versions of the MDDS project. In this project, we see that David and Ethan were involved in working on the core of the software at the start, as they have a relatively high CPDM until version 1.7.5. Then David stops working on the software module as his CPDM drops to zero in version 1.7.6, while Ethan continues to work at the core of the software till version 1.7.7. In the meanwhile, we see find efloothuis and Ian working on the core of the project (having a CPDM of nearly 6), on versions 1.7.6 and 1.7.7 respectively. This doesn’t cause a very high coordination requirement (and consequently a Code Ownership STSC), as we also find Ethan working on the core of the software (having a CPDM of nearly 5) during the same period. So, it’s easy for Ethan to discuss the details of the code with them. While on the other hand in version 1.7.8, we find only Thomas working on the core of the project with a CPDM of nearly 6. This places a very high Coordination Requirement on Thomas. As, he has to discuss the details of the changes that David, Ethan, Ian and efloothuis have made if he is going to be modifying similar files as is quite likely with the high CPDM. Hence, this large Coordination Requirement makes this a clear candidate of the Code Ownership STSC.
6.7 Discussion We decided to find the reasons for the STSCs observed in the different STSCs. To do so we interviewed some of the people involved in the STSC by not coordinating enough or who took proactive responsibility of the coordination.
94
6.7.1 Conway’s Law We interviewed one of the main developers in BPEL, Faron (a pseudonym). When we asked him who he talks to in his team (BPEL) he had this to say: “I spoke to no one for the last six months!, now and then I talk to the Team Leader (Brian)” .. “Now its better as I am in the same room” When asked who he communicated with in the Application Server and the Front Office teams: “I worked on a lot of projects, a lot of it on my own and with some mid office people like David” .. “I discuss problems and new functionality with David” .. “I do the proof of concepts; just make the functionality, not a common way of doing a project, It’s faster and has less documentation” This shows that Faron only spoke with David in the Application Server team and only when he had a problem or a new functionality to discuss. As the project manager Lin told us, when the clients encountered a bug in the project they directly contacted the BPEL team. We also found that Faron was contacted by the clients on multiple occasions. So though the other teams like the Front Office team were waiting for data regarding BPEL changes or bugs from Faron, he was not aware or didn’t take heed of this, causing a Conway’s Law STSC to occur. 6.7.2 Betweenness Centrality We followed up on three of the projects where we found a Betweenness Centrality STSC at eMaxx, namely, the LPOC, LR and the TRM projects. We interviewed the project leaders and developers involved in the coordination of these projects in order to understand why they undertook the coordination responsibility in these projects. In the case of the LPOC project (Figure 30) we interviewed the Team Leader Robert from the client side. We asked him why he took up the coordination of the LPOC pro95
ject though he was from the client side. He said that the client in this case had a better understanding of the business process involved in the project, so it made sense to coordinate the project. Also, the fact that he knew the technicalities of the project quite well helped him take up the coordinating role. We think that Robert’s role in coordinating most of the bugs in the project is still an STSC, as it’s not a good idea to rely on the client to manage the software development and testing process. In the case of the LR (Figure 31) project, we interviewed Tristan who was the Project Manager from the same customer site as the LPOC project. We asked him why he took the coordinating role and how difficult it was to coordinate the bug reports as well as the project on the whole. The reason Tristan gave was that no one from eMaxx took up the responsibility to coordinate the project themselves. This, combined with the fact that they knew exactly what technical specifications they wanted, made it easier for him to coordinate the project progress and also the interaction in the bug tracker. Though, he had reservations on the way the support staff at eMaxx was structured. He preferred it if there were different people for the roles for project management, support (in the bug tracker) as well as the testing of Bugs. Implying that eMaxx was short staffed and this could be one of the reasons that persuaded the customer side to take up the coordination responsibility. We confirmed the remarks of Tristan by interviewing Max who was one of the Project Leaders at eMaxx. The project leader of the support team, Oliver confirmed these statements, when asked which team is not so fast to respond to bugs in the Bug Tracker, he had this to say: “Our own team is the biggest problem because Paul and Victor (pseudonyms used) have too less time. .. Also projects can have a problem with that, as Paul and Victor have 70 to 80 hrs a week planned. We have to change it back to 40, but of course somewhere we will have a problem with that.. I think a good idea is to split things up before the project is completed and not after delivery.” This confirmed the fact that the support team was indeed overworked and understaffed, leading to customers taking the initiative to handle the coordination. In the case of the TRM project (Figure 32) we asked the project leader Max why he had coordinated most of the project in the bug tracker. Max explained that the project management of the TRM project was assigned to an external company CG. As the person96
nel in the company didn’t understand the technicalities of the project someone from eMaxx had to take up the responsibility to coordinate the technical part of the project. As the main project manager (also the CEO of the company) was very busy at that time, Max took up the responsibility himself. In his words: “ ..they (CG employees) did not have the right understanding of the technical details. They did not have the knowledge to understand the change requests. Then Project Management becomes difficult. It was very difficult for them to understand or change things..” We further discussed, why, in his opinion the customer in the DPT project (Figure 29) did not take up the role of project coordinator. His explanation was similar to the TRM project and in contrast to the LPOC and LR projects. Max explained: “Both Madison and Riley (pseudonyms used) had no background on the technical issues. If they had a coordinating role and couldn’t explain why a certain issue is the way it is, it wouldn’t be good” This explained why certain projects like LPOC and LR had the project managers from the customer side taking up the central coordination role, while in projects like DPT they didn’t take up a central role. 6.7.3 Evaluation using Feedback on TESNA In the presentation given to the eMaxx on the data collected we also distributed questionnaires for feedback on the tool. We later discussed the feedback with all the participants of the talk, in order to get more qualitative data on their feedback. In total eight developers, support personnel and project leaders attended the presentation and also filled the questionnaires. Summary of the Responses The participants unanimously agreed (some even completely agreed) that it was important for the company to have information on the Coordination Requirements as well as the Coordination Problems (or STSCs). The responses to questions about the usefulness of the TESNA visualisations were mostly positive except for two responses one suggesting that information on projects should be added and another suggesting that actor roles should be added to the visualisations. The question as to what additional information 97
could improve the visualisation included three respondents who suggested that data on the project should be included, two respondents suggested that developer roles should be included and four responses suggesting that time (instead of version data) could be included and finally one response suggesting that the possibility of zooming into the data would be useful. The responses for the kind of CSCW application that could solve such coordination problems drew a blank with the exception of one respondent naming mining and using data from CVS using XDDTS. As for the evaluation of TESNA, we gathered many interesting responses, including four responses were very positive indicating that detection of such coordination problems is indeed very useful. A fifth respondent suggested that a comparison with other tools would be helpful and that the data might be difficult to comprehend in its entirety due to the size of data from different sources. As for the drawbacks of TESNA, two people suggested that one must be judicious in interpreting the data generated by TESNA. Finally we received a suggestion that additional functionality could be added to TESNA in order to not only process historical and current data but also be able to support and advice on future projects. On the final query about whether the participants were aware of tools that were similar to TESNA, only one response was received. This referred to Eclipse (an Integrated Development Environment) plugin that could find and display dependencies in software code but does not display data on the developers. In this Case Study we noticed the occurrence of three STSCs related to Conway’s Law, Code Ownership and the Betweenness Centrality Match. In the next Chapter (Chapter 7) we see how the Open Source software development process compares to commercial software development (seen in Chapters 5 and 6). Particularly, we look at whether the Socio/Technical Patterns that are applicable to commercial closed source development are also applicable to Open Source development. Later, we explore what kinds of Socio/Technical patterns are more applicable to the Open Source environment.
98
7. Open Source Case Study 7.1 Introduction Open Source2 software development has become quite popular in recent times. Open Source software development has become quite popular in recent times, with such wellknown success stories as Linux, Send Mail, Apache and Firefox, to name a few. A recent report from Gartner says that Linux is the fastest growing Operating System for the server market and continues to substitute Unix because to its “cost-to-performance ratio, high availability of support resources and lower cost of ownership” (Pettey 2008). Nearly 50% of the web sites run on Apache web server (Survey 2008 )and Send Mail is used for all the e-Mail routing for the Internet. Yet Open Source development projects still face significant challenges. Out of 158669 projects registered in the Sourceforge portal, largest host of Open Source projects(Sourceforge Retrieved 1st August 2008), only 27004 (17 %) of the projects were considered stable (has a stable version of their software) and only 2414 (1,52 %) had reached mature status (data was accessed in July 2008). It has been observed that the success or failure of Open Source software depends largely on the health of the health of such Open Source communities (Crowston and Howison 2003; 2006). Open Source developers are spread all over the world and rarely meet face to face. They coordinate their activities primarily by means of computermediated communications, like e-mail and bulletin boards (Raymond 1999; Mockus, Fielding et al. 2002). Developers, users and user-turned-developers of the software form a community of practice (Ye and Kishida 2003). For an IT professional or Open Source project leader it is crucial to know the status of the Open Source project in order to contribute or recommend the project (Crowston and Howison 2006). Understanding how the coordination of software developers can be carried out in an Open Source environment can help in ensuring that many of the Open Source projects are not abandoned. To achieve this goal, one needs to know if and how the process of development of Open Source projects is different from that of Commercial Software Development projects. Realising how the development process differs, can help us understand which Socio/Technical Patterns are applicable in the Open Source development environment. This would also help us understand which STSCs one can identify in order to improve the Open Source development process. In this Chapter we wanted to explore (i) how the Open Source software development process is different from the closed source commercial software development, (ii) whether the Socio/Technical patterns we found in the 2
In this thesis the term Open Source denotes Free/Libre Open Source Software; Initiative, O. S. (Re-
trieved 1 st August 2008). "Open Source Initiative." from http://opensource.org/.
99
commercial software development companies are applicable in the Open Source environment and (iii) if the same Socio/Technical patterns are not applicable, then which Socio/Technical patterns would be applicable in Open Source environments.
7.2 Comparing Open Source and Commercial Development Processes Though the Cathedral versus Bazaar metaphor (Raymond 1999) has been criticised (Bezroukov 1999), it is still regarded as the first paper to describe the differences in the development processes. In this section, we address the question how the Open Source software development process is different from closed source commercial software development. We intend to see if the Socio/Technical Patterns (in particular the patterns discussed in the earlier Chapters) that apply to Commercial Software Development Processes also apply to Open Source software development processes. In order to achieve this goal, we employ a secondary analysis of published case studies in a way, similar to, the one done by Gallivan (2001). With such analysis, we can see if they mention these patterns explicitly or implicitly and in what way they find them relevant. In order to identify relevant case studies we searched electronic archives (of ACM, IEEE, ISI web of Science and Scopus) for relevant literature with search terms like ‘ “Case Study” AND “Open Source”. From the papers obtained, we shortlisted those that explicitly or implicitly discuss coordination issues in Open Source software. In all we accumulated 154 papers on Open Source software, of which the list of papers that discuss the particular Socio/Technical Patterns are shown in Table 8. To avoid selection bias we did not exclude the papers that only mentioned “code ownership”, “Conway’s law” or “Betweenness Centrality”. To fit the selection criteria the case studies had to describe the development process of particular open source software and also had to contain original data as well as analysis. The case studies in each of the papers reviewed a minimum of three times in order to locate passages which mention the patterns explicitly or implicitly. We used a similar approach as used by Gallivan (2001), of applying content analysis to identify relevant passages. We highlight the terms that refer to Conway’s Law, Code Ownership as well as Betweenness Centrality patterns, similar to Gallivan’s approach. Table 8 shows the different paper authors, the context of the Open Source case study, the methods used as well as the occurrence of particular patterns. A tick mark (√) indicates that the particular pattern solution was followed, while a cross (X) indicates a work around to avoid the occurrence of the STSC related the particular pattern. A question mark (?) indicates that with the analysis and data given, we cannot ascertain either way and finally a dash indicates that the particular STSC was not observed in the case study. We first deal with literature on case studies that only reference Code Ownership STSC. 100
Papers
Context of Study
Research Methods Used
Raymond (1998)
Linux, Fetchmail
Participant (developer/essayist)
Dinh-Trong et al. (2005)
FreeBSD
German, (2003)
GNOME
Case Study: eMail archive, Bug Database and CVS Repository Participant, Analysis of CVS Logs and Mailing List
Jensen, Scacchi (2007)
NetBeans
-same-
Jensen, Scacchi (2007)
Mozilla
Case Study: participant interviews, collection and cross-coding of OSSD artefacts, semi automated web site data mining, and multi-mode modelling Case Study: web based questionnaire and subsequent interviews -same-
Jorgensen, (2001)
FreeBSD
Jensen, Scacchi (2005)
NetBeans
MacCormack et al. (2006)
Linux, Mozilla
Mockus et al. (2002)
Apache
Mockus et al. (2002)
Rigby et al. (2008)
Mozilla
Apache
von Krogh et al. (2003)
Freenet
Bird et al. (2006a)
Apache
Bird et al. (2006b)
PostGres
Case Study: Analysis of source code using Design Structure Matrices (DSMs), Interviews with Developers. Case Study: Participant, feedback on description of development process, eMail, CVS and Bug Repository Case Study: Analysis of CVS Logs and Bug Repository Case Study: Analysis of Commit logs and Mailing Lists Case Study: Telephonic interviews, analysis of eMails, Analysis of CVS repository, Case Study: Analysis of Apache HTTP project eMail archive Case Study: Analysis of Apache HTTP project eMail archive
Code Ownership Pattern
Conway’s Law Pattern
Betweenness Centrality Pattern
?
-
-
X
-
-
?
-
-
√
-
-
√
-
-
X
-
-
-
X
-
X
X
X
-
√
?
-
X
X
-
√
X
-
-
-
√
-
-
√
Table 8: Open Source Case studies in relation to Socio/Technical Pattern
101
Raymond (Raymond 1998) in his article elaborates on the ownership of projects in the Linux and Fetchmail environment. Raymond states: The owner of a software project is the person who has the exclusive right, recognized by the community at large, to distribute modified versions. (Raymond, 1999, p6)
He then goes on to describe the various ways one can get to own a project in Linux namely; starting a project, when the project is handed over and taking proactive responsibility of a project for which the previous owner has lost interest or has disappeared. Though one may subsume ownership at the level of individual code modules, this might not be the case as the individual modules can be modified by multiple persons while the project is owned by a particular person. So code ownership at the level of individual code modules, in this case, is not ascertained. German (2003) states GNOME has been divided into smaller projects that minimize the number of people involved that are involved in each of these subprojects (or modules). The analysis made suggests that fewer than five people are responsible for 70 to 80% of the programming effort of a given module. When a module starts to grow in complexity and the number of core developers grows too, it is either split into two different projects, or submodularized, and then one or two developers take control of each of the given submodules. (German, 2003, p212)
Thus implying that, though code ownership at the level of code modules is not enforced in the GNOME project, it is still practiced to some extent. A more quantitative analysis along the lines of Mockus et al. (2003) is required to conclusively verify. Jorgensen (2001) describes the software development process in FreeBSD in a case study and observes the following: The maintainer owns and is responsible for that code. This means that he is responsible for fixing bugs and answering problem reports . . .[. Changes to directories which have a maintainer shall be sent to the maintainer for review before being committed . . .] (FreeBSD, 2001c). For a given area of the code, there may be an official maintainer, or the ‘de facto maintainer’ may simply be the contributor of the last change: In cases where the ‘maintainer-ship’ of something isn’t clear, you can also look at the CVS logs for the file(s) in question and see if someone has been working recently or predominantly in that area. (FreeBSD, 2001b). (Jorgensen, 2001, p7)
102
This implies that Code Ownership is not enforced in FreeBSD and generally exists only when code maintenance is concerned. He also mentions the coordination mechanism of peer reviews that can be used to prevent the Conway’s Law STSC as will be described later. Jensen and Scacchi (2007) do a comparative analysis of role migration and project career advancement process in three Open Source Software Development projects, namely Apache, Mozilla and NetBeans. They observe the following about the Mozilla project: “In rare cases, such a developer may even be offered the position of module owner if s/he is the primary developer of that module and it has not been blocked for inclusion into the trunk of the source tree” (Jensen and Scacchi, 2007, p3)
Though they also note the following about Mozilla project: “It appears that notions of module ownership and a formal quality assurance process have diminished in recent years.” (Jensen and Scacchi, 2007, p4)
Thus suggesting that there has been “Code Ownership” practiced in Mozilla until recently when such practice has declined. They observe the following about NetBeans Project: Additionally, they may gain module owner status by creating a module or taking over ownership of an abandoned module of which they have been a primary committer. (Jensen and Scacchi, 2007, p6)
Thereby, suggesting Code Ownership in the NetBeans project. Jensen and Scacchi (2005) describe the collaboration processes in the NetBeans project Thus, this separation of concerns in the Netbeans.org design architecture engenders separation of concerns in the process architecture. Of course, this is limited by the extent that each module in the Netbeans.org community is dependent on other modules.
(Jensen and Scacchi, 2005, p3)
Thus suggesting that at the level of modules the separation of concerns makes sure that the processes are also not very dependent implying less need for communication and preventing a Conway’s Law STSC. 103
While on the other hand they also note that: Last, volunteer community members have periodically observed difficulties collaborating with one another. For example, at one point a lack of responsiveness of the (primarily Sun employed) user interface team4, whose influence spans the entire community, could be observed. This coordination breakdown led to the monumental failure of usability efforts for a period when usability was arguably the most-cited reason users chose competing tools over Netbeans.org. Thus, a collaboration failure gave rise to product failure. (Jensen and Scacchi, 2005, p4)
Thus implying that at a higher level of the architecture, there exist dependencies that when not resolved can lead to a Conway’s Law STSC. They also go on to say that this particular STSC described was later resolved. MacCormack et al. (2006) compare the architecture of Linux and Mozilla based on coupling dependency at the file level. One of the main findings of the paper is this: In this respect, our study generates useful data on the question of whether a link exists between a product’s architecture and the structure of the organization from which it comes. WE show that the architecture of a product developed by a highly distributed team of developers (Linux) was more modular than another product of similar size developed by a colocated team of developers (Mozilla). Critically, however, I find that a purposeful effort to redesign Mozilla resulted in an architecture with greater modularity. Hence, the initial differences between Linux and Mozilla were not driven by the different functional requirements of these products. These results are consistent with the idea that a product’s design mirrors the organization that develops it. ((MacCormack, Rusnak et al. 2006), p1027)
Thus, MacCormack et al. clearly indicate how Open Source projects try and avoid Conway’s Law STSC by increasing modularity of the software and thus using it as a coordination mechanism. von Krogh et al. (2003) study joining and early contribution and its relation to the collective action of open source software innovation. They use the term “specialization” to denote Code Ownership and note: Roughly 80% of all files created and/or modified by a maximum of two developers during the period of analysis, with a mean value of 1.88 contributors per file. (von Krogh et al., 2003, p1230)
104
Thus showing a high level of Code Ownership and thereby having less than two developers per file on an average. On the other hand, they notice a very interesting way of avoiding Conway’s Law STSC. In one of the interviews one of the core developers had the following to say: “”We are adding a public key to the cryptography to the entire system, and unfortunately, any change you make in that affects just not only the protocol, which is what I am working on right now, but it affects how the keys are handled (Module 4), how the client interprets the keys (Module 8), how data is verified. Basically, that little change affects pretty much everything in Freenet and, therefore, the kind of people making those changes, myself and (developer #6) mainly, have to understand everything that happens in Freenet in order to do it.”” (von Krogh et al., 2003, p1230)
Thus, showing the way the software developers tackled the Conway’s Law STSC. The developers proactively assigned tasks to themselves, especially ones that involved modifying highly dependent modules thus removing the need for additional coordination. Further, von Krogh et al. observe the following: “Developer #101 contrasts this with the core node functionality, including cryptography, where the “learning curve” for newcomers is very high because it requires thorough understanding of modules and features and their interconnectedness. As I reasoned, those modules are highly intertwined and specific to the project and require significant past investment in learning about the architecture, thus erecting contribution barriers for newcomers” (von Krogh et al., 2003,
p1232) Thus, reiterating the coordination mechanism used by core developers to avoid Conway’s Law STSC i.e. assigning the modification of complex higher interdependent modules to themselves. Mockus et al. (2002) describe and compare the development process of two Open Source software development projects namely Apache and Mozilla to commercial software development. They particularly test seven hypotheses related to the development process that also includes a hypothesis on Code Ownership. For the Apache Project they observe:
105
“For the Apache project, I noted that the process did not include any “official” code ownership; that is, there was no rule that required an owner to sign off in order to commit code to an owned file or module.” (Mockus et al., 2002, p29)
Thus, suggesting the lack of code ownership in the Apache project and on the other hand they observe the following for the Mozilla project: “In Mozilla, on the other hand, code ownership is enforced .. the module owner is responsible for: “fielding bug reports, enhancement requests, patch submissions, and so on. The owner should facilitate good development, as defined by the developer community.” Also, “before code is checked in to the CVS Repository it must be reviewed by the appropriate module owner and possibly peers.” (Mockus et al., 2002, p29)
Thus, the enforcement of code ownership in the Mozilla project is clearly mentioned in this paper. Mockus et al. (2002) describe the coordination mechanism used by Apache developers who avoid Conway’s Law STSC without resorting to communication. Apache adopts an approach to coordination that seems to work extremely well for a small project. The server itself is kept small. Any functionality beyond the basic server is added by means of various ancillary projects that interact with Apache only through Apache’s Ill-defined interface. That interface serves to coordinate the efforts of the Apache developers with anyone building external functionality, and does so with minimal ongoing effort by the Apache core group. … The coordination concerns of Apache are thus sharply limited by the stable asymmetrically controlled interface. The coordination necessary within this sphere is such that it can be successfully handled by a small core team using primarily implicit mechanisms.. … The tasks of finding and reporting bugs are completely free of interdependencies, in the sense that they do not involve changing the code. (Mockus et al. (2002), p34-35)
Thus, Mockus et al. (2002) describe how the Apache community avoids the need for communication to resolve Conway’s Law STSC and instead adopts other coordination mechanisms. In the case of the Mozilla project they have this to say:
106
However, the Mozilla modules are not as independent from one another as the Apache server is from its ancillary projects. Because of the interdependence among modules, considerable effort (i.e., inspections) needs to be spent in order to ensure that the interdependencies do not cause problems. In addition, the modules are too large for a team of 10 to 15 to do 80% of the work in the desired time. Therefore, the relatively free-wheeling Apache style of communication and implicit coordination is likely not feasible. (Mockus et al. (2002), p35)
Rigby et al. (2008) describe the process of code reviews in a case study of Apache and observe the following: “Since the contribution sizes are very small (see Section4.3), one would expect that the discussion would remain very localized. However, our findings indicate that a large proportion of the reviews that found defects discussed the abstract or global implications of the contribution. One explanation for this finding is the lack of “code ownership” exhibited by Apache developers”(Rigby, 2008, p7)
This reiterates the observation of lack of code ownership in Apache by Mockus et al. (2002). Rigby et al. (2008) also deal with the reduced communication possibilities in Open Source projects: Since the original developers were all volunteers who had never met in a face-to-face manner, it would seem natural that they would examine each other’s code before including it in their own local server. (Rigby et al.(2008), p2)
Thus, Rigby et al. (2008) describe the coordination mechanism Apache developers use in order to mange highly interdependent code in the Apache HTTP server project without resorting to communication. This particular coordination mechanism involves frequent reviews of code by Core team members thus reducing the problems that occur when dependent modules are modified. Dinh-Trong and Bieman. (2005) observe the following about Code Ownership in FreeBSD: Our study shows that, among 26,048 .c and .h files, only 30 percent of the files were modified by one committer, 25 percent by two committers, 15 percent by three committers, and 8 percent by 10 or more committers. One file was changed by 74 developers. In fact, every committer has the privilege to make any change to any file in the system. Code ownership in FreeBSD does not exist.
(Dinh-Trong and Bieman, 2005, p8)
Clearly stating that code ownership in FreeBSD as in Apache doesn’t exist thereby also reiterating what Jorgensen (2001) stated earlier in his paper. 107
Bird et al. (2006) analyse the social network of Apache HTTP server project by mining the Apache mailing list. On calculating the betweenness centrality of the developers and correlating it with the changes to the source code, they find the following: In fact the correlation for betweenness is quite high, at 0.757. It should be noted that these are non-parametric correlation measures, and are thus more robustly indicative of a relationship. This indicates that even within the higher-status group of developers, the most active developers play the strongest role of communicators, brokers, and gatekeepers. It’s also noteworthy that the correlation with document changes is much weaker, indicating that higher activity in source code is a stronger determinant of social status than activity in documents. (Bird et al. (2006a), p6)
Hence, Bird et al. (2006) show that the Core developers have a higher betweenness centrality than peripheral developers. The peripheral developers thus manage to avoid the Betweenness Centrality STSC for an open source project. Bird et al. (2006) replicate this case study on another Open Source project called PostGres to achieve similar results. 7.2.1 Discussion All the case studies considered in the above literature are from highly successful Open Source projects namely, Apache, Mozilla, Netbeans, FreeBSD, GNOME, Linux (and Fetchmail) and Freenet. While some of these projects like Mozilla, Netbeans have the backing and support of commercial companies, the rest are purely Open Source projects started by individuals. As seen in Table 8, ten papers mention Code Ownership pattern, five mention Conway’s Law pattern, while we could only locate two papers that explicitly mention the Betweenness Centrality match pattern. In Table 8, we see that the number of crosses and the number of ticks are nearly the same for the Code Ownership pattern. We see that the company supported Open Source projects (Netbeans, Mozilla) use Code Ownership pattern to coordinate the development process, with the exception of Freenet. Mockus et al. (2002) reason, that this could be because the commercial projects are started within the companies where the development teams develop a more interdependent piece of code. Thus, the company needs more formal mechanisms to coordinate, like code ownership mechanism. On the other hand, they say that teams of core developers in Apache do not practice code ownership. Instead, they use the coordination mechanism of keeping the core functionality of the server small, in order to make it easier to understand and modify some other developer’s implicitly owned code. Further investigation is required to verify if Linux and FreeBSD implement code ownership. We see that 108
all the case studies that mention the dependencies between individual code modules or between parts of the architecture, do not suggest communication as means to coordinate the dependencies, as suggested by the Conway’s Law pattern. Instead, the case studies mention other coordination mechanisms, such as few core developers taking up the task of modifying highly interdependent pieces of code (von Krogh et al., 2003), by designing stable interfaces (Mockus et al., 2002) and by performing frequent code reviews (Rigby et al., 2008). Performing frequent code reviews is a coordination mechanism that minimizes communication, as one can concentrate on the dependencies being affected by previous modifications, without having to resort to communication. Again, Mockus et al. (2002) reason that this could be because the “communication-only” approach does not scale and as the complexity and size of the project increases the channels of communication can get overwhelmed. It is clear from the onset that Open Source developers do not have the same motivations as Commercial developers (Lerner and Tirole 2002; Ye and Kishida 2003; Lakhani and Wolf 2005). So, the management of Open Source developers has to be different from the management of Commercial developers. As, even if the Project Leader of an Open Source project wants to relocate tasks or enable communication among developers he or she has to wait for the developer to get self motivated and take proactive steps. This proactive behaviour, on a “need to basis”, could explain why, mostly, only the core developers coordinate the development process and as a result have a higher betweenness centrality, as observed in the case study by Bird et al. (2007). Furthermore, pure Open Source projects being the meritocracy (a social system based on merit) they are, discourage developers who are inexperienced from coordinating the development process (Ducheneaut, (2005)). To summarise, the three Socio/Technical Patterns: Code Ownership, Conway’s Law and Betweenness centrality match, are not very applicable in Open Source projects as: (i)
(ii)
Code Ownership is usually implicit in many pure Open Source projects (noncommercial) and not enforced. The reason behind this could be to encourage core developers and give them the freedom to analyse and modify other’s implicitly owned code, thereby facilitating good code reviews. As a result the core developers employ other coordination mechanisms such as keeping the core functionality of the software small in order to enable easier understanding, as is done in the case of Apache and Linux (Mockus, Fielding et al. 2002). Conway’s Law is usually not practiced in an Open Source development environment as communication as a means of solving different coordination prob-
109
(iii)
lems is not suitable in a large globally distributed environment (Mockus, Fielding et al. 2002). Instead, the many Open Source projects employ other coordination mechanisms such as enabling only core developers with sufficient experience to take up the task of modifying highly interdependent pieces of code (von Krogh et al., 2003), by designing highly stable interfaces (Mockus et al., 2002) and by performing frequent code reviews (Rigby et al., 2008). Though all the literature reviewed indicated that Betweenness Centrality pattern is applicable to Open Source projects, there were not many case studies available to confirm this fact. As most developers of Open Source projects work on the project in their free time, they try to have a bias towards “action” (Yamauchi, Yokozawa et al. 2000), hence they would avoid trying to coordinate the project out of turn. A review of literature reveals that Open Source projects are generally a meritocracy (Fielding 1999; Ducheneaut 2005), and very often only a core developer is nominated to coordinate and manage releases as a Release Manager (Mockus, Fielding et al. 2002; Jensen and Scacchi 2007). In such a scenario, it is very unlikely that an inexperienced peripheral developer would take up the initiative to coordinate the development, review or the release of the Open Source software module.
Hence, what an Open Source project leader needs to help him coordinate the development process are Process Patterns that deal specifically with the idiosyncrasies of the Open Source development process. As seen form the Table 8 with the possible exception of Betweenness Centrality Match Pattern, most of the Socio/Technical patterns that are applicable in the commercial closed source environment are not really applicable in the Open Source environment. In the following sections, we describe the new Patterns that are required to deal with the coordination issues for Open Source software development.
7.3 Open Source Software Development Process Distributed self-organizing teams develop most Open Source software. Developers from all over the world rarely meet face to face and coordinate their activity primarily by means of computer-mediated communications, like e-mail and bulletin boards (Raymond 1999; Mockus, Fielding et al. 2002). For an IT professional or Open Source project leader it seems to be crucial to know the status of the Open Source project in order to contribute or recommend the project (Crowston and Howison 2006). To this extent, we provide a set of STSCs along with the associated Patterns which can be checked in order to see the coordination inconsistencies of the work being done in an Open 110
Source project. In this section, we discuss two types of Patterns for Open Source projects, namely a Technical Pattern and a Socio-Technical Pattern. The purely Technical Pattern, as the name suggests, deals with only the software and related artefacts created as part of the Open Source development process. On the other hand, Socio-Technical Patterns deal with the social as well as the technical aspects together, such as about which developer is modifying which part of the technical artefact. In this section, we motivate and develop a pattern for Open Source development environment for each of these two types. We then describe how one can identify the Structure Clashes related to this pattern.
7.4 Technical Structure Clash (Modularity Pattern) Software Modularity is considered a very important and critical parameter for successful Open Source projects. Authors like O’Reilly (1999) have claimed that Open Source software is inherently more modular than commercial software. While other authors have reasoned that Open Source software needs to be more modular in order for the development process to be coordinated more easily (Mockus, Fielding et al. 2002). On the other hand, there exists literature that have analysed Open Source software quantitatively and that do not agree that it is indeed more modular. Schah et al. (2002) study Linux’s kernel modules and count the number of instances of common coupling (coupling between files due to calls to external variables). They find that, the modules experience exponential growth in common coupling for successive Linux versions, thus leading to high failure proneness. Yu et al. (2006) compare the common coupling of Linux kernel to the kernels of different software for Open Source projects (FreeBSD, NetBSD and OpenBSD) and find that the amount of common coupling for Linux to be much greater than other Open Source software projects. Paulson et al. (2004), compare the coupling of Open Source projects (Apache, Linux and GCC) with three closed source projects. They do so, by comparing the growing versus the changing rate for software (as a tighter coupling will require more changes with each additional feature). Their results indicate that Open Source projects need more changes when new features are added. Hence, suggesting tighter coupling in Open Source projects than previously understood. MacCormack et al. (2006) compare the architectures of Linux and Mozilla by comparing the pattern of distribution of their software coupling. They find that Linux had a more modular structure than the first version of Mozilla. While after a redesign the resulting architecture, Mozilla became more modular than the previous versions and even more modular than Linux. As Mozilla was redesigned in an effort to make it an Open Source project, this result is in line with the view that in order to have a successfully coordinated Open
111
Source project one needs to have a loosely coupled and modular software (MacCormack, Rusnak et al. 2006). Pattern Format
Modularity Pattern (MacCormack, Rusnak et al. 2006) Making sure Open Source software has few interdependencies (low coupling)
Problem: A problem growing from the Forces Context: The current structure of the system giving the context of the problem
The Open Source software project has software code in place
Forces: Forces that require Resolution
When the modularity of the software under development has a sharp decrease in modularity (increase in the interdependence of the modules). Make sure that the modularity of the software is kept high, by refactoring the code if necessary
Solution: The solution proposed for the problem Resulting Context: Discusses the context resulting from applying the pattern. In particular, trade-offs should be mentioned Design Rationale/Related patterns: The design rationale behind the proposed solution. Patterns are often coupled or composed with other patterns, leading to the concept of pattern language.
The software code will increase its modularity
Open Source software needs to be very modular (have low coupling) in order to make coordination easier
Table 9: Modularity Technical Pattern for Open Source projects
We postulate that, if there is a sudden increase in the coupling of an Open Source system then it could hamper coordination of the project and hence result in a Technical or even a Socio-Technical Structure Clash. Hence, we suggest the Modularity Pattern for Open source as shown in Table 9. We investigate the Modularity Pattern (Table 9) in a large open source project namely, JBoss application server. JBoss project was started in 1999 by Marc Fleury who wanted to advance his research interests in middleware. JBoss Group LLC, was incorporated in 2001 and JBoss became a corporation in 2004. After a few bids from big companies, JBoss was finally acquired by Red Hat in 2006. The JBoss Application Server is one of the main products of the JBoss project and is said to have pioneered the professional Open Source business model. JBoss has 79 listed developers and three project administrators of which one is the Chief Technical Officer (CTO) of JBoss. JBoss was voted the project of the Month for the month of April in (Sourceforge 2003). Recently, JBoss has also won the popular BOSSIES award. 112
In order to analyse Technical Structure of the JBoss software, we read the CVSLog using TESNA from the CVS Archive of the JBoss Application Server (JBoss) over the period starting from May 2002 to December 2006, which was the time period in which JBoss used CVS as their code version control system. We then grouped the log files so that they reflected the time periods between version releases. We use the Software Dependency Matrix to calculate the Propagation Cost similar to what MacCormack et al. (MacCormack, Rusnak et al. 2006) do. In order to calculate the Propagation Cost, MacCormack et al. first raise their dependency matrix to successive powers of n and obtain the direct and indirect dependencies for successive path lengths (MacCormack, Rusnak et al. 2006). They then obtain a Visibility Matrix by summing up all the successive powers of the dependency matrix. From the Visibility Matrix they calculate the “fan-in” and “fan-out” visibilities by summing along the columns or the rows and dividing the result with the total number of elements. As we consider undirected dependencies (like MacCormack et al., 2006), we find the “fan-in” visibility to equal the “fan-out” visibility, which is what MacCormack et al. call as the Propagation Cost (MacCormack, Rusnak et al. 2006). The variation of the Propagation Cost over the different versions of JBoss Application Server (simply known as JBoss) is shown in Figure 41. In order to calculate the Clustered Cost, MacCormack et al. cluster the Dependency Matrix using an algorithm by Fernandez (1998). Where, they define a cost function and an element is allocated to a cluster only if and when the net cost of adding the element decreases the existing Clustered Cost of the element (MacCormack, Rusnak et al. 2006). We use the same algorithm to calculate the Clustered Cost of the Software Dependency Matrix. (Algorithm 1, Chapter 4, Section 4.4.2.1). The variation of the Clustered Cost of JBoss over different versions is shown in Figure 42. We analysed the Mailing List archive of JBoss, in order to determine the communication patterns used by the developers. Especially to discuss the development of the system, report bugs, coordinate the bug fixes, as well as discuss new features before and after the release of each version. An analysis of the different mediums of coordination in JBoss revealed that the Mailing List was the primary means of coordination. Unless the developers used private means, which is considered unlikely given the trend of openness in Open Source projects (Raymond 1999). The Mailing Lists were analysed from one month before each release to one month after each release, corresponding to the period of analysis of the CVS repository (i.e. from April 2002 to January 2007). We did a qualitative analysis of the messages in the Mailing List archive looking for coordination mechanisms used by the developers. In order to do this, we read randomly selected mails looking for coordination mechanisms as described in previous literature. The following post mailed on 28th of June shows how the management of each release was undertaken by one of the Project Leaders (Scott Stark in this case). 113
Its
about
36
hours
until
I'm
planning
on
cutting
the
3.0.1
release.
Any
changes you want in 3.0.1 should be in by Sat Jun 29 18:00:00 2002 GMT. xxxxxxxxxxxxxxxxxxxxxxxx Scott Stark
This post also shows that the planning for a release was done around a month earlier to the release, as the release date for version 3.0.1 was on 6th August 2002. While the following post shows another instance of a post reporting a fix for a bug. Sender: d_jencks Logged In: YES user_id=60525 I believe I have fixed this in HEAD. I'd appreciate verification before I backport it to 3.2, since it is a substantial refactoring of the ejb deployment/service lifecycle code. I'll close this after backporting to 3.2.
This post shows two important mechanisms; the first is the request for verification implying the coordination mechanism of code review as was described by Rigby et al. (2008), while the other mechanism is the one which d_jenks refers to as “backport”. By “backport” the author refers to making changes to the previous version well after the release (2002-08-27). This coordination mechanism coincides with what was observed by Yamauchi et al. (2000), namely, a bias towards action first and coordination later. Given that the planning for the release and the coordination for the bugs in the release was conducted around a month before and a month after the release respectively, we decided to consider the messages related to a release over a three month window. The reason for this, was that, a three month window would cover the month before, during as well as the month after the release.
114
Figure 41: The variation of Propagation Cost of
Figure 42: The variation of Clustered Cost of JBoss
JBoss over different versions
over different versions
7.4.1 Discussion Figure 41 describes the variation of the Propagation Cost of JBoss over the different versions, while Figure 42 denotes the variation of the Clustered Cost of JBoss over different versions. In both figures and particularly in Figure 42 we notice a sharp rise in the Clustered Cost for version 3.2.7. While the increase in the Propagation Cost is minor the increase in the Clustered Cost for version 3.2.7 is quite marked. We even calculated the KLOC (Lines of Code in thousands) of each of the versions to see how much code was actually added. Figure 43 shows the variation of KLOC over the different versions of JBoss. As can be seen from the figure the trend is similar to the variation of coupling seen in Figures 41 and 42. The largest increase in KLOC, as evident from the slope of the graph in Figure 43, occurs for version 3.2.7. Clearly showing that for version 3.2.7 not only was the complexity of the code increased (with the increased coupling), but also the size. When one considers the Open Source Modularity Pattern as described in Table 9, we notice that this is an instance of a Modularity Technical Structure Clash, or a Modularity TSC. This TSC would therefore require an increased amount of coordination to resolve the extra dependencies and features included for version 3.2.7. Figure 44 describes the variation in the number of messages over the different versions of JBoss. We see a huge increase in the number of messages for discussing the features and bugs for version 3.2.7. The increase in the number of messages is nearly 5000, nearly twice more than the average number of messages (2650) discussing other versions. Though one needs to analyse the mails more closely to ascertain if they are indeed discussing the particular version, one can say with some confidence that this sharp increase in messages can be explained by the increased need for coordination. This increased need for coordination arises from the increased number of couplings and related features of JBoss in the release. One might also vary the time window to make sure that only messages discussing the par115
ticular version are included. However, we find through an analysis of the email messages that even if the time window is decreased, the trend noticed in Figure 44 is not affected considerably. Such an increase in the communication of the developers in the eMail List can indicate how the developers of JBoss satisfy the changing coordination needs for different versions and as a result remains a successful Open Source project. Had the coordination not increased to offset the increase in coupling and complexity of the software, we might have noticed a Socio-Technical Structure Clash resembling the Conway’s Law STSC. The eMail archive of JBoss also reveals two particular coordination mechanisms used to coordinate the development of JBoss, namely code reviews (Rigby, German et al. 2008) and post-release coordination (Yamauchi, Yokozawa et al. 2000). For external validity one needs to conduct a similar study for different Open Source projects to see if the findings match. Though the Modularity Pattern is also relevant to closed source development, the pattern is more interesting and applicable to Open Source software due to the need to reduce the coupling and increase the modularity of Open Source software (MacCormack, Rusnak et al. 2006).
7.4.2 OSS Community Structure Although there is no strict hierarchy in Open Source communities, the structure of the communities is not completely flat. There does exist an implicit role-based social structure, where certain members of the community take up certain roles based on their interest in the project (Ye and Kishida 2003).
116
Figure 433: Variation of KLOC with Version number of JBoss
Figure 444: Variation of the Number of eMail messages with JBoss Version number
Figure 455: The Onion Model of an OSS Community
A healthy Open Source community has the structure as shown in Figure 45 with distinct roles for developers, leaders and users. The Project Leaders who could also be Core Developers are responsible for guiding and coordinating the development of an Open Source project. These developers are generally involved with the project for a relatively long period, and make significant contributions to the development and evolution of the Open Source system. In those Open Source projects that have evolved into their second generation there exists a council of core members that take the responsibility of guiding development. Such a council replaces the single core developer in second-generation projects like Linux, Mozilla, Apache group etc. 117
·
Project Leaders: The Project Leader is generally the person responsible for starting the Open Source project. This is the person responsible for the vision and overall direction of the project. · Core Developers: Are responsible for guiding and coordinating the development of Open Source projects. Core Developers or Core Members have generally been with the project for a long time (sometimes since the project’s inception) and have made significant contribution to the system. In some communities they may be called as Maintainers. · Contributing Developers: Also known as peripheral developers, occasionally contribute new features and functionality to the system. Frequently, the core developers review their code before inclusion in the code base. By displaying interest and capability, the peripheral developers can move to the core. · Active Users: Contribute by testing new releases, posting bug reports, writing documentation and by answering the questions of passive users. · Bug Reporters: Discover and report bugs. They might not be fixing bugs as they generally do not read the source code. They can be considered the same as testers in commercial software development. · Passive users: Generally just use the system like any other commercial system. They may be using Open Source because of the quality and the possibility of changing when needed. Each Open Source community has a unique structure depending on the nature of the system and its member population. The structure of the system differs on the percentage of each role in the community. In general, most members are passive users, and most systems are developed by a small number of developers (Mockus, Fielding et al. 2002). Crowston, Wei et al. (2006) describe three methods to identify a core-periphery structure in Open Source projects. The three methods include formally appointed roles, distribution of developer contributions and an analysis of the Core-Periphery structure of the social network of the developers using the Core-Periphery concept from Borgatti and Everett (1999). They find that all three methods give different results with the developer distribution being most useful. In this research we apply the Core-Periphery structure of the developer social network (Crowston, Wei et al. 2006) to the developer Core-Periphery structure related to the software call graph (what we call the Socio-Technical Core-Periphery structure). We then see how the movement across this structure relates to the health of the project. We also show how this movement can be monitored using visualizations as well as a metric. In the next section we dwell on the Open Source literature surrounding Core-Periphery structures, and then we describe what is meant by Socio-Technical Core-Periphery in the context of Open Source projects, this is followed by a Case study to provide a preliminary validation of the STSC. 118
7.4.3 Literature Overview of Core-Periphery in Open Source In the literature overview presented here we start by discussing papers published using the Social concept of core-periphery and move on to papers published using the SocioTechnical concept of core-periphery while paying attention to the whether the papers mention a static structure or describe a more dynamic evolution of the socio-technical communities. In the Open Source context there have been quite a few papers in the recent past discussing the Social Concept of Core-Periphery. Moon and Sproull (2000) describe the process by which the Linux operating system was developed. They study the linux-kernel mailing list and notice that 50% of the messages are contributed by only 2% of the total contributors and 50% of the 256 core contributors are members of the core team of developers and maintainers. Mockus et al. (2002) analyse Apache httpd project and find that only around 15 developers contributed 80 percent of the code while bug reporting was decentralized with the top 15 developers only contributing 5 percent. Crowston and Howison (2003) analyse the bug trackers for 120 Open Source projects from Sourceforge (Sourceforge Retrieved 1st August 2008)and study the social communication structures in the projects. They find that a consistent Core-Periphery Shift Pattern does not exist across different projects. Lee and Cole (2003) describe the core-periphery structure in Open Source projects as a two tier structure and describe how this structure of an organization accommodates scale better than hierarchical structure found in a typical commercial firm. They reason that this is because in the two tier organization the peripheral developers follow Linus’s Law (Raymond 1999), i.e. that defects are found and fixed very quickly due to the peripheral developers, or in other words that debugging is parallelizable (Raymond 1999). Xu et al. (2005) quantitatively analysed a large data dump from Sourceforge. What they noticed was that large and small projects had different distributions of core and peripheral developers. While large projects had many co-developers and active users, small projects had a majority of project leaders and core developers. Ye and Kishida (2003) analyse the GIMP project in order to understand the motivation behind new members joining and aspiring to have more influential roles in an Open Source project. They postulate that the motivation could be in the learning that is possible through Legitimate Peripheral Participation (LPP). In particular they notice that there is a relationship between active participation in the mailing list and the contributions made to the GIMP software thus showing that the GIMP community is a meritocracy. Nakakoji et al. (2002) analyse the evolution of developer roles in four Open Source software projects. They note that the evolution of developer roles is consistent with the theory of LPP and is determined by the existence of enthusiastic developers who aspire for more influential roles and the nature of the community that encourages and enables role changes. They further describe the co-evolution of the communities along with the systems, 119
noting how any modification done to the system not only makes the system evolve but also modifies the roles of the developers and the social dynamics of the community. They cite the example of GIMP and explain that without new members aspiring to become core developers, the development of the Open Source project will stop the day the existing core members decide to leave the project in pursuit of other ventures (Nakakoji, Yamamoto et al. 2002). Herraiz et al. (2006) study the pattern of joining the GNOME Open Source project. They notice a majority of developers committed a change in the CVS repository before posting a bug report, thus indicating that the onion model (Figure 1) based on the mailing lists and bug tracker is not very accurate when used to predict the joining behaviour of new members. Moreover, they noticed the difference in the joining patterns of volunteers and hired developers, while volunteers had a slow joining process the hired developers integrated into the community very fast. Christley and Madey (2007) study the global versus temporal social positions from data dump from Sourceforge.net (Sourceforge Retrieved 1 st August 2008). They find that new members can initially occupy any of the peripheral social positions, and eventually move to the position of a software developer or a handyman (a person who does a little bit of everything). They find this pattern especially true in software projects that maintain a high activity level after the initial months. Ducheneaut (2005) analyses the socio-technical joining behaviour of new members for the Python Open Source project. Ducheneaut (2005) analyses both the social and the technical networks over time and shows how the socialization of new members is both individual learning as well as a political process. All the papers mentioned above discuss the notion of core-periphery in Open Source software development from the social network notion, i.e. the communication ties between the members of the Open Source project. While there is a lot of literature discussing the core-periphery aspect of Open Source team as we have discussed, there are only a handful of papers (we could only locate two) that discuss the core-periphery aspect of Open Source from a socio-technical point of view, i.e. by first considering the two mode network of the developers working on the different software and then looking at the affiliation network of the developers (where two developers are connected if the work on the same software modules or dependent modules). Lopez et al. (2006) apply social network analysis techniques to the affiliation networks of developers (where two developers are connected if they work on the same software modules) for Apache, GNOME and KDE projects. When they plot the average weighted degree of the developers they find that the developers with higher degrees are only related to developers with similar degrees. Hence, they postulate that these developers can be called “core”. de Souza et al. (2005) identify changes in developer positions in different Open Source projects by studying the Socio-Technical network of developers. They notice a core periphery 120
shift by mining software repositories. The core-periphery shift in a healthy Open Source project is when the peripheral developers move from the periphery of the project to the core, as their interest and contribution in the project increases (de Souza, Froehlich et al. 2005). Table 10 lists all the literature reviewed in this section along with a brief description of the case and whether the particular paper studied a static or dynamic core-periphery shift. As shown, most of the literature has concentrated on static core-periphery descriptions of Open Source social networks. We could only locate two papers of which only one looked into the dynamic aspect of socio-technical core-periphery shift. This research adds to the literature on socio-technical core-periphery shift pattern while providing another way of assessing the health of an Open Source project. Our notion of Core-Periphery is from the perspective of the software, namely, if a developer modifies a more dependent part of the code, he or she affects more code modules than when modifying the periphery modules. Using the average Core-Periphery shift metric we build on the notion of how one can determine the health of an Open Source project (Crowston and Howison, 2006). Papers
Open Source Project
Artefacts Analysed
Moon and Sproull, (2002) Mockus et al. (2002)
Linux
Code Release and Linux mailing lists.
Crowston , Howison (2003) Lee and Cole (2003)
Xu et al. (2005) Crowston, Wei et al.(2006) Ye and Kishida (2003)
Apache, Mozilla
120 projects from Sourceforge Linux
Sourceforge projects (data dump) Projects from Sourceforge GIMP
Participant, feedback on description of development process, eMail, CVS and Bug Repository Bug Tracking systems Source Code analysis , code related artefacts, developer working patterns and Linux kernel mailing list Quantitative analysis of Sourceforge data Analysis of Bug Tracking systems. Mailing List, CVS Log
121
Social CorePeriphery Structure
SocioTechnical CorePeriphery Structure
Static/Dynamic Analysis
√
Static
√
Static
√
Static
√
Static
√
Static
√
Static
√
Dynamic
GNU Wingnut, Linux Support, SRAPostgreSQL, Jun GNOME
Developer Interviews, Analysis of the mailing lists
√
Dynamic
CVS Logs, Mailing List and Bug tracker
√
Dynamic
Christley and Madey, (2007) Ducheneaut (2005) Lopez et al.,(2006)
Sourceforge projects (data dump) Python
Quantitative analysis of Sourceforge data
√
Dynamic
√
Dynamic
de Souza et al.(2005)
Megamek, Ant, Sugarcrm, cvs, python
Nakakoji et al.(2002)
Herraiz et al. (2006)
Apache, GNOME, KDE
CVS Logs and Mailing list Mining CVS Repository
√
Static
√
Dynamic
CVS Logs
Table 10: Literature Overview for Core Periphery Shifts
All the papers mentioned above do not define the Core-Periphery structure of the social or technical network explicitly as attempted in this section and focus more on how developers can successfully contribute to an Open Source project rather than on the health of the Open Source project. We also wanted to explore what are the trends of motion in various Open Source projects. In order to identify the trends of motion we needed a technique to first identify the core and the periphery of software. Then we needed a technique to visualize the bipartite (or affiliation networks) core and the periphery of the software along with the developers working on them. This visualization also needs to be easily understandable (Miller 1956; Baddeley 1994). In order to make the visualization understandable we cluster the software modules into 9 clusters (as will be described in the next section). We then create a bipartite or 2-mode affiliation network (Wasserman and Faust 1994) of the clusters and the developers. But, unlike a normal 2-mode network where the connections between the nodes of each mode are not displayed, we show dependency relations (connections) between the Software Clusters. By showing the dependencies between the Software Clusters we want to make the location of each cluster with respect to the other clusters visually clear and thereby show how Core or Periphery the cluster each developer is working on is. The first paper to define and comprehensively describe the concept of core-periphery is Borgatti and Everett (1999). They consider two types of core-periphery models namely (i) Discrete Model: this model contains just two clusters a core and a periphery. An actor belongs to the core depending on the correlation of the matrix of connections with the ideal core-periphery matrix (where a small group of actors, or the core form a clique and the rest are only connected to the core actors) (ii) Continuous Model: in this model they consider 122
three clusters a core, a semi-periphery and a periphery and suggest that one can try partitions with even more classes. According to Borgatti and Everett the concept of CorePeriphery structure describes the “pattern of ties” between actors in a network where the core is more densely interconnected than the periphery. The notion of Core-Periphery used in this research is based on this continuous model of Core/Periphery structure (Borgatti and Everett 1999) and applies this concept of Core-Periphery (Crowston, Wei et al. (2006)) to a Socio-Technical perspective. Thus, this is similar to the Core-Periphery perspective of de Souza et al.(2005) and Lopez-Fernandez et al.(2006). At the same time it is different as we cluster the software and then see how core the module is that the developer is modifying. de Souza et al. (2005) define Core and Periphery in terms of the dependencies between developers, i.e. from the developer to developer dependency network. The Core-Periphery notion used in this paper is a reflection of the part of the software a developer changes. This is different from just looking at developer-developer dependency as if a developer is in the core of the developer to developer network doesn’t imply that the developer is working on the most dependent part of the Call Graph. As even if the developer is working on the Periphery of the software, for e.g. changing HTML documentation files, he could be central in the developer-to-developer network (e.g. dependencies among the html documentation files). Hence, if the change the core developer makes affects more developers, the changes (e.g. HTML documentation) might not be critical for the project as a whole. So if a developer shifts from the Core to the Periphery it need not necessarily have an impact on the health of the software. Thus, the Core-Periphery notion in this research is from the perspective of the software, i.e. if a developer modifies a more dependent part of the code and hence affects more software code modules than when working on the periphery modules. So, in this sense we can be adding one more technique of defining Core-Periphery developers (Crowston, Wei et al. 2006; Amrit, Hegeman et al. 2007). We postulate that if the developers working on the core of the project move towards working on the periphery of the project and at the same time developers working on the periphery don’t move to the core, then this indicates an STSC. This seems especially true if the core of the software is not stable, but after studying various Open Source projects with stable software cores we think one can safely say that its true for most if not all Open Source projects. This Open Source STSC is illustrated in Table 11. Pattern Format Problem: A problem growing from the Forces
Core-Periphery Shift Pattern (de Souza, Froehlich et al. 2005) Developers have sustained interest in working on the Core Modules of the software.
123
Context: The current structure of the system giving the context of the problem
Developers working on the different areas (Core/Periphery) of the Software.
Forces: Forces that require Resolution
When core developers move on to developing peripheral parts of the software. Get more developers interested in the core part of the software
Solution: The solution proposed for the problem Resulting Context: Discusses the context resulting from applying the pattern. In particular, trade-offs should be mentioned Design Rationale/Related patterns: The design rationale behind the proposed solution. Patterns are often coupled or composed with other patterns, leading to the concept of pattern language.
Make sure that more people are interested in the core part of the software project.
The core of the FLOSS project is vital to its performance and hence needs more work in order to reach stability.
Table 11: Core-Periphery Shift Pattern for Open Source projects
7.4.4 Identification of Core-Periphery STSC in Open Source In this section we describe how the Core-Periphery Shift STSC can be identified in an Open Source project. In order to identify the STSC we used a clustering algorithm based on the algorithm by Fernandez (1998) and later on used by MacCormack et al. (2006). We implemented this algorithm (Chapter 4, Section 4.4.2.1, Algorithm 1) to cluster the software components, as explained in the following subsection. The resulting software clusters are the red clusters seen in Figure 46. We then included the author information of the components (mined and then parsed from the project’s software repository (SVN)) in the same diagram and displayed the authors of the individual code modules as authors of the respected clusters (in which the code modules lay). This is shown in Figure 46 where the developers are shown as blue circles. As this clustering method is based on the dependencies between, the software components, the central cluster would represent the most dependent components of the software, or in other words the software core. Thus, the structure of the clustered software graph would represent the actual core and periphery of the software architecture. It has to be noted that this break up of core and periphery is based on software dependencies and could be different from that which was designed. In this Chapter we trace the coevolution of the project and the communities (Ye and Kishida 2003) and show the method of identifying Open Source related STSCs by looking at the author-cluster figures (Figure 46 – 48) at equal intervals in the development lifetime of the project. To make the identification more quantitative compared to a qualitative observation of the evolution of author124
clusters, we define a way of measuring the extent of this shift with a metric. The metric is based on the representation of the cluster graph and the author cluster graph (Figure 46) as Matrices as shown in the following subsection. 7.4.5 Measuring the Core Periphery Shift metric As described earlier, the core-periphery concept used in this section is based on the Continuous Model described by Borgatti and Everett (1999) and is calculated with nine classes (or clusters as they are called here). The reason behind the number of clusters is to keep prevent cognitive overload the when the number of elements is more than nine (using the famous seven plus or minus two rule) which build on the work by Miller (1956). The concept of core-periphery used in this paper is similar to the socio-technical concept used by Lopez et al. (2006) and de Souza et al. (2005) and uses affiliation networks of people depending on which part of the software they are working on or the core-ness concept depends on the “pattern of ties” among the software modules. The software is clustered into nine clusters, each of the clusters has a number assigned to it depending on how core the cluster is, and the number is then assigned to the developers who have modified a file in the cluster. This number is an indicator of how core the software is that a particular developer modified. The metric is called Average CPDM (Average CPDM) and as the name suggests describes the average distance from the core. In order to better understand the Core-Periphery Shift, we cluster the software based on the dependencies of the software modules using the algorithm described by Fernandez (1998) and used by MacCormack et al. (2006). The clusters formed from this clustering process represent the amount of dependency in the modules. The larger a particular cluster is the more number of closely dependent modules the cluster would have. After clustering we define the Cluster Dependency Matrix to represent the connections or dependencies between software module clusters. The corresponding People Cluster Matrix represents the people working on the clusters. We also have the Cluster Size Matrix which is the matrix of the sizes of the clusters in the Cluster Dependency Matrix. The procedure to calculate the core-periphery shift consists of the following steps: 1. Identifying the core and the periphery of the Cluster Dependency Matrix 2. Reordering the Cluster Dependency Matrix in the descending order of Core-ness. 3. Reordering the People Cluster Matrix in the same order as the Cluster Dependency Matrix. 4. Calculating the core-periphery metric In order to identify the core and the periphery of the Cluster Dependency Matrix we realize that the core-ness of a particular cluster depends not only on the size of the cluster but also
125
the dependencies of the particular cluster with other clusters. We hence multiply the Cluster Dependency Matrix with the Cluster Size Matrix. The resulting matrix gives us an indication of the core and the periphery clusters with the larger entries being more core than the smaller entries. So if we arrange the columns of this matrix in the descending order we would have the clusters in the descending order of core-ness. Now we can assign weights to the clusters (if there are 9 clusters then, 9 for the most core, 8 for the little less core, and so on) and take a weighted average based on which clusters the particular developer in the People Cluster Matrix has worked. The average of the Core-Periphery metric of all the developers together would give the Average CPDM of the software for the particular instance of time. The Algorithm can be summarised in Algorithm 2 (Chapter 4, Section 4.4.3.1, pg 62). The average of the Core-Periphery metric of all the developers together would give the Average CPDM of the software for the particular instance of time. 7.4.6 Empirical Data The purpose of this research is to help the software project manager become aware of the software core-periphery shifts in the software development process. To this end we tested our method on various Open Source projects from the large (in terms of size of software) and popular project like jEdit to relatively small and not so popular projects like JAIM and Megameknet. We chose these projects in order to get an idea of, as well as compare the Core-Periphery structures of small (JAIM), medium (Megameknet) and large (jEdit) projects. The software and the social technical connections required to develop the Matrices (described in the previous section) was collected from the Sourceforge.net site and mined with the help of our tool, TESNA. We could then construct visualizations (as in Figure 46) of the Core-Periphery shifts through time. We could also calculate the Average CPDM over equal time intervals of each project. In order to calculate the Average CPDM cumulative CVS Log data for the project was taken at regular intervals of time since the inception of the Open Source project. The Average CPDM was then calculated on this cumulative data (from the particular time period) according to the algorithm described in the earlier section.
126
Figure 46: The Core-Periphery snapshot of JAIM at the first instance of time
Figure 47: Snapshot of JAIM at the second instance, notice that the developer dingercat has moved to the periphery
127
Figure 48: Snapshot of JAIM at the third instance, notice that dingercat has moved even further to the periphery
Using the tool TESNA, we generated the author-cluster diagrams (using the matrices and the algorithm described in the earlier section) for the projects in Table 12. We noticed three distinct patterns of Core-Periphery shifts. They can be listed as: 1) a steady shift away from the core 2) oscillatory shifts away and towards the core (almost sinusoidal in nature) 3) no perceptible shift away or towards the core The first pattern was (a steady shift away from the core) was observed in the JAIM project as seen in Figures 46-48. In Figure 46 we notice the developer dingercat working on three Core software clusters (0, 3 and 6), while after an interval of time in Figure 48 he is working on only one core cluster (cluster 0). After another equal interval of time we see him not working on any of the software clusters, this means that he is modifying a non java file which could be an XML or HTML document. This trend is seen on plotting the Average CPDM versus the Version of the software as seen in Figure 49. We studied the JAIM project (like all the other projects) from the inception of the project (marked zero on the graph) until 10 months after the inception. In Figure 49 we see that after 7 1/2 months the Average CPDM reduces to zero as all the core developers (there were only two developers observed for the project) moved away from the core of the JAIM software.
128
Figure 49: The steadily decreasing Average CPDM of JAIM plotted over equal time intervals
We then analyzed the Open Source project called Megameknet. The Average CPDM of this project was plotted at equal intervals of time over a 17 month period (where month 0 indicates the start of the Open Source project). We observed oscillatory shifts away and towards the core. We also noticed that the peaks steadily decreased with time. This trend is seen on plotting the Average CPDM of Megameknet versus the version of the software as seen in Figure 50.
Figure 50: The oscillatory Average CPDM of Megameknet plotted over equal time intervals
Finally, we tested our Core-Periphery metric on a large Open Source projects like jEdit. We calculated the Average CPDM over a period of 7 years since the inception of the project. In this case we observed that after the initial dip there were no perceptible shifts away or towards the core over a period of time (Figure 51).
129
Figure 51: The steady Average CPDM of jEdit plotted over equal time intervals
We studied the Average CPDM of different projects from Sourceforge.net(Sourceforge Retrieved 1st August 2008) selected based on the following criteria on the basis of (i) size of the project, in terms of number of developers as well as Lines of Code (LOC) and (ii) based on the health of the project according to the status of the project on Sourceforge.net (Sourceforge Retrieved 1st August 2008). The other criterion for choosing the particular projects was that the language of coding had to be predominantly Java as TESNA currently can only calculate the call graph of software written in Java. Within this constraint we could get quite a diverse set of projects to study varying from 3 developers and 847 LOC (JAIM) to 79 developers and nearly 72 KLOC (JBoss). Table 12 shows the name of the Open Source Project, the development status, number of developers, LOC, Clustered Cost and which pattern of Core-Periphery shift was observed for the project. The LOC and Clustered Cost were calculated for the last version accessed from the home of the Open Source project. The rows of Table 12 are sorted in ascending order of the Clustered Cost of the different projects. From Table 12 we notice two projects that have a Core-Periphery shift away from the Core, namely JAIM and Eclipse Plugin Profiler. While JAIM has had very low activity (its last version release was in 2003), Eclipse Plugin Profiler is formally inactive. Table 12 also shows three projects with an Oscillating Core-Periphery shift away and towards the Core, namely ivy-ssh, JBoss and Megameknet. While ivy-ssh and Megameknet are declared inactive (on Sourceforge.net (Sourceforge Retrieved 1st August 2008)), JBoss is Production/Stable and as seen earlier is considered a successful Open Source project. So, intuitively as well as supported by this small but diverse sample of projects we can say that the Core-Periphery Shifts Pattern described in Table 11 is correct, in the sense that if a project has a steady shift away from the Core we can assume that the developer’s interest in the project has began to wane. But the converse as seen in the case of Megameknet and ivy-ssh need not be true, i.e. a project that is inactive or whose health is waning need not have a Core-Periphery shift away from the core. Further an oscillating shift to and from the
130
Core need not reflect poorly on the health of the project especially as the Average CPDM never touches zero (as in the case of Megameknet and ivy-ssh). Figure 52 represents the variation of the Average CPDM of JBoss, while Figure 53 represents the Average CPDM of ivy-ssh. As is clear from Figure 52 the Average CPDM of JBoss reaches one but does not become zero as it does in the case of Megameknet and ivyssh (Figures 50, 53). The reason why touching zero is considered bad is that, it means that during the period of observation not a single change has been done to the software (the Java code) and changes have only been done to the documentation or related files (like XML). As explained earlier the entries in Table 12 are arranged in the ascending order of Clustered Cost metric. From the data in Table 12 we can also gain some insight into the differences in modularity of the different Open Source projects. We see that even though JBoss has the highest LOC it is only 5th in Clustered Cost and hence much more modular than Megameknet or jython.
131
Name of OSS Project EIRC (Eteria IRC Client) JAIM Ivy-ssh Eclipse Plugin Profiler JBoss Megame knet jEdit jython
Development Status
Stable and Inactive Beta
Number of Active Developers
1 3
LOC
Clustered Cost
4,171
2,63E+07
847
4,03E+07
Shift Away from Core
Oscillating Shift away and towards Core
No Shift from Core (Steady)
√
√
Inactive
1
2,978
1,28E+09
√
Inactive
7
3,267
2,30E+09
Production/ Stable
79
71,974
1,01E+F10
√
Inactive
9
11,189
1,66E+10
√
Mature
156
29,957
8,85E+10
√
Production/ Stable
21
13,972
1,89E+11
√
√
Table 12: The Core-Periphery trends of the different OSS projects studied
Figure 52: The Average CPDM of JBoss Figure 53: Average CPDM of ivy-ssh
7.4.7 Conclusion In this Chapter, we have discussed three aspects of Open Source software projects: (i) The first section uses secondary analysis of published case studies to discuss how the Open Source development process is different from closed source commercial software de132
velopment and hence patterns that apply to closed source software development do not apply for Open Source development processes. (ii) The second section discusses a Technical Pattern that can be applied to Open Source software development that we call Modularity Pattern. We then go on to show how this Technical Pattern can be related to an Open Source version of the Socio-Technical Conway’s Law pattern. (iii) The third section does an extensive literature review and then discusses the different core-periphery shift patterns that one can observe in Open Source software projects. In the third section introduced a way of displaying socio-technical Core-Periphery structures as well as a metric to measure the shifts. We have demonstrated a visualization technique (a clustering based display mechanism) that can be used to identify these CorePeriphery shifts as well as a metric to measure the extent of the shift. We have also tested this technique by identifying Core-Periphery shift patterns in multiple Open Source projects. Crowston et al. (Crowston, Howison et al. 2006) describe code quality, user ratings, number of users/downloads and code reuse among other indicators for the health and success of an Open Source project. The core-periphery shift pattern could give us another indicator of Open Source project health. The project JAIM is in the beta stage of development and has all the signs of joining the ranks of an inactive and failed project in the Sourceforge database. So a steady shift away from the core could be an indication of lack of interest in the project. Through the identification of core-periphery shift patterns, we plan to provide the project leader (of JAIM for example) as well as potential interested developers with one more indicator the health of the Open Source project. An oscillatory shift away and towards the core with a CPDM of zero in-between, as in the case of the Megameknet project, could also be considered as unstable for the health of the project. While, a steady Average CPDM as in the case of jEdit could be considered as good for the health of the project. In the next Chapter (Chapter 8) we look at the causes behind the different STSCs provide insights for Project Managers, in a cross case analysis. We also look at the different threats of validity for the data and analyses done in the case studies.
133
8. Discussion of the Case Studies In this Chapter we discuss the findings of the case studies (we consider the commercial (closed source) and the Open Source cases separately). We also analyse the patterns and the related STSCs in each case study.
8.1 STSCs in the Commercial Software Development Cases Three STSCs were identified in the eMaxx Case study namely Conway’s Law STSC, Code Ownership STSC and Betweenness Centrality Match STSC. Two of these STSCs namely Conway’s Law and Betweenness Centrality were also found in the Mendix Case Study. In this section we look at the STSCs in more detail and elicit the lessons learned from them. 8.1.1 Conway’s Law STSC The Conway’s Law STSC as well as the Betweenness Centrality Match STSC was observed in both the Mendix and the eMaxx case studies, while, the Code Ownership STSC was only observed in the eMaxx case. The main reason for this is that the development tool followed a design science research methodology of iterative improvement. So, at the time of the Mendix case the TESNA tool did not have the functionality of displaying the Code Ownership STSC. It is interesting to investigate the broader managerial reasons behind the STSCs. In order to do that, we invoke the classic typology (Thompson 1967)) and build upon by Kumar et al. (Kumar, Fenema et al. Forthcoming).
Figure 54: Integration Interdependence versus Reciprocal with Integration Interdependence causing Conway’s Law STSC
In both the eMaxx and Mendix case studies a Conway’s Law STSC was observed among the teams working on different parts of the architecture (Front Office, BPEL and Application Server Teams in the eMaxx case). In both cases, a particular team (BPEL in eMaxx 134
and Workflow server team in Mendix) were situated in different rooms (also in a different floor of the building in the eMaxx case). Hence, the way the development teams were designed resembled the Integration Interdependence typology as seen in the left hand side of Figure 54. But in reality, the teams had reciprocal interdependence with each other owing to the messaging (XML) between the parts of the architecture they were working on. Further, the dependence was also “sticky” (von Hippel 1994) as there was a cost attached to the transfer of information especially as some teams and even team members from the same team were seated in different rooms. The resulting changes done to the different parts of the mid office application architecture, required integration in order to make sure that the different parts work together and is free of major bugs. Thus, this integration of the different changes and the resulting typology of interdependence is Reciprocal with Integration Interdependence typology as shown in the right side of Figure 54. In Figure 54, the rectangles represent the teams working on the different parts of the software system architecture and the arrows represent the flow of tasks. By identifying the Conway’s Law STSC over a period of time in both the Mendix and the eMaxx case studies, we have added a temporal dimension to the concept of identification of coordination problems by Malone and Crowston (Malone and Crowston 1994; Crowston 1997). On having such an understanding of the interdependence typology, the Project Manager(s) can restructure the organization so that the teams are closer in terms of physical proximity. They can also use new and improved Groupware technology to increase and improve the quality of sharing knowledge virtually among team members. 8.1.2 Code Ownership STSC To better understand the Code Ownership STSC identified in the eMaxx case we use the extension to the classical interdependence typology from Kumar et al. (Kumar, Fenema et al. Forthcoming). Ideally, the Code Ownership pattern suggests that a particular developer is assigned or takes the responsibility of a particular software module and this was what the project managers anticipated at eMaxx. This situation requires discussion to split the work, before performing and review along with integration after the changes have been made. This can be described by the ideal integration interdependence typology shown in the left hand side of Figure 55.
135
Figure 55:Non-Sticky Integration Interdependence versus Fully Sticky Integration Interdependence causing the Code Ownership STSC
While, as in the eMaxx case it was seen that there were more instances of collective code ownership at the level of the software application module (packages in .jar file format). Such collective code ownership requires information transfer from the previous developers (who last made the changes to the software application module) to the developers who are currently making the changes. Such information transfer occurs at the beginning of the modification (answering the query of what must be done), during the modifications (answering the query about how can the changes be done) and after the modifications (discussing what has been done). The information transfer is also “sticky” (von Hippel 1994), as the developers did not share the same room, or could have been away for some reason. Thus the actual Interdependence typology resembles the “fully sticky” Integration Interdependence typology (Kumar, Fenema et al. Forthcoming). Like in the previous Conway’s Law STSC, identifying the Code Ownership STSC over a period of time in the eMaxx case study, we have added a temporal dimension to the concept of identification of coordination problems by Malone and Crowston (Malone and Crowston 1994; Crowston 1997). On identifying the Code Ownership STSC, the project manager can restructure the development process in such a way that fewer developers have the responsibility of the software package module or the project can even consider adopting an more Agile development methodology like Extreme Programming (XP) (Nordberg 2003). 8.1.3 Betweenness Centrality Match STSC The Betweenness Centrality Match STSC was observed in the both the commercial case studies (Chapters 5 and 6). This Structure Clash is related to who is in charge of coordinating the project and as a result who decides what the resulting Socio-Technical Network looks like. Due to the nature of the Structure Clash, it is not possible to represent it using 136
Interdependence typology. Thus, we have added another dimension to the purely task and resource concept of Coordination Problem considered by Malone and Crowston (Malone and Crowston 1994; Crowston 1997), by considering the person who is coordinating the project. In the Mendix Case Study (Chapter 5), we saw that the CTO noticed instances where some employees were coordinating the project when someone else had the responsibility or expertise. While in the eMaxx Case Study (Chapter 6), the change in the Betweenness centrality of employees (developers and managers) in four large projects were considered. In each of the projects Betweenness Centrality STSCs were identified based on interviews conducted with the different members of the project. Like in the Conway’s Law STSC and Code Ownership STSC, we also observed the Betweenness Centrality STSC over a period of time in both the Mendix and the eMaxx case studies. We have added a temporal dimension to the concept of identification of coordination problems by Malone and Crowston (Malone and Crowston 1994; Crowston 1997). In the eMaxx case we also found that when some employees or even customers found that no one was taking the responsibility of coordinating the project, took the proactive initiate to coordinate (Chapter 6). In the case of a customer taking the initiative to coordinate, we found that only those customers who had a good technical knowledge of the product as well as the process took such an initiative. Identification of Betweenness Centrality Match STSC can help the Project Manager or Controller identify employees who are not doing the job of coordinating that they are entrusted with, while at the same time also identifying the employees who have taken a proactive responsibility to manage the project. The project manager can then decide if he needs to re-assign the responsibility of coordinating the project and mark the proactive employee for praise.
8.2 STSCs in the Open Source Software Development Cases In the Chapter on Open Source development it was shown how the Open Source development environment differed from Commercial closed source development. Two Patterns were also proposed, namely the Modularity Technical Pattern and the Core-Periphery Shift Socio-Technical Pattern. The patterns were used to identify STSCs in different case studies. 8.2.1 Modularity STSC The Modularity Pattern suggests that when the amount of coupling of the software of an Open Source project increases rapidly across versions, then we have a Modularity STSC. The ideal situation for an Open Source project is where there is minimal coupling and well 137
defined stable interfaces (that do not change regularly) between software modules. Such minimal coupling, as well as well defined stable interfaces between modules reduces the need for coordination among developers. The ideal situation can be represented with the Integration Interdependence typology as shown in the left side of Figure 56. In the figure the rectangles with the circles represent the different actors who are globally distributed and not collocated (as is often the case in Open Source software development).
Figure 56: The existing Fully Sticky Integration Interdependence typology versus the ideal Integration Interdependence typology
On the hand, we see that most Open Source projects can only aspire for such a situation as the coupling between the software modules is not only large but also increases during the course of the project (Chapter 7). Furthermore, the interfaces between different modules are not well defined and keep changing with time. Such a situation can be represented by the fully sticky Integration Interdependence as shown in the right side of Figure 56. A case study of JBoss was conducted (Chapter 7), where the amount and the pattern of distribution of JBoss were monitored during the lifespan of the project. In the case of JBoss, it was seen that the increased coordination requirements due to a sudden increase in software coupling were offset by increased discussion in the JBoss mailing list. A project manager of an Open Source project could constantly monitor the coupling of the software produced in the project, to make sure that it does not increase all of a sudden. When there is such an increase, the manager should make sure that the developers coordinate sufficiently to see to it that the final software release is bug free. 8.2.2 Core-Periphery Shift STSC The Core-Periphery Shift Pattern suggests that a Core-Periphery STSC exists, if all the developers of an Open Source software project move from working on the Core of the software to working on the Periphery and at the same time no developer joins the project or 138
moves to working on the Core then the software project. Given the nature of the STSC, it is not possible to represent it with the help of Interdependence typology diagrams. Thus, in order to represent this one needs to add another dimension to the purely task and resource concept of Coordination Problem considered by Malone and Crowston (Malone and Crowston 1994; Crowston 1997). Like the patterns described earlier the Core-Periphery shift STSC over a period of time in both the Mendix and the eMaxx case studies, we have added a temporal dimension to the concept of identification of coordination problems by Malone and Crowston (Malone and Crowston 1994; Crowston 1997). The Core-Periphery Shift of the different developers could be monitored by the project manager of the Open Source project, in order to make sure there are no occurrences of a Core-Periphery Shift STSC. When the project manager does notice such an STSC, the manager can increase the developer’s interest in the project by suggesting new directions or features, or even advertise for new developers in different forums. In the last chapter (Chapter 9) we revisit the research questions, analyse the limitations of the research and provide ideas for future research.
139
9. Conclusions In the first Chapter we asked three research questions that were later refined in Chapter 3, using the concepts of Socio/Technical Patterns and Socio/Technical Structure Clashes. So here, we consider how the development of the tool and the accompanying method along with the evaluation through the different case studies answers the research questions from Chapter 3. To answer to the first research question, we have developed the TESNA method and tool using the design research methodology (Hevner, March et al. 2004), to identify STSCs. In an answer to the second research question, we have shown from the different case studies (Chapters 5, 6 and 7) how the TESNA method and tool can be used to qualitatively (with the help of network and graph visualisations) as well as quantitatively (with the help of metrics) identify different STSCs. In an attempt to answer the third research question, we found through a secondary analysis of published case studies that the Socio/Technical Patterns that were applicable to commercial closed source software development were not applicable for Open Source software development process (Chapter 7). This motivated us to find patterns that were more applicable to the Open Source domain, thus attempting to answer the final research question, resulting in the Modularity and the Core-Periphery Shift pattern. The case studies also provided a way of validating the patterns and this result is important to the Pattern literature, as not many papers on pattern testing and validation are published. Though there possibly are many more Socio/Technical patterns that are applicable to the closed source or Open Source software development, we think that this research is a starting point for the discussion of how different Socio/Technical Patterns can be used for identifying the corresponding STSCs. Initially, we expected to find STSCs in large commercial software projects and we were surprised to find the presence of STSCs even in small and medium sized companies like Mendix and eMaxx. So, we had expected the size of the project (number of people involved and number of lines of code) to determine the kind of Socio/Technical Patterns that would be applicable to the project. From the different case studies it became evident that the size of the project did not matter much, rather, the coordination mechanisms used in the particular project determined the applicability of certain Socio/Technical Patterns. For example, though the size of the software project at Mendix was small in comparison to eMaxx the same patterns (Conway’s Law STSC and Betweenness Centrality match) were observed in both cases. On the other hand, these patterns are not applicable to the Open Source software development process as shown in Chapter 7, as different coordination mechanisms apply in the Open Source context. Hence, one can conclude that similar Socio/Technical Patterns would be applicable to different software development environments, as long as the same coordination mechanisms are used in those environments.
140
An increasing number of Socio/Technical Patterns are becoming available based on experiences and expert opinions (Petter and Vaishnavi 2007; Zigurs and Khazanchi 2008). These patterns are potentially useful for managing systems development, but it is difficult and labour intensive for the project manager to select appropriate patterns and keep track of their potential violation. Identifying STSCs can prove particularly difficult when multiple people are responsible for various tasks and when the task requirements keep changing in a dynamic and iterative software development environment. In this thesis, we have used the STINs (Kling, McKim et al. 2003; Scacchi 2005) framework to study the Socio-Technical structure in commercial and Open Source project settings. Though as team leader David (from eMaxx case study) suggested, the identification of a STSC does not necessarily mean that a real STSC exists, the presence of a STSC can be considered as one more indication of a potential problem in the Socio/Technical structure of the organization. Further investigation, like looking into other social and technical artefacts in different archives can give further credence to the results.
9.1 Limitations The primary limitation of this research is that, in order to be able to be able to apply the TESNA tool and the method, the Project Manager must have a good understanding of the various Socio/Technical Patterns. The reason for this is that, as the tool and the method are not automated the Project Manager must be able to recognize STSCs during the development process. This process of recognizing STSCs can get complex (even with the help of TESNA tool that reduces complexity), if the Project Manager is responsible for many teams, with each team having a large number of developers. As, in the present implementation of the TESNA method and tool, the Project Manager must decide on (i) which STSC can be identified in the particular view and, (ii) how the STSC can be identified with the given data. Such identification assumes a degree of familiarity with the different Socio/Technical Patterns and their related STSCs. Also, a purely brute force approach of trying to identify a series of STSCs related to Socio/Technical Patterns consumes a fair amount of time and effort and could be infeasible. However, such a brute force method would be possible in an automated setting, though an automated recognition of various STSCs is still a challenge. In such a setting, ideally a Project Manager would like to have an automated system of STSC identification and the TESNA method and tool is just a first step towards such a system. The other limitation is that, some of the metrics used in the case studies, like the CorePeriphery Distance Metric were developed due to the necessity of identifying STSCs and needs further research to establish its usefulness. Though the interviews were beneficial in providing rich qualitative data, it would be beneficial to the Project Manager if there was a 141
system of automatically identifying the social network from the Chat, Bug tracker and eMail server/archives. Furthermore, an automatic analysis of the semantic content of messages would make it easier to identify the messages related to a particular project and topic. Another limitation is that the dependency based clustering algorithm used in this thesis, has the same problems faced by other stochastic clustering algorithms, namely that the clusters are not stable. This means that the size and position of the cluster is dependent on the order of the bidding (Algorithm 1). Also, finding the optimum set of clusters is at least NP-hard so there are no easy solutions. In order to obtain more accurate and stable values for the metrics, the clustering algorithm had to be run multiple times and the resulting values were averaged.
9.2 Threats to Validity As in most case study research, the case studies conducted in this thesis have threats to their validity. Four threats to validity are considered namely: construct validity, content validity, internal validity and external validity. Construct validity addresses the meaningfulness of the results (Nunally and Bernstein 1978). In order to show that a variable has construct validity we need to show that the measurements are consistent with the intuitive ordering of entities with the attribute of interest (Fenton and Pfleeger 1997). Let us consider the construct validity for each of the STSCs found: · Conway’s Law: This identification was based on qualitative data and manual identification. Moreover this identification was carried out in a similar fashion for both the commercial case studies. The way the social network was computed was similar in both the commercial case studies. · Code Ownership: In the eMaxx case study the Core-Periphery Distance Metric (CPDM) was calculated and the values for this metric were important relative to the project. By this we mean that if a developer involved in project had a consistent CPDM of 3.5 while other developers had less than the developer was still the owner of the project. · Betweenness Centrality: As in the case of the CPDM metric the importance of the Betweenness Centrality metric also depends on the relative values held by other developers and managers. · Modularity: The Propagation and Clustered Cost values have been tested in multiple case studies and are good indicators of not only the extent but also the pattern of the modularity of a given software system (MacCormack, Rusnak et al. 2006). · Core-Periphery Shift: In this case the average Core-Periphery Distance Metric (Avg CPDM) was calculated and this value was found to be consistent and varied according to how Core or how Periphery a developer worked in given software project. 142
Content validity refers to the “representativeness or the sampling adequacy of the content” (Kerlinger 1986; Fenton and Pfleeger 1997). Let us consider the content validity of each of the STSCs found in the different case studies: · Conway’s Law: In the commercial case studies, the Social Network was primarily mined from a repository (Chat Server/Bug tracker).Hence, we needed to validate if the network was indeed representative of the technical discussion that the developers and the managers carried out in the project. In order to achieve this, the social network mined from the Chat Server/Bug tracker was cross-checked with the information gathered from the interviews with the developers and mangers. · Code Ownership: In the eMaxx case study, the Code Ownership pattern was applied in the level of the software project. Hence, in order to understand the code ownership at the level of the individual code modules one has to zoom into the clusters and calculate metrics based on how many code modules were modified by whom. This is not currently implemented in the TESNA tool and is also something for future work. · Betweenness Centrality: This metric is an often used metric in the field of Social Networks and has been found to be a good indicator of the extent to which a person takes the charge of coordination in the social network (Hossain, Wu et al. 2006). · Modularity: The Propagation and the Clustered cost have been validated for construct validity in other case studies (MacCormack, Rusnak et al. 2006), and also in this thesis. The metrics taken in combination give a good idea of the extent as well as the pattern of the dependencies (MacCormack, Rusnak et al. 2006). · Core-Periphery Shift: The Average CPDM metric used to identify the CorePeriphery Shift STSC could face challenges in content validity. Especially, when the developers have developed code and other important artefacts using different languages. As the present implementation of the TESNA tool only reads software code written in the Java programming language, the Average CPDM might not reflect the work of all the developers in the project. In identification of both the Conway’s Law and the Betweenness Centrality STSC, the Social Network of the employees is considered. The research presented in this thesis, as in the previous work on identifying the Conway’s Law STSC (Cataldo, Wagstrom et al. 2006; Sosa 2008) quantitatively, have ignored the content and semantics of the messages. What is important to be considered, is whether the communication between the employees really resolves the problems in the dependencies between the software modules or components. Thus, the content and the semantics of the communication messages between employees have to be considered. Furthermore, the Communication Richness (Ngwenyama and Lee 143
1997) of the messages could be taken into account. Communication Richness as defined by Ngwenyama and Lee (1997) (Ngwenyama and Lee 1997) “not only understanding what the speaker or writer means, but the action type associated with the action type enacted by the speaker or writer. The results of the tests enable the listener or reader to identify and analyze distorted communications. By distorted communication we mean communicative acts that are false, incomplete, insincere or unwarranted.” ((Ngwenyama and Lee 1997), p152). Thus, one may con-
sider the Communication Richness in each of the messages sent between the employees of an organization while computing the Social Network of the organization. Internal validity deals with cause and effect relationships. The threat to internal validity is whether “the observed effects could have been caused by or correlated with a set of unhypothesised and/or unmeasured variables” (Straub 1989). This thesis proposes that the use of TESNA method and tool makes it easier for a Project Manager to identify STSCs. So, the independent variable here is the existence or non-existence of our tool and method, while the dependent variable is the possibility of identifying STSCs. There are two main threats to the internal validity: (i) (ii)
Selection Bias: Is that the case studies selected made it easier to identify STSCs History: The experience of Project Managers in dealing with similar cases made the identification of STSCs easier.
In the fist case of selection bias, there is a possibility that the relatively small size of the companies: Mendix and eMaxx made it easier to detect STSCs. This threat is offset by the detection the detection of STSCs in large Open Source project like JBoss and jEdit. Though, in those case studies the person identifying the STSCs is the author of this thesis and this brings us to the second threat of validity, namely, prior experience Project (in the case of the Project Manager) and Tool/Method (in the case of the author of this thesis). This threat to the internal validity is indeed not addressed in this thesis and a more controlled laboratory experiment is required to address this. External validity refers to how well the results of the case study can be generalised beyond the study data. Lee and Baskerville (2003) provide a framework for the different types of generalizability. They provide suggest four different ways of generalizability: (i) (ii) (iii)
Type EE: Generalizing from data to description Type ET: Generalizing from description to theory Type TE: Generalizing from theory to description 144
(iv) Type TT: Generalizing from concepts to theory The research presented in this thesis falls into the category of type ET form of Generalizability. Lee and Baskerville (2003) describe two ways of generalizability involved in a type ET form of generalizability. The two ways being: generalizing from empirical data to theory and generalizing the resulting theory to other domains and samples. In this research we showed how we developed our tool and method from empirical data (Chapter 2). On performing the different case studies and from the resulting empirical data we have come to develop a theory that the detection of STSCs is easier with a method and tool that TESNA provides. This theory is a first step to a type ET form of generalizability(Lee and Baskerville 2003). Regarding the second step of generalizing the resulting theory beyond the sample, Lee and Baskerville state that such generalizability is not feasible. In other words, they state that the theory resulting from empirical data from a case study cannot be generalized beyond the particular case study (Lee and Baskerville 2003). In this context it is interesting to see if the theory is indeed valid in large (commercial) globally distributed settings. Also, it is interesting to see if the theory is valid in different non-Java based Open Source development projects. On the other hand, though the Modularity Socio-Technical Pattern is intuitive and supported in literature (MacCormack, Rusnak et al. 2006), more research is required to verify the concepts behind the Modularity Socio-Technical Pattern. This is primarily since in the case study described in Chapter 7 only a proper application of the Modularity Pattern was found instead of a Modularity STSC. Future research should be able to test the pattern in many other Open Source projects in order to verify if it is indeed possible to easily identify the Modularity STSC.
9.3 Contributions The research presented in this thesis is based on the Socio-Technical Interaction Networks (STINs) framework. It further builds on the work of Coordination Theory of Malone and Crowston (Malone and Crowston 1994) and Crowston (Crowston 1997) by providing a method and tool to identify specific coordination problems or Socio/Technical Structure Clashes (STSCs). 9.3.1 Contributions to Research The thesis addresses the important question of how a software development manager can identify Coordination Problem in his project (or in the company in general). The approach taken to answering this question is by first narrowing and refining the research problem to specific coordination problems. We define Socio/Technical Patterns that can be used to identify different specific Coordination Problems that we call Socio/Technical Structure 145
Clashes. These Socio/Technical Structure Clashes can alternately (from the definition in Chapter 3) be defined to occur when the actual social network of the software development team and/or the technical dependencies within the software architecture under development represents the specific coordination problem for which a Socio/Technical Pattern solution can be applied. We have extended the concept of Coordination problem by considering Coordination problems over time and beyond the static concepts of tasks and resources as suggested by Malone and Crowston (Malone and Crowston 1994) and later by Crowston (Crowston 1997). We have identified STSCs related to all the Socio/Technical Patterns considered in this thesis over a period of time. We have also included the Coordination problem of who is coordinating (Betweenness Centrality STSC) and who is working on which part of the source code resource (Core-Periphery shift STSC). Second, in order to answer the research problem literature from diverse fields like Organization Theory (Coordination Theory), Production Engineering (DSM), CSCW (SocioTechnical Congruence) and Software Engineering (Organizational and Process Patterns) were analysed and combined. This combination of concepts and ideas from different fields in order to solve the research problem is contribution in itself. Third, we have identified and validated new Socio/Technical Patterns taken from different literature sources. In the commercial software development domain, we have identified the Betweenness Centrality match pattern, while in the Open Source software development domain we have identified the Modularity and the Core-Periphery Shift patterns. Fourth, the primary research contributions of this thesis are the tool TESNA and the accompanying method that can be used to identify STSCs in commercial as well as Open Source software development processes. We have followed the Design Research methodology (Hevner, March et al. 2004) to guide in the development of the TESNA method and tool. Fifth and finally, in the different case studies we have validated the tool TESNA and the method for identifying STSCs. We have thus shown how STSCs can be identified in different commercial as well as Open Source projects. 9.3.2 Contributions to Practice This research has some important contributions for software project leaders and managers in both the commercial closed source and the Open Source software development domains. Software project leaders and managers can learn about the different specific coordination problems (STSCs) related to Socio/Technical Patterns. Awareness of the problem is the first step in order to solve such problems. Consequently, software project leaders can learn about the TESNA method and tool that can be used to identify specific Coordination Problems (STSCs) in their companies. They
146
can also learn how to identify the STSCs related to the Socio/Technical Patterns that are dealt with in this thesis. They can gain insights into what they can do to avoid such Coordination Problems (from the discussion in Chapter 8). Open Source project leaders can gain from the understanding that Socio/Technical Patterns (studied in this thesis), that apply to commercial closed source development are not very relevant to their project. Instead, Open Source project leaders can understand the specific coordination problems (STSCs) related to the Socio/Technical patterns that are more applicable to their environment.
9.4 Future Work Future work can concentrate on different techniques to identify technical dependencies at different levels, for example at the code level, at the level of the architecture and at the level of work flow. Through the investigation of different dependencies, we can gain insights into different possible STSCs. We have found that dependencies due to the code structure are more applicable to larger commercial software development organizations. Future research on large developments projects can explore the possibilities of finding the occurrences of different STSCs in such development environments. The study of middle and large software development organizations and inter-organisational development in globally distributed settings to identify the presence of STSCs can be conducted. It would be interesting to compare the Open Source software development process to a commercial closed source globally distributed software process, in order to examine the differences between corporate globally distributed STSCs and Open Source STSCs. Apart from using this technique to validate new and existing Socio/Technical patterns, future research could also focus on different predictors of STSCs rather than study the outcome of the collaboration to identify STSCs, as we have done in this research. We can also study first and later include the actions; managers take, when they encounter an STSC, to the TESNA method. What is particularly interesting is whether Managers use the solutions to the STSCs, as suggested by the Socio/Technical Patterns. One of the main limitations of the TESNA method and tool involves social networks, namely that of easily and effectively identifying the semantic content of eMail or Chat messages without human intervention (thus reducing privacy issues). In order to address this, an automated mining system that identifies key patterns in the messages can be developed in the future as attempted in the Conversation Map software(Sack 2000). Also, as discussed earlier in the Limitations section, one of the prerequisites of applying the TESNA method is a good understanding of the Socio/Technical Patterns. In order to eliminate this need for human intervention, one needs to automate the identification process for the different STSCs. In the case of the Conway’s Law and Code Ownership STSCs this might 147
involve quite straightforward matrix algebra. Although, carrying out the Matrix computations in real time taking into account the semantics of developer dependencies and of the communication messages could involve some fuzzy logic reasoning. There are couple of ways of performing this including using machine learning algorithms along with graph rewriting (especially for Socio-Technical patterns). The development of a suite or repository of Socio/Technical patterns similar to Portland Pattern Repository (PPR Retrieved 1st August 2008) would be useful for future research and for an elaborate testing of the TESNA method and tool. The TESNA method and tool can also be used in the outsourcing of knowledge work, as long as the dependencies between the various artefacts are made explicit and there is a product architecture that can be analysed. We are currently working on a serious gaming simulation environment that utilizes the data from the case studies described in this thesis. The aim of this simulation environment is to enable project managers gain familiarity with the different Socio/Technical Patterns and thereby increase their ability for identifying STSCs in various network displays.
148
References (2008). "Best of open source platforms and middleware." from http://www.infoworld.com/slideshow/2008/08/171-best_of_open_so-3.html. (2008). "Senior Scholars' Basket of Journals." from http://home.aisnet.org/displaycommon.cfm?an=1&subarticlenbr=346. Acuna, S. T. and N. Juristo (2005). Software Process Modeling, Springer. Alexander, C., S. Ishikawa, et al. (1977). A Pattern Language. New York. Amrit, C. (2005). "Coordination in software development: the problem of task allocation." ACM SIGSOFT Software Engineering Notes 30(4): 1-7. Amrit, C., J. H. Hegeman, et al. (2007). Exploring Coordination Structures in Open Source Software Development. 1st Workshop on Tools for Managing Globally Distributed Software Development, Munich, ICGSE 2007, Centre for Telematics and Information Technology (CTIT). Amrit, C. and J. Van Hillegersberg (2007). Mapping Social Network to Software Architecture to Detect Structure Clashes in Agile Software Development. European Conference on Information Systems. Amrit, C. and J. van Hillegersberg (2007). Matrix Based Problem Detection in the Application of Software Process Patterns. ICEIS 2007, INSTICC. Amrit, C. and J. van Hillegersberg (2008). "Detecting Coordination Problems in Collaborative Software Development Environments." Information Systems Management 25(1): 57 - 70. Amrit, C., J. van Hillegersberg, et al. (2004). A Social Network approach to Software Development. In CSCW'04 Workshop on Social Networks. Baddeley, A. (1994). "The magical number seven: Still magic after all these years." Psychological Review 101(2): 353-356. Baldwin, T. T., M. D. Bedell, et al. (1997). "The Social Fabric of a Team-Based M.B.A. Program: Network Effects on Student Satisfaction and Performance." The Academy of Management Journal 40(6): 1369-1397. Basili, V. R., R. W. Selby, et al. (1986). "Experimentation in software engineering." IEEE Trans. Softw. Eng. 12(7): 733-743. Bezroukov, N. (1999). "A Second Look at the Cathedral and the Bazaar." Bird, C., A. Gourley, et al. (2006). "Mining email social networks." Proceedings of the 2006 international workshop on Mining software repositories: 137-143. Bird, C., A. Gourley, et al. (2006). Mining email social networks in Postgres. Proceedings of the 2006 international workshop on Mining software repositories. Shanghai, China, ACM. Boehm, B. (2000). "Unifying software engineering and systems engineering." Computer 33(3): 114-116. Borgatti, S. P. and M. G. Everett (1999). "Models of core/periphery structures." Social Networks 21: 375-395. Borgatti, S. P. and M. G. Everett (2000). "Models of core/periphery structures." Social Networks 21: 375-395. Brooks, F. P. (1987). "No Silver Bullet: Essence and Accidents of Software Engineering." IEEE Computer 20(4): 10-19. 149
Burt, R. (1992). Structural holes: the social structure of competition, Harvard University Press. Cataldo, M., P. Wagstrom, et al. (2006). Identification of coordination requirements: implications for the Design of collaboration and awareness tools. Proceedings of the 2006 20th anniversary conference on Computer supported cooperative work. Banff, Alberta, Canada, ACM Press. Christley, S. and G. Madey (2007). "Global and Temporal Analysis of Social Positions at SourceForge. net." Third International Conference on Open Source Systems, IFIP WG 2. Conway, M. (1968). How do Committees Invent. Datamation. 14: 28-31. Coplien, J., O (1994). A Development Process Generative Pattern Language. Proceedings of PLoP/94. Monticello, Il.: 1--33. Coplien, J., O. and N. Harrison, B. (2004). Organizational Patterns of Agile Software Development. Upper Saddle River, NJ, USA. Coplien, J. O. and D. C. Schmidt (1995). Pattern languages of program design. New York, NY, USA. Crowston, K. (1997). "A Coordination Theory Approach to Organizational Process Design." Organization Science 8(2): 157-175. Crowston, K. and J. Howison (2003). "The social structure of open source software development teams." OASIS 2003 Workshop (IFIP 8.2 WG). Crowston, K. and J. Howison (2006). "Assessing the health of open source communities." Computer 39(5): 89-91. Crowston, K., J. Howison, et al. (2006). "Information systems success in free and open source software development: theory and measures." Software Process Improvement and Practice 11(2): 123-148. Crowston, K., K. Wei, et al. (2006). "Core and periphery in Free/Libre and Open Source software team communications." Proceedings of the 39th Annual Hawaii International Conference on Systems Sciences. Crowston, K., K. Wei, et al. (2006). "Core and periphery in Free/Libre and Open Source software team communications." Proceedings of the 39th Annual Hawaii International Conference on System Sciences-Volume 06. Cummings, J. N. and R. Cross (2003). "Structural properties of work groups and their consequences for performance." Social Networks 25: 197-210. Curtis, B., H. Krasner, et al. (1988). "A Field-Study of the Software-Design Process for Large Systems." Communications of the Acm 31(11): 1268-1287. de Souza, C., R. B., J. Froehlich, et al. (2005). Seeking the source: software source code as a social and technical artifact. GROUP '05: Proceedings of the 2005 international ACM SIGGROUP conference on Supporting group work. New York, NY, USA: 197--206. de Souza, C., R. B., D. Redmiles, et al. (2004). Sometimes you need to see through walls: a field study of application programming interfaces. CSCW '04: Proceedings of the 2004 ACM conference on Computer supported cooperative work. New York, NY, USA: 63--71. Dinh-Trong, T. T. and J. M. Bieman (2005). "The FreeBSD Project: A Replication Case Study of Open Source Development." IEEE TRANSACTIONS ON SOFTWARE ENGINEERING: 481-494. 150
Ducheneaut, N. (2005). "Socialization in an Open Source Software Community: A SocioTechnical Analysis." Computer Supported Cooperative Work (CSCW) 14(4): 323368. Emery, F. E. and E. L. Trist (1960). "Socio-technical systems." Management Science, Models and Techniques 2: 83-97. Eppinger, S. D., D. E. Whitney, et al. (1994). "A model-based method for organizing tasks in product development." Research in Engineering Design 6(1): 1-13. Faraj, S. and L. Sproull (2000). "Coordinating Expertise in Software Development Teams." Management Science 46(12): 1554-1568. Fenema, P. C. v. (2002). Coordination and Control of Globally Distributed Software Projects. LIS. Rotterdam, Erasmus University. PhD. Fenton, N. and S. L. Pfleeger (1997). Software metrics: a rigorous and practical approach, PWS Publishing Co. Boston, MA, USA. Fernandez, C. I. G. (1998). "Integration Analysis of Product Architecture to Support Effective Team Co-location." ME thesis, MIT, Cambridge, MA. Fielding, R. T. (1999). "Shared leadership in the Apache project." Communications of the Acm 42(4): 42-43. Fowler, M. (1997). Analysis Patterns: Reusable Object Models. Reading MA. Freeman, L. C. (1977). "A Set of Measures of Centrality Based on Betweenness." Sociometry 40(1): 35-41. Freeman, L. C., D. Roeder, et al. (1979). Centrality in Social Networks II: Experimental Results, School of Social Sciences, University of California. Froehlich, J. and P. Dourish (2004). Unifying Artifacts and Activities in a Visual Tool for Distributed Software Development Teams. ICSE '04: Proceedings of the 26th International Conference on Software Engineering. Washington, DC, USA: 387-396. Gall, H., K. Hajek, et al. (1998). "Detection of logical coupling based on product release history." Proceedings of the International Conference on Software Maintenance: 190–198. Gallivan, M. J. (2001). "Striking a balance between trust and control in a virtual organization: a content analysis of open source software case studies." Information Systems Journal 11(4): 277-304. Gamma, E., R. Helm, et al. (1995). Design Patterns: Elements of Resuable Object Oriented Software. MA. German, D. M. (2003). "The GNOME project: a case study of open source, global software development." Software Process Improvement and Practice 8(4): 201-215. Gero, J. S. (1990). "Design Prototypes: A Knowledge Representation Schema for Design." AI Magazine 11(4): 26-36. Grinter, R., E. (1998). Recomposition: putting it all back together again. CSCW '98: Proceedings of the 1998 ACM conference on Computer supported cooperative work. New York, NY, USA: 393--402. Grinter, R., E. , J. D. Herbsleb, et al. (1999). The geography of coordination: dealing with distance in R&D work. Proceedings of the international ACM SIGGROUP conference on Supporting group work. Phoenix, Arizona, United States, ACM Press.
151
Guo, G., Yanbing, J. Atlee, M., et al. (1999). A Software Architecture Reconstruction Method. WICSA1: Proceedings of the TC2 First Working IFIP Conference on Software Architecture (WICSA1). Deventer, The Netherlands, The Netherlands: 15--34. Hegeman, J. H. (2007). Towards a Comprehensible Representation of Software Development Tasks. Twente Student Conference, University of Twente. Herbsleb, J., M. Cataldo, et al. (2008). Socio-technical congruence (STC 2008). Companion of the 30th international conference on Software engineering. Leipzig, Germany, ACM. Herbsleb, J., D. and R. Grinter, E. (1999). Splitting the organization and integrating the code: Conway's law revisited. ICSE '99: Proceedings of the 21st international conference on Software engineering. Los Alamitos, CA, USA: 85--95. Herbsleb, J., D. and R. Grinter, E. (1999a). Architectures, Coordination, and Distance: Conway's Law and Beyond. IEEE Software. Los Alamitos, CA, USA. 16: 63--70. Herbsleb, J., D. Zubrow, et al. (1997). "Software quality and the Capability Maturity Model." Communications of the Acm 40(6): 30-40. Herraiz, I., G. Robles, et al. (2006). "The processes of joining in global distributed software projects." Proceedings of the 2006 international workshop on Global software development for the practitioner: 27-33. Hevner, A., R., S. March, T., et al. (2004). Design Science in Information Systems Research. MIS Quarterly. 28. Hossain, L., A. Wu, et al. (2006). Actor centrality correlates to project based coordination. Proceedings of the 2006 20th anniversary conference on Computer supported cooperative work. Banff, Alberta, Canada, ACM Press. Howison, J., K. Inoue, et al. (2006). "Social dynamics of free and open source team communications." Proceedings of the IFIP 2nd International Conference on Open Source Software, Lake Como, Italy. Hunt, A. and D. Thomas (2002). "Software archaeology." Software, IEEE 19(2): 20-22. Initiative, O. S. (Retrieved 1st August 2008). "Open Source Initiative." from http://opensource.org/. Institute, T. "The Tavistock Institute." from http://www.tavinstitute.org/. JavaSVN. (Retrieved 1st August 2008). "JavaSVN." from http://svnkit.com/. Jensen, C. and W. Scacchi (2005). "Collaboration, Leadership, Control, and Conflict Negotiation in the Netbeans. org Community." Proceedings of the 38th Annual Hawaii International Conference on System Sciences (HICSS 05), page 196b. Jensen, C. and W. Scacchi (2007). "Role Migration and Advancement Processes in OSSD Projects: A Comparative Case Study." Proceedings of the 29th International Conference on Software Engineering: 364-374. Jorgensen, N. (2001). "Putting it all in the trunk: incremental software development in the FreeBSD open source project." Information Systems Journal 11(4): 321-336. JUNG. "Java Universal Network/Graph Framework." from http://jung.sourceforge.net/. Kaplan, B. and D. Duchon (1988). "Combining Qualitative and Quantitative Methods in Information Systems Research: A Case Study." Management Information Systems Quarterly 12(1): 31. Kazman, R. (1998). Assessing architectural complexity. Software Maintenance and Reengineering, European Conference on. 152
Kazman, R. and S. J. Carriere (1998). View extraction and view fusion in architectural understanding, IEEE Computer Society Washington, DC, USA. Kerlinger, F. N. (1986). Foundations of Behavioral Research, Holt, Rinehart and Winston. Kling, R., G. W. McKim, et al. (2003). "a Bit More to It: Scholarly Communication Forums as Socio-technical Interaction Networks." JASTIS 54(1): 47-67. Kling, R. and W. Scacchi (1980). "Computing as Social Action: The Social Dynamics of Computing in Complex Organizations." Advances in Computers 19: 249-327. Krackhardt, D. and K. M. Carley (1998). PCANS Model of Structure in Organizations, Carnegie Mellon University, Institute for Complex Engineered Systems. Kraut, R., E. and L. Streeter, A. (1995). Coordination in software development. Commun. ACM. New York, NY, USA. 38: 69--81. Kruchten, P. (1998). The Rational Unified Process, An Introduction. Massachusetts. Kumar, K. and H. G. Diesel (1996). "Sustainable Collaboration: Managing Conflict and Cooperation in Interorganizational Systems." MIS Quarterly 20(3): 279-300. Kumar, K., P. C. v. Fenema, et al. (Forthcoming). "Offshoring and the Global Distribution of Work: Implications for Task Interdependence Theory and Practice." Journal of International Business Studies. Kumar, K., P. C. van Fenema, et al. (2005). "Intense Collaboration in Globally Distributed Work Teams: Evolving Patterns of Dependencies and Coordination." Managing Multinational Teams: Global Perspectives. Lakhani, K. R. and R. G. Wolf (2005). "Why Hackers Do What They Do: Understanding Motivation and Effort in Free/Open Source Software Projects." Perspectives on Free and Open Source Software. Latour, B. (1987). Science in Action: How to follow Scientists and Engineers through society, Harvard University Press. LaToza, T. D., G. Venolia, et al. (2006). Maintaining mental models: a study of developer work habits, ACM New York, NY, USA. Lee, A. S. and R. L. Baskerville (2003). "Generalizing Generalizability in Information Systems Research." Information Systems Research 14(3): 221-243. Lee, G. K. and R. E. Cole (2003). "From a Firm-Based to a Community-Based Model of Knowledge Creation: The Case of the Linux Kernel Development." Organization Science 14(6): 633. Lerner, J. and J. Tirole (2002). "Some Simple Economics of Open Source." Journal of Industrial Economics 50(2): 197-234. Li, B., Y. Zhou, et al. (2005). Matrix-based component dependence representation and its applications in software quality assurance. ACM SIGPLAN Notices. New York, NY, USA. 40: 29--36. Lindvall, M. and D. Muthig (2008). "Bridging the Software Architecture Gap." Computer: 98-101. Lonchamp, J. (1998). Process Model Patterns for Collaborative Work. Proc. of the 15th IFIP World Computer Congress, Telecooperation Conference, Telecoop. López-Fernández, L., G. Robles, et al. (2006). "Applying Social Network Analysis Techniques to Community-Driven Libre Software Projects." International Journal of Information Technology and Web Engineering 1(3).
153
MacCormack, A., J. Rusnak, et al. (2006). "Exploring the structure of complex software designs: An empirical study of open source and proprietary code." Management Science 52(7): 1015-1030. Madadhain, J. O., D. Fisher, et al. (2005). The JUNG (Java Universal Network/Graph) Framework. Technical Report UCI-ICS 03-17 University of California, Irvine. Malone, T. W. and K. Crowston (1994). "The interdisciplinary study of coordination." ACM Comput. Surv. 26(1): 87-119. Malone, T. W., K. Crowston, et al. (1999). "Tools for Inventing Organizations: Toward a Handbook of Organizational Processes." Management Science 45(3): 425-443. March, S., A. Hevner, et al. (2000). "Research Commentary: An Agenda for Information Technology Research in Heterogeneous and Distributed Environments." Information Systems Research 11(4): 327-341. March, S. T. and G. F. Smith (1995). "Design and natural science research on information technology." Decision Support Systems 15(4): 251-266. Miles, M. B. and A. M. Huberman (1984). Qualitative data analysis, Sage Publications Beverly Hills. Miller, G. A. (1956). "The magical number seven, plus or minus two: some limits on our capacity for processing information." Psychological Review 63(2): 81-97. Mockus, A., R. O. Y. T. Fielding, et al. (2002). "Two Case Studies of Open Source Software Development: Apache and Mozilla." ACM Transactions on Software Engineering and Methodology 11(3): 309-346. Moody, D. (2007). "What Makes a Good Diagram? Improving the Cognitive Effectiveness of Diagrams in IS Development." Advances in Information Systems Development; New Methods and Practice for the Networked Society. Moody, D. L. and A. Flitman (1999). A Methodology for Clustering Entity Relationship Models - A Human Information Processing Approach. Proceedings of the 18th International Conference on Conceptual Modeling, Springer-Verlag. Moon, J. Y. and L. Sproull (2002). "Essence of Distributed Work: The Case of the Linux Kernel." Distributed Work: 381-404. Morelli, M. D., S. D. Eppinger, et al. (1995). "Predicting technical communication in product development organizations." Engineering Management, IEEE Transactions on 42(3): 215-222. Mullen, B., C. Johnson, et al. (1991). "Effects of communication network structure: Components of positional centrality." Social Networks 13(2): 169-185. Murphy, G., C. , D. Notkin, et al. (2001). Software Reflexion Models: Bridging the Gap between Design and Implementation. IEEE Trans. Softw. Eng. Piscataway, NJ, USA. 27: 364-380. Murphy, G., C. and D. Notkin (1996). "Lightweight lexical source model extraction." ACM Trans. Softw. Eng. Methodology 5(3): 262-292. Nakakoji, K., Y. Yamamoto, et al. (2002). Evolution patterns of open-source software systems and communities. Proceedings of the International Workshop on Principles of Software Evolution: 76-85. Ngwenyama, O., K. and A. Lee, S. (1997). Communication richness in electronic mail: critical social theory and the contextuality of meaning. MIS Q. Minneapolis, MN, USA. 21: 145--167. Nordberg, M. E., III (2003). "Managing code ownership." Software, IEEE 20(2): 26-33. 154
Novick, L. R. and S. M. Hurley (2001). "To Matrix, Network, or Hierarchy: That Is the Question." Cognitive Psychology 42(2): 158-216. Nunally, J. C. and I. H. Bernstein (1978). Psychometric Theory, New York: McGraw-Hill. O'Reilly, T. (1999). "Lessons from open-source software development." Commun. ACM 42(4): 32-37. O’Madadhain, J., D. Fisher, et al. (2003). "The JUNG (Java Universal Network/Graph) Framework." University of California, Irvine, California. Osborn, C. S. (1993). Field Data Collection for the Process Handbook. Process Handbook. Cambridge MA, MIT Center for Coordination Science. Ovaska, P., M. Rossi, et al. (2003). "Architecture as a coordination tool in multi-site software development." Software Process: Improvement and Practice 8(4): 233247. Parnas, D. L. (1972). On the criteria to be used in decomposing systems into modules. Commun. ACM. New York, NY, USA. 15: 1053--1058. Paulson, J. W., G. Succi, et al. (2004). "An Empirical Study of Open-Source and ClosedSource Software Products." IEEE TRANSACTIONS ON SOFTWARE ENGINEERING: 246-256. Pentland, B. T. (1999). "Useful descriptions of organizational processes: collecting data for the process handbook." Petter, S. and V. Vaishnavi (2007). "Facilitating experience reuse among software project managers." Information Sciences. Pettey, C. (2008). "Gartner Says Increased Disruption Lies Ahead for Operating System Software Market." from http://www.gartner.com/it/page.jsp?id=673308. PPR. (Retrieved 1st August 2008). "Portland Pattern Repository." from http://c2.com/ppr/. Raymond, E. (1999). "The Cathedral and the Bazaar." Knowledge, Technology, and Policy 12(3): 23-49. Raymond, E. S. (1998). "Homesteading the Noosphere." First Monday 3(10). Reich, Y. (1995). "A critical review of General Design Theory." Research in Engineering Design 7(1): 1-18. Rigby, P. C., D. M. German, et al. (2008). "Open source software peer review practices: a case study of the apache server." Proceedings of the 13th international conference on Software engineering: 541-550. Robert, L. P., A. R. Dennis, et al. (2008). "Social capital and knowledge integration in digitally enabled teams." Information Systems Research 19(3): 314-334. Sack, W. (2000). "Conversation Map: An Interface for Very Large-Scale Conversations." Journal of Management Information Systems 17(3): 73-92. Saracevic, T. (1995). "Evaluation of evaluation in information retrieval." Proceedings of the 18th annual international ACM SIGIR conference on Research and development in information retrieval: 138-146. Scacchi, W. (2004). "Socio-technical design." The Encyclopedia of Human-Computer Interaction. Berkshire Publishing Group: 656-659. Scacchi, W. (2005). "Socio-Technical Interaction Networks in Free/Open Source Software Development Processes." Software Process Modeling: 1-27. Schach, S. R., B. Jin, et al. (2002). "Maintainability of the Linux kernel." Software, IEE Proceedings-[see also Software Engineering, IEE Proceedings] 149(1): 18-23. Schmidt, D., M. Fayad, et al. (1996). Software Patterns. Commun. ACM. 39: 37-39. 155
Scott, J. (2000). Social Network Analysis: a handbook, Sage Publications Inc. Seidman, S. B. (1981). "Structures induced by collections of subsets: A hypergraph approach." Mathematical Social Sciences 1: 381-396. Sosa, M. E. (2008). "A structured approach to predicting and managing technical interactions in software development." Research in Engineering Design 19(1): 4770. Sosa, M. E., S. D. Eppinger, et al. (2002). "Factors that influence technical communication in distributedproduct development: an empirical study in the telecommunicationsindustry." Engineering Management, IEEE Transactions on 49(1): 45-58. Sosa, M. E., S. D. Eppinger, et al. (2003). "Identifying Modular and Integrative Systems and Their Impact on Design Team Interactions." Journal of Mechanical Design 125: 240. Sosa, M. E., S. D. Eppinger, et al. (2004). "The Misalignment of Product Architecture and Organizational Structure in Complex Product Development." J Manage. Sci. 50(12): 1674-1689. Sourceforge. (2003). "Project of the Month." from http://sourceforge.net/potm/potm-200304.php. Sourceforge. (Retrieved 1st August 2008). "Sourceforge.net." from http://sourceforge.net/. Sparrowe, R. T., R. C. Liden, et al. (2001). "Social networks and the performance of individuals and groups." Academy of Management Journal 44(2): 316-325. Steven, D. E., E. W. Daniel, et al. (1994). "A model-based method for organizing tasks in product development." Research in Engineering Design V6(1): 1-13. Steward, D. (1981). "The design structure system: a method for managing the design of complex systems." IEEE Transactions on Engineering Management 28(3): 71-74. Steward, D. V. (1965). "Partitioning and tearing systems of equations." SIAM J. Numer. Anal 2(2): 345-365. Stewart, G. L. and M. R. Barrick (2000). "Team Structure and Performance: Assessing the Mediating Role of Intrateam Process and the Moderating Role of Task Type." The Academy of Management Journal 43(2): 135-148. Straub, D. W. (1989). "Validating instruments in MIS research." MIS Quarterly 13(2): 147169. Sullivan, K., J., W. Griswold, G., et al. (2001). The structure and value of modularity in software design. Proceedings of the 8th European software engineering conference held jointly with 9th ACM SIGSOFT international symposium on Foundations of software engineering, Vienna, Austria, ACM Press. Survey, W. S. (2008 ). "June 2008 Web Server Survey." from http://news.netcraft.com/archives/web_server_survey.html. Tessier, J. "Dependency Finder." from http://depfind.sourceforge.net/. Thompson, J. D. (1967). Organizations in Action: Social Science Bases of Administrative Theory, Transaction Publishers. Tracker, M. B. (Retrieved 1st August 2008). "Mantis Bug Tracker." from http://www.mantisbt.org/. Ven, A. H. V. D., A. L. Delbecq, et al. (1976). "Determinants of Coordination Modes within Organizations." American Sociological Review 41(2): 322-338.
156
Vessey, I. and R. Glass (1998). "Strong vs. weak approaches to systems development." Communications of the Acm 41(4): 99-102. Vokurka, R. J., J. Choobineh, et al. (1996). "A prototype expert system for the evaluation and selection of potential suppliers." INTERNATIONAL JOURNAL OF OPERATIONS AND PRODUCTION MANAGEMENT 16: 106-127. von Hippel, E. (1994). ""Sticky information" and the locus of problem solving: implications for innovation." Manage. Sci. 40(4): 429-439. von Krogh, G., S. Spaeth, et al. (2003). "Community, joining, and specialization in open source software innovation: a case study." Research Policy 32(7): 1217-1241. Wagstrom, P. and J. Herbsleb, D. (2006). Dependency forecasting in the distributed agile organization. Commun. ACM. New York, NY, USA. 49: 55--56. Warshall, S. (1962). "A Theorem on Boolean Matrices." Journal of the ACM (JACM) 9(1): 11-12. Wasserman, S. and K. Faust (1994). Social Network Analysis: methods and applications, Cambridge University Press. Wong, K., S. R. Tilley, et al. (1995). "Structural redocumentation: a case study." Software, IEEE 12(1): 46-54. Woods, S. and Q. Yang (1998). "Program Understanding as Constraint Satisfaction: Representation and Reasoning Techniques." Automated Software Engineering 5(2): 147-181. Xu, J., Y. Gao, et al. (2005). "A Topological Analysis of the Open Souce Software Development Community." System Sciences, 2005. HICSS'05. Proceedings of the 38th Annual Hawaii International Conference on: 198a-198a. Yamauchi, Y., M. Yokozawa, et al. (2000). "Collaboration with Lean Media: how opensource software succeeds." Proceedings of the 2000 ACM conference on Computer supported cooperative work: 329-338. Yang, H.-L. and J.-H. Tang (2004). Team structure and team performance in IS development: a social network perspective. Information and Management. Amsterdam, The Netherlands, The Netherlands. 41: 335--349. Ye, Y. and K. Kishida (2003). "Toward an understanding of the motivation of open source software developers." Proceedings of the 25th international conference on Software engineering, Portland, Oregon, IEEE Computer Society: 419-429. Yin, R. K. (2003). Case Study Research: Design and Methods, Sage Publications Inc. Yoshikawa, H. (1981). "GENERAL DESIGN THEORY AND A CAD SYSTEM." ManMachine Communication in CAD/CAM: Proceedings of the Ifip Wg5. 2-5.3 Working Conference Held in Tokyo, Japan, 2-4 October 1980. Yu, L., S. R. Schach, et al. (2006). "Maintainability of the kernels of open-source operating systems: A comparison of Linux with FreeBSD, NetBSD, and OpenBSD." The Journal of Systems & Software 79(6): 807-815. Zelkowitz, M. V. and D. R. Wallace (1998). "Experimental Models for Validating Technology." Computer: 23-31. Zigurs, I. and D. Khazanchi (2008). "From Profiles to Patterns: A New View of TaskTechnology Fit." Information Systems Management 25(1): 8-13.
157
About the Cover
The cover photo3,4 has been modified to create an illusion of looking through a glass screen. The glass screen alludes to the fictional glass door of the cabin in which a software development manager sits. The cover photo refers to the manager’s hazy and unclear perspective of the software development team and process. Such a manager is isolated from developers and unaware of their coordination difficulties and coordination problems. This is one of the typical scenarios in large software development organizations addressed by the TESNA method and tool, developed as part of the research leading to this thesis.
3
Courtesy of Prof Dr Frank Harmsen
4
It was taken at one of Capgemini’s facilities in Mumbai, India
158
Summary in English Today’s dynamic and distributed development environment brings significant challenges for software project management. In distributed project settings, “management by walking around” is no longer an option, and project managers may miss out on key project insights. At the same time, the high coordination requirements caused by the dynamic distributed environment can cause many coordination difficulties and can even lead to coordination breakdowns. In response to some of these problems, researchers have developed detailed patterns for describing the preferred relationships between the team communication structure (the social network) and the technical software architecture. We call such patterns Socio-Technical Patterns. As they capture a wide variety of knowledge and experience Socio, Technical and Socio-Technical Patterns (or Socio/Technical Patterns in short) are potentially very useful for the project manager in planning and monitoring complex development projects. However, these patterns are hard to implement and monitor in practice. The reason behind this is that it is difficult to find coordination problems in order to apply the solutions provided by the Socio/Technical Patterns, as purely manual techniques are labour intensive. Especially within dynamic and iterative distributed environments, the use of Socio/Technical Patterns is challenging. But, even in small companies, employing between 20 and 50 developers (ref Chapter 5 and 6), the social network and the relation to the software tasks can get quite complicated for the software manager to track. As part of the TESNA (TEchnical Social Network Analysis) project, we have developed a method and a tool that a project manager can use in order to identify specific coordination problems that we call Socio/Technical Structure Clashes (STSCs). We have evaluated the TESNA method and tool in two commercial case studies (Chapters 5 and 6) and multiple case studies in the Open Source development environment (Chapter 7).
159
Summary in Dutch Softwareontwikkelingsomgevingen zijn tegenwoordig steeds vaker globaal gedistribueerd en dynamisch van aard. Dit brengt grote uitdagingen met zich mee voor projectleiders van softwareontwikkelingstrajecten. In gedistribueerde projectomgevingen, is “managing by walking around” geen optie. Projectleiders met een dergelijke managementmethode belangrijke projectinformatie en -inzichten over het hoofd zien. Tegelijkertijd kunnen de hoge coördinatievereisten, welke gepaard gaan met complexe gedistribueerde softwareontwikkeling, leiden tot coördinatieproblemen die soms ernstige vormen kunnen aannemen. Om dergelijke problemen tegen te gaan hebben onderzoekers gedetailleerde patronen ontwikkeld voor het beschrijven van de ideale samenhang tussen de communicatiestructuur van teams (het sociale netwerk) en de technische softwarearchitectuur. Dergelijke patronen worden ook wel Socio-Technische Patronen genoemd. Aangezien dergelijke patronen een grote verscheidenheid aan kennis en ervaring omvatten, kunnen Socio, Technische en Socio-Technische Patronen (ook wel kortweg Socio/Technische Patronen genoemd) potentieel erg bruikbaar zijn ter ondersteuning van projectmanagers bij planning en beheer van complexe ontwikkelingsprojecten. Deze patronen zijn in de praktijk echter moeilijk implementeerbaar en ook moeilijk te monitoren. De reden hiervoor is dat het detecteren van coördinatieproblemen, waarop de Socio/Technische patronen toegepast kunnen worden, nog puur handwerk is en daarom zeer arbeidsintensief. Juist binnen dynamische, iteratieve gedistribueerde omgevingen is het gebruik van Socio/Technische Patronen extra complex. Echter, zelfs bij relatief kleine organisaties, met tussen de 20 en 50 ontwikkelaars, (zie hoofdstuk 6 en 7) is het voor de softwaremanager al erg lastig om de (relaties tussen) sociale netwerken en softwaretaken te beheren en indien nodig bij te sturen. Dit proefschrift beschrijft het TESNA (TEchnical Social Network Analysis) project waarin we een methode en bijbehorende tool ontwikkeld, welke een projectmanager kan gebruiken om specifieke coördinatieproblemen te detecteren. Deze coördinatieproblemen noemen we ook wel Socio/Technical Structure Clashes (STSCs). De TESNA-methode en -tool zijn zowel door middel van twee case studies binnen een commerciële setting geëvalueerd (zie hoofdstuk 6 en 7) als middels meerdere case studies binnen Open Source softwareontwikkelingsomgevingen (zie hoofdstuk 8). In hoofdstuk 9 geven we een cross-case discussie en analyse van de verschillende case studies.
160