1
Improving Data Driven Decision Making Through Integration of Environmental Sensing Technologies Sullivan, T.1 , Zhang, D.1,2 , O’Connor, E.1 , Armstrong, A.3 , Briciu-Burghina, C1 , Heery, B.1 , Gualano, L.2 , Smeaton, A.2 , O’Connor, N. E.2 , and Regan,F1 1
MESTECH: Marine and Environmental Sensing Technology Hub, Dublin City University, Glasnevin, D9, Ireland. 2 CLARITY: Centre for Sensor Web Technologies, Dublin City University, Glasnevin, D9, Ireland. 3 School of Human Performance, Glasnevin, D9, Ireland.
Abstract—Coastal and estuarine zones contain vital and increasingly exploited resources. Traditional uses in these areas (transport, fishing, tourism) now sit alongside more recent activities (mineral extraction, wind farms). However, protecting the resource base upon which these marine-related economic and social activities depend requires access to reliable and timely data. This requires both acquisition of background (baseline) data and monitoring impacts of resource exploitation on aquatic processes and the environment. Management decisions must be based on analysis of collected data to reduce negative impacts while supporting resource-efficient, environmentally sustainable uses. Multi-modal sensing and data fusion offer attractive possibilities for providing such data in a resource efficient and robust manner. In this paper, we report the results of integrating multiple sensing technologies, including autonomous multi-parameter aquatic sensors with visual sensing systems. By focussing on salinity measurements, water level and freshwater influx into an estuarine system; we demonstrate the potential of modelling and data mining techniques in allowing deployment of fewer sensors, with greater network robustness. Using the estuary of the River Liffey in Dublin, Ireland, as an example, we present the outputs and benefits resulting from fusion of multi-modal sensing technologies to predict and understand freshwater input into estuarine systems and discuss the potential of multi-modal datasets for informed management decisions.
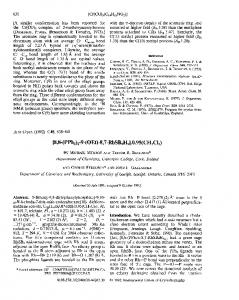
from factors such as sensor drift and biofouling result in inadequate spatial coverage of most aquatic zones[5][8]. Thus, combining multiple technologies and sensing modalities in environmental monitoring programmes can provide not only advantages of redundancy and robustness for sensing systems, but also enhanced understanding of environmental processes. A vision of the form that such an integrated multi-modal sensing system might take is illustrated in Figure 1. However, many technical and economic hurdles still exist to seamless integration of sensing technologies in a cost-efficient manner in such a system. Nevertheless, considerable advances can be made if robust sensing technology can be combined with sophisticated methods of data analysis, modelling and prediction.
Keywords—multi-modal sensing, sensor networks, salinity, estuarine, data fusion, prediction and modelling.
I. I NTRODUCTION Environmental sensing technologies such as autonomous sensors and wireless sensor networks (WSNs) are tools that provide an opportunity to meet the challenges of monitoring large geographical areas with high temporal frequency[1][13]. Such technologies are now reaching a stage in development where technology maturation (including high performance and reduced initial costs) enable collection of large datasets with high temporal frequency[6][17]. However, there are substantial challenges to widespread deployment of devices to collect data on large spatial scales, and such goals are not yet achievable in a cost-effective manner, particularly in aquatic monitoring programmes. High installation and operating costs of deployment infrastructure coupled with sensor unreliability stemming corresponding author:
[email protected]
Fig. 1. An overview of the general strategy for integrating multiple data streams from environmental sensing technologies in order to provide enhanced outputs and decision making capabilities.
Ideally a multi-modal sensing system would integrate as many sensing modalities as possible, i.e. remote sensing data (e.g. satellite, radar), in-situ aquatic sensors (measuring dissolved oxygen levels, turbidity, current profiles etc.), visual sensing (cameras), meteorological data and any other relevant data. Access to such data sources can provide much greater un-
2
derstanding of a system than any one modality alone[10][11]. In this paper, we demonstrate, using in-situ measurements, rainfall and tidal data sources as an example, how multi-modal systems that combine visual sensing technologies with in-situ multi-parameter aquatic sensing systems can be utilised to provide enhanced environmental understanding and predictive capability in an estuarine environment. This data can then be utilised to provide information leading to improved management decisions. A. Importance of Salinity in Estuarine Systems Intertidal environments in estuaries represent critical exchange environments for both marine and freshwater systems. Salinity is the key tracer of freshwater input into coastal zones and directly contributes to seawater density and circulation patterns. However for environments like estuaries, where large salinity changes can occur on a daily and/or seasonal basis, prediction of levels is difficult. By their very nature at the interface of marine and freshwater systems, estuaries also exhibit considerable spatial and temporal heterogeneity in environmental parameters, which complicates study and understanding of transport processes. Characterisation of this heterogeneity through isolated point samples is commonly time-consuming, expensive and often unrepresentative. Additionally, estuarine environments are dynamic and complex systems where biotic and abiotic factors are often difficult to model and predict[12][14]. Estuaries are therefore attractive locations for integration of multi-modal sensing platforms[7]. Practical considerations such as ease of access to near-shore infrastructure, readily available power supplies and communications mean that such zones are generally convenient for testing and prototyping of novel systems. A key requirement of estuarine and marine monitoring systems is the ability to predict water levels and changing freshwater inputs into any given system. Key goals include identifying relationships between catchment rainfall and runoff in an estuary, including the dominant forcing mechanisms affecting the transport of stormwater within the estuary, estimating volumes of storm water associated with high-precipitation events and predicting residence times of storm water within the system following monitored high-precipitation events. Understanding effects of flow rates and salinity gradients within estuarine systems are important when considering the effects of such forces on both natural and anthropogenic systems[3][4]. For example, large variations in freshwater influx into a system can profoundly affect phytoplankton dynamics (perhaps related to nutrient transport or stratification-destratification events), or can significantly affect the probability of a flood event occurring. The ability to continuously monitor salinity for prediction and understanding of riverine discharge rates are thus crucial to many environmental phenomena occurring in otherwise complex estuarine systems. Unfortunately deployed in-situ sensors are prone to failure and data losses are almost inevitable in monitoring programmes due to imposed sensor downtime. Building redundancy into in-situ systems by integration of external multi-modal sensing systems into a complete and complementary sensing system can provide advantages in system redundancy and data reliability.
II.
S ITE D ESCRIPTION AND DATA C OLLECTION M ETHODS A. Site Location and Characteristics The River Liffey, flowing through Dublin City centre, is a highly commercialised zone, critical in both connecting Dublin and the island of Ireland to international maritime trade and for numerous commercial and recreational activities. Poolbeg Marina (latitude: 53 20’39”, longitude: -6 12’59”) is located on the lower Liffey Estuary in a busy port environment (See Figure 2). The estuary hosts a diverse ecosystem including benthic communities, fish and shellfish, seabird populations and marine mammals[16][18]. The area is also a zone of passage for salmon and sea trout migrating to and from feeding and spawning areas[2]. The topography of the estuary has been greatly modified, and is constrained by walls along its whole length and is regularly dredged to remove accumulated sediments. The working site is located in the upper part of the Estuary, where the ship traffic is less intensive. Average water depth in the area is approximately 8m and the width of the channel is approximately 260m. Due to the large amount of activity at the site and its importance from an environmental and ecological perspective, the site was equipped with a multiparameter in-situ sensor along with a visual sensing system.
Fig. 2. Location of Poolbeg marina in the estuary of the Liffey River catchment showing the location of both camera and the in-situ multi-parameter sensor suite.
B. In-Situ Sensors A multi-parameter sonde (YSI 6600EDS V2-2), equipped to measure turbidity (NTU), optical dissolved oxygen (mgL 1 /%saturation), temperature ( C), conductivity (mScm 1 ), depth (m) and telemetry system (EcoNet) was purchased from YSI Hydrodata UK. The sonde was deployed at a depth of 2.5m from the water surface from the marina at Poolbeg, and data was collected since 1st of Aug 2012 with a sampling interval of 15mins. The pontoon of the marina at Poolbeg is a floating structure and therefore rises and drops in agreement with water level fluctuations. Thus the depth of the sensor remains constant with respect to the surface but varies in depth with respect to the river bed at this location. Thus, due to the fact the freshwater overlies the saline marine waters, derived salinity readings from the sensor reflect the relationship between the tidal state at any given
3
time and the amount of freshwater entering the estuary from upstream. Temperature, dissolved oxygen and derived salinity values were confirmed periodically using a ProPlus handheld multi-parameter instrument (YSI Hydrodata UK) and turbidity was validated using a portable turbidity meter Turb R 430 IR (VWR Ireland). Both hand held instruments were calibrated in the laboratory prior to site visits as per manufacturer’s protocols. Site visits were undertaken fortnightly in winter and weekly in spring. Copper tape and mechanical wipers (for the optical oxygen and turbidity sensors) were used to control biofouling of sensor systems.
C. Visual Sensor Along with the in-situ multi-parameter sonde, an IP66-Rated outdoor network camera was also deployed at the site. This was mounted on a pole at a height of 4.36m above the ground and approximately 20m from bank wall. This position is suitable for monitoring the shipping traffic while also being close to the location of the sonde (See Figure 2 which shows the position of the sonde and the camera at the marina). The visual sensor continuously sends images back to a cloud server through 3G mobile broadband at relatively low frame rate (approximately 1 frame every 10 seconds). However, due to an unreliable network connection, this frame rate is not guaranteed.
III.
E XPERIMENTS AND R ESULTS
A. Salinity Prediction 1) Variability in Salinity Values as Measured by In-Situ Sensors: Salinity values from the YSI 6600 EDS multiparameter sonde are reported as parts per thousand (ppt) and the sensor electronics automatically reports derived salinity values as ppt based on conductivity and temperature readings at the time of measurement. Collected data revealed fluctuations in these readings that reflected both tidal states (ebb versus flood tide, neap versus spring tide) and freshwater runoff volumes (rainfall or snowmelt) from stations in the Liffey catchment area upstream (Figure 3). There was typically an inverse pattern between stream flow and salinity at 2.5m depth. Due to the fact that the in-situ sensor was positioned at a mean depth of 2.5m below the water surface, independent of tidal state and water height, the salinity readings obtained were indicative of the depth of freshwater floating on top of a denser high salinity (mean ⇡ 31.8ppt) layer. Thus, significant increase in the freshwater input into the system at any point in the catchment upstream resulted in an increase in the depth of the freshwater layer at the sensor site that was indicated by a corresponding decrease in the salinity values (< 30ppt) measured by the in-situ sensor. The detection of such events by the in-situ sensor is shown in Figure 4.
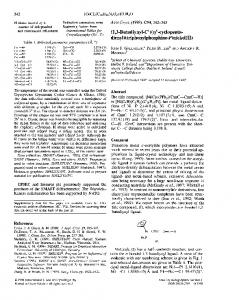
Fig. 3. Profile data as recorded by CTD of salinity and temperature variation with depth (top) (data from April 2011) and frequency distribution of salinity values (n = 4000 data points) on-site at Poolbeg(bottom), during stable conditions of low freshwater input, demonstrating the range of salinities values with a mean of approximately 31.8ppt at 2.5m.
Fig. 4. Graph of salinity data over one week, demonstrating decreases in derived salinity values, indicative of an increase in the volume of freshwater and the extension of the freshwater plume into the estuary following precipitation.
4
2) Methodology for Prediction of Salinity Values: A form of non-linear regression and a meta-classification approach is applied to develop the models. The output of a number of regression trees are combined in order to produce the model output. A regression tree[15] is a decision tree with linear regression functions at the leaves. One of the limitations of the regression tree approach is that it may be strongly influenced by outliers. To overcome this issue, the technique of “bagging” is adopted. This stands for “bootstrap aggregation” and it is a type of ensemble learning. In this approach many bootstrap replicas are generated from the dataset and decision trees are grown on these replicas. The output of such an approach for the predicted response is an average over predictions from individual trees. The experiments are carried out using WEKA1 data mining software. A decision tree method known as REPTree within WEKA is selected to build the prediction model. REPTree is a fast decision tree learner, it builds a regression (or decision) tree using information gain/variance reductions. Unlike other regression tree algorithms such as Random Tree, REPTree uses pruning to reduce error. In the following experiments, the default parameters of bagging REPTree in WEKA were used. The in-situ data used for the following experiments were measured by the multi-parameter sonde between Aug 21, 2012 and Nov 30, 2012 with sampling rate of 15mins. Tide level data (sampling rate 15mins) was provided by the Irish Marine Institute2 and daily rainfall data was supplied by Met Eireann3 . Current sensor depth, dissolved oxygen, turbidity were supplied as in-situ features to the model. This was supplemented with a mixture of current tidal level and up to five previous daily rainfall measurements (pre0 to pre4). Rainfall data from three weather stations near the test site were added to the model. 70% of the data entries from Aug 21, 2012 and Nov 23 2012 were chosen to train the model, the remaining 30% of the data were reserved for future parameter optimisation and data samples between Nov 24 2012 and Nov 30 2012 were used for testing. To avoid over fitting, all the models were built using 10 fold cross validation. In order to evaluate how multi-modal data sources can enhance salinity prediction the following experiments have been carried out to predict salinity using: • in-situ and tidal data (dual-modality). • in-situ, tidal and rainfall data (multi-modality). To compare the results, we assume the prediction accuracy is higher if the correlation coefficient (CC) value is closer to 1 and the mean absolute error (MAE) is closer to 0. The correlation coefficient is a measure of the correlation between two data sets. It is normally used to measure the linear dependence between two variables. The formulas for CC and MAE were Pn X Yi Y i=1 Xi q CC = qP Pn 2 2 n X X i=1 Xi i=1 Xi 1 http://www.cs.waikato.ac.nz/ml/weka/ 2 http://www.marine.ie 3 http://www.met.ie
n
M AE =
1X |Xi n i=1
Yi |
where Xi are the predicted values and Yi are measured values. 3) Prediction of Salinity Values from In-Situ Sensors Rainfall and Tidal Data: Incorporating contextual data sources into the model and using multi-modal data sources achieved better prediction accuracy. Furthermore, the results demonstrate that in-situ data combined with tide level and the preceding four days rainfall data achieved the best performance (CC:0.9727, MAE:0.2659), however, the results appear to signify that the previous 2, 3 and 4 days rainfall have very little effect on the salinity prediction accuracy. Figure 8 shows the comparison between real salinity values and predicted values. The error is small when salinity is stable and is slightly bigger when salinity is changing rapidly but the outputs from the predictor show a very similar trend to the real sensor readings. Figures 5 and 6 demonstrate the correlation of the predicted salinity values with the values measured by the in-situ sensors. It can be seen that predictive values that use tidal and rainfall data from two days prior to the measured in-situ data give a correlation coefficient of over 0.97 with the measured salinity values. There is no clear advantage to using rainfall and tidal data from subsequent days, as this does not increase prediction accuracy (Figure 5). However, the MAE values indicate that a marginal reduction in the prediction error is obtained by using the prior 4 days of rainfall and tidal data combined with insitu measurements (Figure 6). The distribution of the prediction error associated with the predicted values using the previous 4 days of tidal and rainfall data is also shown in Figure 6 (inset). Figure 7 visually displays the fit of the predicted data with the recorded in-situ data, showing the ability of the method to predict trends and events in the recorded salinity time series. Figure 8 plots the predicted values against the measured values and a linear model is fitted to the resulting data showing good correlation between the two variables at high salinity (> 27ppt). However at lower salinities there appears to be more variability between the two variables.
Fig. 5. Correlation coefficient values for salinity estimation using tide and up to five previous days rainfall.
5
Fig. 6. Mean absolute errors (MAE) for salinity estimation using tide and up to five previous days.
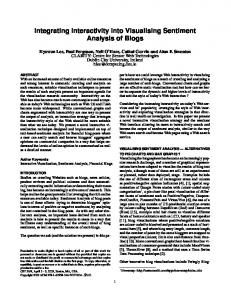
readings. To validate the effects of water level on the height of the floating dock relative to the riverbed and thus effects on in-situ sensor values, a visual sensing system was utilised on-shore to evaluate whether the location of the floating dock was an effective predictor of tidal height. 1) Methodology: In [9], O’Connor indicated that river water level can be estimated using water-land boundary visual features, such as the appearance of rock on the riverside and water line marks on the bank wall. Based on these visual features, water level can be classified into five classes from high water level to low water level. In this research, another novel method was proposed, complementary to O’Connor’s work where such visual features do not appear or are not clear at the site. Poolbeg has very different site characteristics, the bank wall is over 250meters away from our visual sensor node which means a boundary between water surface and wall is very difficult to differentiate. Also, due to items, such as tree branches floating on the edge of the rock at the near side, it is very difficult to distinguish rock from water surface as well. In order to predict tidal level at Poolbeg, the use of more global image features is investigated. As illustrated in Figure 9, when tidal level is high, the position of the dock, indeed the position of the corners of the dock, will be relatively high in the image and relatively low otherwise. Firstly, a corner detector is applied to the image and the corner points of the floating dock are then extracted from the image. Then the average height of these corner points is computed and mapped to real tidal level values using linear regression. When a best fit linear function is defined, the tidal level can be predicted by simply fitting the position of the dock within the new incoming image. Vibration of the dock caused by wind and waves leads to inaccurate predictions. This effect was limited by averaging the position of the dock over a short time interval (5 minutes).
Fig. 7. Graph of measured in-situ salinity values and predicted salinity values over 7 days, showing the ability of the method to detect reduced salinity events.
Fig. 9. A series of images demonstrating the positioning of the floating dock system at various tide levels. These positions were detected to provide predictive tide data.
Fig. 8. Graph of the fit of the predicted salinity values against measured in-situ salinity data, a linear model has been fitted to the data showing the agreement between the two variables.
B. Tide Level Prediction Using Visual Sensing A key factor in the deployment of in-situ sensors at Poolbeg is the effect of a floating deployment platform on sensor
2) Evaluation and Results: Three days image data from 19 Jul 2012 to 21 Jul 2012 was used to build a linear model and two days image data from 22 Jul 2012 to 23 Jul 2012 was used to evaluate the model. Due to the different characteristics of the image during night and day, this experiment was limited to day time images only (between 09:00 to 18:00). Figure 9 shows the relationship between the tide level and the position of the dock. Figure 10 shows the fit between the tidal height as predicted from analysis of images acquired by the in-situ camera and those recorded by the Dublin Port tide gauge. Figure 11 shows a comparison of real tide level and predicted tide level from image feature. It can be seen from the graph that the predictor performs very well during the first day (first 108 data samples)
6
Fig. 10. Tide level as predicted from image analysis of images acquired by the visual sensing system as plotted against values measured by the in-situ tide gauge.
Fig. 11. Fit of the predicted tidal levels against measured in-situ tidal data from the tidal gauge over two tidal cycles, demonstrating the ability of the method to predict tidal heights during daylight hours.
but over predicts in the second day. This is due to small boats docking at the upper side of the dock (see Figure 9) which shift up the center location when extracting image features. IV. D ISCUSSION Understanding the conditions that result in either well-mixed or stratified systems, under a variety of rainfall conditions are crucial in understanding the transport of sediments, nutrients and particulates on dissolved contaminants, as well as prediction of storm surge events. Generally, spring tides and up-estuary winds are thought to contribute to mixing while neap tides and down-estuary winds enhance stratification at the Poolbeg estuary site. Analysis of continuous in-situ salinity data and CTD profiles at the Poolbeg estuary site indicate that fresh water in the system initially travels down-estuary via a surface-water layer independent of the underlying marine waters occupying the water column at this site. Analysis of the variation in salinity values at a depth of 2.5m from the surface over a year-long time period indicate periods of decreased salinity associated with high freshwater input into the system. When the runoff volume related to rainfall increases upstream,
there is a corresponding increase in the depth of the surface freshwater layer at Poolbeg, which may ultimately contribute to increased water levels upstream in the event of a storm surge. Therefore, it is vital to be able to model and predict salinity levels and thus the extension of the freshwater plume into the estuary. Deployment of a multi-parameter in-situ aquatic sensing system in combination with a visual sensing system with access to external tidal and rainfall data has provided an enhanced picture of the interactions between water level and freshwater distribution in the lower Liffey Estuary. The use of a multi-modal sensing system can be used to model and predict the effect of tide level and rainfall on salinity levels at this site. It has also been shown that visual sensing to detect tidal height. The goal is to combine these capabilities in order to gain a greater understanding of estuarine dynamics and to build a complete multi-modal sensing platform. The eventual goal would be to replace the tidal data provided by in-situ sensors with the predictive data provided by the visual sensing system. By doing so, it would be possible to increase the robustness of the total sensing system, since the visual sensing system is less prone to the unreliability associated with the in-situ systems. Other advantages of incorporating the visual sensing system include ground truthing of data from in-situ sensors and providing an events catalogue from the system [9][19]. Indeed incorporation of a visual sensing node into the sensing platform provides access to other sources of data and the possibility for detection of events such as shipping and security related issues.
A. Improved decision making The ultimate aim of deployment of such a multi-modal system would be to provide enhanced tools that supply improved data for analysis and decision-making in regard to the estuary and the surrounding coastal zone as a whole. Despite rainfall being intuitively considered an important factor in coastal and estuarine flood prediction, few storm surge modelling studies or operational forecasting systems incorporate the “estuary effects” of freshwater flows and water density stratification and variation [7]. Some processes are routinely incorporated in surge modelling (e.g., atmospheric pressure, remote forcing) and some others are nearly always ignored (e.g., water density variations and storm-driven freshwater inputs). The worst storm surges often result from storms that also bring heavy precipitation. Many population centers are located on estuaries where freshwater flow and storm tides merge. The city of Dublin is no exception to this and susceptibility to extreme events has increased in the last decade, whereby a number of flooding events have occurred due to pluvial, coastal and infrastructure failures, resulting in excess freshwater input into the catchment beyond the capacity of flood defences to protect regions of the city. Prediction of salinity values downstream at in a port environment such as Dublin Port (and Poolbeg Marina) allow indication of the amount of freshwater in the system, and thus is one component of an integrated system that can provide the basis of a flood management program.
7
V. C ONCLUSIONS By prediction of in-situ salinity values from other in-situ parameters, tide level and rainfall, it has been have demonstrated that both redundancy and enhanced prediction capability can be achieved through use of multi-modal sensing systems. The results demonstrate that trends in environmental parameters such as salinity could potentially be estimated accurately. Furthermore, this may reduce the need for multiple sophisticated in-situ sensors on site; or provide intelligence that indicates when a sample needs to taken. This provides the opportunity to create a data driven self-adapting marine monitoring sensor network. Integration of the visual sensing system provides a low-cost sensor modality that produces contextual information of the scene, which may then be used to enhance abnormal event detection and water quality parameter prediction. Accurate and timely information, leading to improved and timely management decisions are the overarching drivers of monitoring projects in areas such as estuaries. Ultimately, the outputs of environmental projects such as these must include the ability to predict significant events such as the occurrence of harmful algal blooms (HABS), elevated levels of microbial contaminants such as E. coli or times of high probability of flood events occurring. The successful future development of systems ACKNOWLEDGMENT This work is supported by: The Beaufort Marine Research Award carried out under the Sea Change Strategy and the Strategy for Science Technology and Innovation (2006-2013), with the support of the Marine Institute, funded under the Marine Research Sub-Programme of the National Development Plan 2007-2013, QUESTOR Research Center under grant DCU8/10/2013 and Science Foundation Ireland under grant 07/CE/I1147. The authors also wish to thank the staff at Poolbeg Marina for permission, assistance and access to the deployment location and marina facilities. R EFERENCES [1] [2] [3] [4] [5] [6] [7]
F. Collins, D. Orpen, D. Maher, J. Cleary, C. Fay, and D. Diamond. Distributed chemical sensor networks for environmental sensing. pages 58–62, 2011. D. C. Conncil. Dublin to Waste Project. Environmental Impact Statement. Number 246851. Dublin City Council, 2006. Chapter 12. C. Crain, B. Silliman, Bertness, S.L., and M. Bertness. Physical and biotic drivers of plant distribution across estuarine salinity gradients. Ecology, 85:2539–2549, 2004. B. Eyre and P. Balls. A comparative study of nutrient behavior along the salinity gradient of tropical and temperate estuaries. Estuaries, 22(2):313–326, 1999. D. Laurent, C. Chantal, and L. Michel. Biofouling protection for marine environmental sensors. Ocean Science, 6:503–511, 2010. A. Lawlor, J. Torres, B. O’Flynn, J. Wallace, and F. Regan. Deploy: a long term deployment of a water quality sensor monitoring system. In Sensor Review, volume 32, pages 29–38, 2012. S. B. Lee and G. F. Birch. Utilising monitoring and modelling of estuarine environments to investigate catchment conditions responsible for stratification events in a typically well-mixed urbanised estuary. Estuarine, Coastal and Shelf Science, 111(0):1 – 16, 2012.
[8] [9] [10] [11]
[12]
[13]
[14] [15] [16] [17]
[18] [19]
D. V. Manov, G. C. Chang, and T. D. Dickey. Methods for reducing biofouling of moored optical sensors. In Journal of Atmospheric and Oceanic Technology, volume 21 of 6, pages 958–968, 6 2004. E. O’Connor. Trust and Reputation in Multi-Modal Sensor Networks for Marine Environmental Monitoring. PhD thesis, Dublin City University, 2012. E. O’Connor, A. F. Smeaton, and N. O’Connor. A multi-modal event detection system for river and coastal marine monitoring applications. In OCEANS, 2011 IEEE - Spain, pages 1–10, 2011. E. O’Connor, A. F. Smeaton, N. E. O’Connor, and D. Diamond. Integrating multiple sensor modalities for environmental monitoring of marine locations. In Proceedings of the 6th ACM conference on Embedded network sensor systems, SenSys ’08, pages 405–406, New York, NY, USA, 2008. ACM. T. O’Higgins and J. Wilson. Impact of the river liffey discharge on nutrient and chlorophyll concentrations in the liffey estuary and dublin bay (irish sea). Estuarine, Coastal and Shelf Science, 64(23):323 – 334, 2005. J. H. Porter, E. Nagy, T. K. Kratz, P. Hanson, S. L. Collins, and P. Arzberger. New eyes on the world: Advanced sensors for ecology. volume 63, pages 385–397. American Institute of Biological Sciences, 2009. C. Raick, K. Soetaert, and M. Gr´egoire. Model complexity and performance: How far can we simplify? Progress in Oceanography, 70:27–57, July 2006. L. Rokach. Data mining with decision trees: theory and applications. World Scientific Publishing, 2007. S. Roth and J. G. Wilson. Functional analysis by trophic guilds of macrobenthic community structure in dublin bay, ireland. Journal of Experimental Marine Biology and Ecology, 222(12):195 – 217, 1998. P. J. Smith, D. Hughes, K. J. Beven, P. Cross, W. Tych, G. Coulson, and G. Blair. Towards the provision of site specific flood warnings using wireless sensor networks. Meteorological Applications, 16(1):57–64, 2009. J. Wilson. Productivity, fisheries and aquaculture in temperate estuaries. Estuarine, Coastal and Shelf Science, 55(6):953 – 967, 2002. D. Zhang, E. O’Connor, K. McGuinness, N. E. O’Connor, F. Regan, and A. Smeaton. A visual sensing platform for creating a smarter multimodal marine monitoring network. In Proceedings of the 1st ACM international workshop on Multimedia analysis for ecological data, MAED ’12, pages 53–56, New York, NY, USA, 2012. ACM.