International Journal of Intelligent Computing Research (IJICR), Volume 2, Issues 1/2/3/4, Mar/Jun/Sept/Dec 2011
Improving Finding and Re-finding Web search Results Using Clustering and Visualisation Hoda Badesh
James Blustein
Faculty of Computer Science Dalhousie University Halifax, NS, Canada
[email protected]
Faculty of Computer Science & School of Information Management Dalhousie University Halifax, NS, Canada
[email protected]
Abstract— presenting search results as a list of hits is often an insufficient way to assist users to find relevant documents and discover varied topics among search results. Visualization can assist users to find relevant documents. This paper presents a Data Mountain Search Results Presentation Interface (DMSRPI) and a plan for a user study of its effectiveness. The interface is intended to improve the effectiveness and efficiency of users' search of the Web. Keywords- Web information retrieval, visualization, techniques, visual clustering, re-searching, re-finding
I.
INTRODUCTION
Bonnel et al. (2006) defined Web search as a process for collecting webpages from the Internet, which match a request for information. The most popular use of the Internet, according to Kim (2008), is searching the Web. Given large amounts of information and its variety on the Web, researchers have been looking for search techniques that would make it easy for the user to understand the presented results. Many Web search interfaces and systems have been presented in the literature as discussed in the work of Kules et al. (2008). The primary target for all those systems is to allow users to explore and navigate through search results easily. For example, Paulovich et al. (2008) reported that result lists which show documents along with their surrogates such as titles, snippets, and URLs can lead to more effective searches than results consisting solely of ranked results. Hoeber (2009) defined information visualization as a method for graphical presentation of search results that enable users to search and explore Web search results effectively. Involving aspects of visualization in the process of Web search can help users to navigate through search results and explore the relevancy among the retrieved documents through overviews of search results. Cluster-based visualization is a way to present search results so that users can refine their view of the results rather than reformulating their query and issuing a new query. In such methods results are placed in categories. When clustering is used, search results are classified based on particular criteria and each category is given a cluster label (Manning et al., 2008). The value of clustering is that these techniques enable users to focus their attention on the subset of results in categories
Copyright © 2011, Infonomics Society
they believe are most relevant to the search query. Clusterbased presentations may also give users insight into the composition of the collection of documents that is being searched and how the search engine interprets their query. Text-based presentations are more effective for finding new web documents that a user has not seen before, while visualization presentations can be utilized in re-finding web documents that the user have already encountered in past searches (Teevan et al., 2009). Visualization and clustering techniques have been investigated as ways to reduce users' effort in identifying relevant search results, (Alhenshiri et al., 2010a). However Kules et al. (2008) showed that visualization can be frustrating for exploration of search results. Furthermore, Some types of visual presentations have specific disadvantages: Sutcliffe and Patel, (1996), and Risden et al., (2000) reported that 3D visualization presentations make interfaces more confusing for users trying to find relevant results. We aim to improve Web search by creating a blend of the best features of earlier systems and avoiding the pitfalls they have so far revealed. The system we are developing will improve Web search by making it easier for users to browse the results, and to understand how the search engine interprets the document collection. While it is often preferable for users to find the results they seek immediately it is sometimes necessary for users to reformulate queries. Users are best able to formulate queries if they understand how the document collection is structured. We measure success by efficiency and effectiveness. Efficiency refers to the amount of effort required by the user. An effective interface helps users identify the results they seek in the results of a search. This paper presents a prototype system intended for improving the presentation of Web search results. The system was built to improve how users recognize Web search results of interest. The use of clustering and visualization is meant to improve how users gather and collect web pages for tasks that involve searching for information that belongs to varied topics and can be found in different sources. This type of task is called ‘Information Gathering’ (Broder et al., 2002; Kellar et al., 2007). Moreover, re-searching the web for re-finding search results is considered in the presented system. This is done by allowing users to preserve a subset of Web search results that
228
International Journal of Intelligent Computing Research (IJICR), Volume 2, Issues 1/2/3/4, Mar/Jun/Sept/Dec 2011
the user may re-use in future sessions belonging to the same information goal. This feature is also intended to improve the effectiveness of users gathering information on the web over multiple sessions. The remainder of this paper is divided as follows. Section II provides an overview of related work that includes visualization of search results presentations, visual clustering, and re-searching the web. The design and implementation of the DMSRPI are illustrated in Section III. Section IV discusses the search, presentation, and re-search models in the system. Section V illustrates the proposed evaluation study. Section VI provides a discussion of the research work. The article concludes with a brief summary in Section VII. II.
RELATED WORK
Visualization has been widely exploited in information retrieval and Web search. The following sections discuss research related to the use of visualization in presenting Web search results and search results clustering. In addition, aspects of re-searching the web are discussed. A. Visualization in Web search Results Presentation Several studies have investigated the effect of visualization on how users find relevant documents among Web search results (Havre et al., 2001; Suvanaphen and Roberts, 2004; Kules et al., 2008). Most conventional search engines offer a list-based presentation of search results. When the user submits a query, the search engine may interpret the query terms into meanings that are different from what the user intended. Hence, the user may find it difficult to find relevant results in a list provided by the search engine. Ziana and Baranauskas (2005) designed a search system called Visual Representation of List Elements (REVEL). REVEL allowed users to see visual representations of the query results instead of a list of hits. Search results on REVEL were shown as icons linked to each other based on their content similarity in an interactive manner. In addition, the user could see the rank value on each document. That interface presented the last six selected documents in addition to a general information table that contained the URL of the document and a short summary. The information appeared whenever the user hovered over a document icon. In the evaluation experiment, users found that REVEL made it easier to find information and that the general information table was useful during search. However, some participants complained about the efficiency of REVEL. They also found it difficult to understand the meaning of links connecting document icons, which may have been accompanied with clutter. Visualization can further help with browsing web pages. For instance, Robertson et al. (1998) used ‘data mountains’ presentation of web pages to allow users to view and arrange pages on the web browser. They revealed that data mountains were much better than the interface of a regular browser. The approach allowed users to arrange their documents manually while browsing. However, the exploration of documents was sometimes frustrating.
Copyright © 2011, Infonomics Society
Nortel and Kazman (1997) presented webQuery, a system for searching the web based on content and connectivity. The system was aimed to help users during Web search. The webQuery interface provided users with several layouts such as cone tree and bull’s-eye for presenting search results. The results were represented as nodes and ordered according to their connectivity. The use of core trees allowed for better use of the display to show similar characteristics of search results. Those layouts are more flexible and they authorize searchers to seek their needs and have multiple approaches to present nodes of the hit sets. Nevertheless, the webQuery technique suffered from the expensiveness of presenting search results with multiple layouts. Teevan et al., (2009) introduced a visual snippets-based system for presenting Web search results. They extracted several features that a web page had which included the title, the most important image, and the logo sample of the page (when available). The study involved a comparison between three types of Web search results presentations. The three types included: textual snippets (web page title, one line summary, and URL for the page), visual snippets (described above), and thumbnails (snapshots of web pages). The study found that web users were more comfortable with using textual snippets. Nevertheless, the visual snippets generator was effective for revisiting. Joho and Jose (2006) exploited Google results to create four diverse layouts. Each layout was designed to present a particular type of search results. The first layout presented search results as a text-based list of hits. The second layout was basically the same as the first layout plus presenting three highest ranked sentences in each document. The third layout presented a list of thumbnails of search results with result surrogates. The fourth and final layout contained all the features in the other three layouts. The comparison study on those four layouts found that the forth layout was the most effective. B. Visual Clustering Kobayashi et al. (2006) clustered Web search results in a hyperbolic tree. Their users could navigate through search results faster and easier. The system utilized HTML tags to classify web pages according to their content. The title of a web page was used for labeling clusters of search results. The clustering process was done as follows: each web page was regarded as one cluster; features of each web page were stored in vectors; after storing the documents’ features, the system compared the inner elements of the vectors. Then clusters were compared to each other for constructing bigger clusters. The interface provided users with categorized results on one screen rather than moving through many result pages. However, the nodes of search results were provided on the hyperbolic tree without summarizing each result page, which made it hard on users to recognize the usefulness of the results' content. Suvanaphen and Roberts (2004) introduced an interface that relied on multiple cards in a three dimensional space. On those cards, each document was represented as a node. The documents that had a hyperlink to other documents were linked
229
International Journal of Intelligent Computing Research (IJICR), Volume 2, Issues 1/2/3/4, Mar/Jun/Sept/Dec 2011
visually on cards. The card, which was presented in focus after the user submitted their query, had the most relevant results. When a user submitted a query, the system put the query terms on the screen of the interface to help users select among those keywords. When users wanted specific documents, they could select among these keywords to see the nodes that contain them highlighted. Hence, the interaction between the user and the system was effective. However, the scalability of this system was limited. Massive numbers of results could cause clutter and make navigating through the results less effective. C. Re-searching the Web for Re-finding Searching for information on the web can be for either finding previously unseen results or for re-searching for web documents that the user had located in the past. Re-searching for web documents is an important topic that was discussed in the work of Teevan (2008). The importance of re-searching for information comes from: first, 33% of Web search queries submitted by a user have already been issued by the same user; second, information experienced by a user including web pages previously viewed by that user is considered in one aspect ‘personal information’. Putting those documents under the umbrella of personal information necessitates investigating tools that would help the user in re-finding by re-searching Web search results of this nature. Teevan (2008) used the position of result hits to involve results for the same query from current and past sessions. The order of results was managed so that the user could see fresh results extracted from the underlying search engine in addition to previously kept search results for the same query. The display priority given to which proportion (old results vs. fresh results) is discussed in the work of Teevan (2008). The results showed that re-finding and re-using of search results with the new approach was effective. However, the list-of-hits presentation of Web search results may introduce difficulties associated with locating which results are currently of interest to the user. The order in presenting search results may not be an optimal solution for searching and re-searching both on the same display. III.
DMSRPI DESIGN AND IMPLEMENTATION
Our Data Mountain Search Results Presentation Interface (DMSRPI) was designed to satisfy the following criteria:
Visualization of search results should make it feasible for users to recognize web pages of interest among the rendered results. Therefore, snapshots of web pages are presented on the DMSRPI's display.
Relationships among web pages (clustering) should be shown without the clutter that results from using edges. Therefore, DMSRPI uses the concept of a data mountain in which related web pages are shown close to each other and far from pages that belong to other topics.
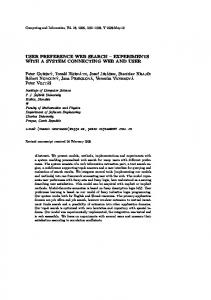
Focus + context are provided in the DMSRPI prototype (as shown in Figure 1). Users overview the results in the form of clusters (mountains) with the ability to hover over each page to see details including the page's
Copyright © 2011, Infonomics Society
summary, URL, and title. In addition, hovering over a search hit results in magnifying the page thumbnail to provide more focus.
The least amount of text is shown on the display while users explore search results. This helps users to focus on the similarities among search results especially for tasks that need more than one topic and sources of information such as information gathering (Kellar et al., 2007).
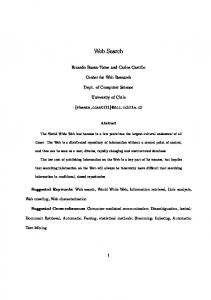
The DMSRPI gives the user the ability to keep a subset of the search results under a label (the query keywords by default) and with the ability to add comments to the results kept. Re-finding the results saved can be either by searching past queries in a list or by keyword search.
The interface gives the user the ability to keep a subset of the collection of search results presented during one search activity. The results are kept associated with the query and user comments. This feature is intended to improve re-searching by allowing keeping and re-finding for a group of web pages related to a query and most likely to a task the user is performing at the time of the query submission. In addition to the group of search results, the user is given the ability to add comments to the saved set of pages to make re-finding later more effective by searching the user comments, the titles of the pages, or a list of labels given to each group of pages kept for re-finding. When the user attempts to search the web to re-find certain pages, sometimes, and due to the evolutionary nature of the web and the continuous changes of the ranks given to web pages, the user cannot re-find the same web pages even if he/she submits the same query. The feature added to DMSRPI makes re-searching easier by re-finding the results locally on the user’s computer. The landmarks (search cues) kept for the user include the label given to the saved set of results (by default, the search query), the page titles, and the date on which the results were kept. The DMSRPI was designed using the prefuse visualization toolkit (http://prefuse.org/) discussed in the work of Heer et al. (2007). Java swing components were used in this design. The interface attempts to better use the concept of Data Mountains in providing more effective presentations of Web search results.
230
International Journal of Intelligent Computing Research (IJICR), Volume 2, Issues 1/2/3/4, Mar/Jun/Sept/Dec 2011
Figure 2. Keeping a Set of Search Results
Figure 3. Re-finding
Figure 1. DMSRPI Interface
IV.
DMSRPI SEARCH, PRESENTATION, AND RE-FINDING
When the user submits a search query, the system forwards the query to Google and Yahoo! search engines through their respective APIs (Google AJAX search API1 and Yahoo Boss2). The results coming from both search engines are then filtered for elimination of repeated hits. The purpose of using search results from two different search engines is to cover as many topics as possible in the final set of results. Tyler and Teevan (2010) have shown that although the overlap between Google and Yahoo can be high, it is not significantly high. Therefore, having both search engines as search results providers may have some additional benefits. The second step is computing the similarities among search results for presenting relationships. This is done in DMSRPI using the cosine similarity (Manning et al., 2008), which is based on using content similarity. The similarity is computed between the summaries of web pages provided by the underlying search engines. Each page is compared to each and every other page in the result set. A threshold is used to decide on which documents belong together in one cluster. The threshold is automatically determined to produce a reasonable number of clusters that does not clutter the display.
1 2
http://code.google.com / http://developer.yahoo.com/search/boss/
Copyright © 2011, Infonomics Society
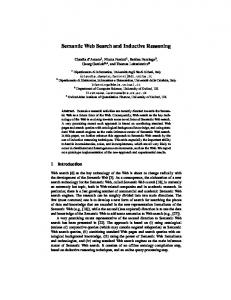
Thirdly, the Google preview publicly available directory is used for supplying web page thumbnails to DMSRPI. Each page is assigned a thumbnail and a cluster to which it belongs as shown in Figure 1. Hard clustering is used so that each page belongs to one cluster only (Manning et al., 2008). Moreover, the presentation algorithm used in DMSRPI uses special characteristics of the display to present the results in the shapes of data mountains (clusters). That is, each cluster is presented taking the shape of a mountain. The closer the results to the user, the higher the rank. The ranks of the results depend on the other given by the underlying search engines. DMSRPI was built to support re-searching for web documents. Users can use the system to keep (save) complete search sessions by eliminating unwanted results from the display and leaving a group of documents to be kept for later re-finding under a task label (as Figure 2 shows). The user can later look up the query from a list of labels preserved earlier as shown in Figure 3. The results that were kept will then appear on the display taking the user back to the search context which he/she kept earlier. This feature was intended to support users trying to find the same results that were once rendered for a search query and that can no longer be found even by submitting the same exact keywords in the query. V.
EVALUATION
We plan to evaluate DMSRPI with a user study. The study will involve users performing an information-searching task with a and completing an assessment questionnaire to measure their attitudes towards searching and re-searching in general, and with our system in particular. The study will involve twenty or more participants. We will use tasks for which we know the most relevant results and other tasks which the users will choose. The data that will be collected in the study will mainly concern factors related to the perceived effectiveness of the DMSRPI and other engagement factors such as the helpfulness of the interface, the benefit of the re-searching feature, and the overall satisfaction of the user. The study will be in field settings in which the participants will be asked to use the search interface on their own computers. Participants will be given a task (described in Figure 4) and will be asked to conduct the task on their machines. The task was taken from the work of Alhenshiri et al. (2010b). The participants will also be asked to fill out the questionnaire described in Figure 5 prior to conducting the study. They will be given an exit questionnaire described in Figure 6. The participants will not be restricted to only completing the task. They will be asked to use the interface for two weeks and
231
International Journal of Intelligent Computing Research (IJICR), Volume 2, Issues 1/2/3/4, Mar/Jun/Sept/Dec 2011
record their experience, suggestions, and all kinds of comments that may lead to improving the interface. After collecting the data in the questionnaires, the research will continue with improving the DMSRPI based on the user evaluation in the initial study. Then, a complete factorial and counterbalanced study will be conducted. The DMSRPI will be compared to other search engines that use the conventional listof-hits presentation of search results. The re-searching for refinding feature will also be compared to bookmarking and session making (an add-on used in web browsers such as Google Chrome). The larger study will involve more participants from wider demographics.
Figure 5. Pre-study Questionnaire
Figure 4. A web information gathering task example
Figure 6. Post-study Questionnaire
VI.
DISCUSSION
Research shows that there has been a great deal of focus on using visualization in web information retrieval. In addition, clustering has been investigated for improving how users find relevant search results. However, most of the techniques discussed in the literature suffer from several drawbacks. Those pitfalls include issues of inefficiency and clutter due to inability to present a great deal of results or to expensiveness associated with the technique in question. Since the most obvious disadvantage of current conventional presentations of search results by relying on text and a few hits per page is the inability to perceive relevant
Copyright © 2011, Infonomics Society
232
International Journal of Intelligent Computing Research (IJICR), Volume 2, Issues 1/2/3/4, Mar/Jun/Sept/Dec 2011
results among the massive number of documents returned, research needs to focus on the following aspects:
[3]
Visualization should be combined with clustering for providing overviews of topics related to the search query. Clustering should be interactive and it should provide multiple criteria for the user depending on their interest. This helps users who look for information related to different topics for a task. Visualized clusters should be easy to manipulate so that users turn to clustering techniques and abandon the list-of-hits-based presentations. Users should be able to easily and interactively search clusters of interest and not follow the hierarchy usually provided by clustering search engines such as Clusty (http://search.yippy.com/). Finally, the type of user and their interest and task should also be taken into consideration.
[4]
There are further enhancements that need to be implemented in our DMSRPI prototype before it can be tested. Zooming is provided only for each individual page. Only one clustering criteria (topical clustering) has been considered in DMSRPI. Future work will involve clustering based on the genres to which each web page belongs, the network domain, and possible other criteria. Moreover, testing DMSRPI would reveal further issues that would need to be handled in future versions. In order to test DMSRPI, a user study is needed. In a user study, the prototype will be compared to current Web search engines such as the raw-based presentation used in Google and the clustering-based search engine Clusty. User will be given search tasks and will be asked to submit queries and evaluate the results provided by each interface involved in the comparison. The study will evaluate the effectiveness as well as the engagement of DMSRPI compared to the other search engines in the comparison. However, since this prototype is at the early stages of development, a pilot study will be conducted first. VII. CONCLUSION This article presents a prototype system in which visualization and clustering were implemented to improve the presentation of Web search results. The DMSRPI prototype employed web page snapshots for presenting each individual result while using a data mountain layout for presenting each cluster of documents that belong to a topic covered in the result set. Future steps include implementing a visualization-based mechanism for reformulating queries as suggested in Alhenshiri and Blustein (2010) as well as using more than one clustering criteria. Following a pilot study, a complete factorial user study will be conducted to evaluate the effectiveness of the DMSRPI system in assisting users gathering information on the Web.
[5]
[6]
[7]
[8]
[9]
[10]
[11]
[12] [13]
[14]
[15]
[16]
[17]
[18]
[19]
REFERENCES [1]
[2]
A. Alhenshiri, S. Brooks, C. Watters, and M. Shepherd, “Augmenting the visual presentation of Web search results,” The 5th International Conference on Digital Information Management. Thunder Bay, ON, Canada, 2010, pp. 101–107. A. Alhenshiri, M. Shepherd, C. Watters, and J. Duffy, “Web information gathering tasks: a framework and research agenda,” the International Conference on Knowledge Discovery and Information Retrieval, Valencia, Spain, 2010, pp.131–140.
Copyright © 2011, Infonomics Society
[20]
[21]
A. Alhenshiri, and J. Blustein, “Exploring visualization in Web information retrieval,” International Journal for Internet Technology and Secured Transactions, vol. 3, issue 3, 2011, pp. 321–330. N. Bonnel, V. Lemaire, A. Cotarmanc’h, and A. Morin, “Effective organization and visualization of Web search,” the 24th IASTED international conference on Internet and multimedia systems and applications, Anaheim, CA, USA, 2006, pp. 209–216. S. Havre, E. Hetzler, K. Perrine, E. Jurrus, and N. Miller, “Interactive visualization of multiple query results,” the IEEE symposium on information visualization 2001 (INFOVIS'01), San Diego, California, USA, 2001, pp. 105–112. J. Heer, S. K. Card, and J. A. Landay, “Prefuse: A toolkit for Interactive information visualization,” the SIGCHI Conference on Human Factors in Computing Systems, Portland, Oregon, USA, 2005, pp. 421– 430. O. Hoeder, “Web information retrieval support systems: the future of Web search,” the 2008 IEEE/WIC/ACM International Conference on Web Intelligence and Intelligent Agent Technology, Washington, DC, USA, 2008, pp. 29–32. H. Joho, and J. M. Jose, “A comparative study of the effectiveness of search results presentation on the Web,” Lecture Notes in Computer Science, SpringerLink, vol. 3936, 2006, pp. 302–313. K. Kim, “Effects of emotion control and task on Web searching behavior,” Information processing and management: an international journal, vol. 44, issue 1, 2008, pp. 373–385. T. Kobayashi, K. Misue, B. Shizuki, and J. Tanaka, “Information gathering support interface by the overview presentation of Web search results,” the 2006 Asia-Pacific Symposium on Information Visualisation, Darlinghurst, Australia, Australia, 2006, pp.103–108. W. Kules, M. Wilson, M. C. Schrafel, and B. Shneiderman, “From keyword search to exploration: how result visualization aids discovery on the Web,” Southampton, UK: School of Electronics and Computer Science, University of Southampton, 2008. C. D. Manning, P. Raghavan, and H. Schütze, “Introduction to information retrieval, Cambridge University Press, 2008. C. J. Nortel, and R. Kazman, “WebQuery: searching and visualizing the web through connectivity,” The 6th international conference on the World Wide Web, 1997, 1257–1267. F. Paulovich, R. Pinho, C. B. Botha, A. Heijs, and R. Minghim, “PExWEB: content-based visualization of Web search results,” 12th International Conference on Information Visualization, IV'08, London, UK, 2008, pp. 208–214. K. Risden, M. P. Czerwinski, T. Munzner, and D. B. Cook, “Initial examination of ease of use for 2 D and 3 D information visualizations of Web,” International Journal of Human-Computers Studies, vol. 53, issue 5, 2000, pp. 695–714. G. Robertson, M. Czerwinski, K. Larson, D. C. Robbins, D. Thiel, and M. van Dantzich, “Data mountain: using spatial memory for document management,” the 11th annual ACM symposium on User interface software and technology, San Francisco, CA, USA, 1998. K. Sugiyama, K. Hatano, and M. Yoshikawa, “Adaptive Web search based on user profile constructed without any effort from users,” the 13th international conference on World Wide Web, New York, NY, USA, 2004, pp. 675–684. A. G. Sutcliffe, and U. Patel, “3D or not 3D: is it nobler in the mind?,” the BCS Human Computer Interaction Conference on Peopleand Computers XI, London, UK, 1996, pp. 79–94. E. Suvanaphen, and J. C. Roberts, “Textual difference visualization of multiple search results utilizing detail context,” the Theory and Practice of Computer Graphics 2004 (TPCG'04), Washington, DC, USA, 2004, pp. 2–8. J. Teevan, “How People Recall, Recognize and Reuse Search Results,” ACM Transactions on Information Systems special issue on Keeping, Refinding, and Sharing Personal Information, vol. 26, issue 4, 2008 J. Teevan, E. Cutrell, D. Fisher, S. M. Drucker, G. Ramos, and P. Andre, “Visual snippets: summarizing web pages for search and revisitation,” the 27th international conference on human factors in computing systems, Boston, MA, USA, 2009, pp. 2023–2032.
233
International Journal of Intelligent Computing Research (IJICR), Volume 2, Issues 1/2/3/4, Mar/Jun/Sept/Dec 2011
[22] S. K. Tyler and J. Teevan, “Large scale query log analysis of refinding,” the 3rd ACM International Conference on Web search and Data Mining. Santa Cruz, CA, USA, 2010. [23] C. M. Zaina, and M. C. Baranauskas, “Revealing relationships in search engine results,” the 2005 Latin American conference on Humancomputer interaction, New York, NY, USA, 2005, pp. 120–127.
Copyright © 2011, Infonomics Society
234