Improving High-Performance Computations on Clouds Through Resource Underutilization Roman Iakymchuk
Jeff Napper
Paolo Bientinesi
AICES, RWTH Aachen Schinkelstr. 2 52062 Aachen, Germany
Vrije Universiteit 1081 de Boelelaan 1081 HV Amsterdam, The Netherlands
AICES, RWTH Aachen Schinkelstr. 2 52062 Aachen, Germany
[email protected]
600
We investigate the effects of shared resources for high-performance computing in a commercial cloud environment where multiple virtual machines share a single hardware node. Although good performance is occasionally obtained, contention degrades the expected performance and introduces significant variance. Using the DGEMM kernel and the HPL benchmark, we show that the underutilization of resources considerably improves expected performance by reducing contention for the CPU and cache space. For instance, for some cluster configurations, the solution is reached almost an order of magnitude earlier on average when the available resources are underutilized. The performance benefits for single node computations are even more impressive: Underutilization improves the expected execution time by two orders of magnitude. Finally, in contrast to unshared clusters, extending underutilized clusters by adding more nodes often improves the execution time due to an increased parallelism even with a slow interconnect. In the best case, by underutilizing the nodes performance was improved enough to entirely offset the cost of an extra node in the cluster.
500
Keywords Cloud computing, Amazon EC2, high-performance computing, compute intensive applications.
INTRODUCTION
The cloud computing model emphasizes the ability to scale compute resources on demand. The advantages for users are numerous. Unlike conventional cluster systems, there is no significant upfront monetary or time investment in infrastructure or people. Instead of allocating resources according to average or peak load, the cloud user can pay costs directly proportional to current need. When resources are not in use, total cost can be close to zero. Individuals can quickly create and scale-up a custom compute cluster,
Permission to make digital or hard copies of all or part of this work for personal or classroom use is granted without fee provided that copies are not made or distributed for profit or commercial advantage and that copies bear this notice and the full citation on the first page. To copy otherwise, to republish, to post on servers or to redistribute to lists, requires prior specific permission and/or a fee. SAC’11 March 21-25, 2011, TaiChung, Taiwan. Copyright 2011 ACM 978-1-4503-0113-8/11/03 ...$10.00.
Execution time (secs)
ABSTRACT
1.
[email protected]
[email protected]
Average
400
300
200
100
0 16:00
16:30
17:00
17:30
18:00
18:30
19:00
19:30
20:00
20:30
21:00
21:30
Time of day
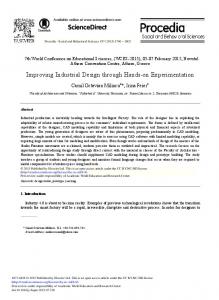
Figure 1: DGEMM’s execution time over 6 hours using all 8 cores of a c1.xlarge Amazon EC2 instance; see Table 1 for a description of the various instances. The matrix size is n = 10 k.
paying only for sporadic usage. However, there are also disadvantages to cloud computing services. Costs can be divided into different categories that are billed separately: for example, network, storage, and CPU usage. This model can be complex when attempting to minimize costs [9]. Further, the setup time for computation resources is currently quite long (on the order of minutes), and the granularity for billing CPU resources is coarse: by the hour. These two factors imply that resources should be very conservatively scaled in current clouds, reducing some of the benefits of scaling on demand. Finally, in many cloud environments, physical resources are shared among virtual nodes belonging to the same or different users [12], which can negatively impact performance. In order to determine the impacts of shared physical resources and the achievable efficiency of current cloud systems for HPC, we consider the execution of dense linear algebra algorithms, which provides a favorable ratio of computation to communication: O(n3 ) operations on O(n2 ) data. Dense linear algebra algorithms overlap the slow communication of data with quick computations over much more data [1]. However, HPC on cloud systems will still generally be limited by slow communication more than specialized HPC systems with high-throughput, low-latency interconnects. We evaluate the performance of HPC on shared cloud environments, performing hundreds of high-performance experiments on Amazon Elastic Compute Cloud (EC2). The experiments occur while nodes are shared with unknown other applications on Amazon EC2. The results show that
the performance of single nodes available on EC2 can be as good as nodes found in current HPC systems [10], but on average performance is much worse and shows high variability both on single node and small cluster evaluations. Fluctuation in the results is easily observed in Fig. 1. The graph presents the time of repeated DGEMM—the matrix-matrix multiplication kernel of the Basic Linear Algebra Subroutines (BLAS library)—using all eight cores of a High-CPU Extra Large (c1.xlarge) instance. The standard deviation is 33% of the average performance, several orders of magnitude larger than that observed in standard high-performance computing clusters. Due to the high variability in EC2 performance, we present not only the best performance, but also the average performance that computation is expected to achieve taking into account performance fluctuations. In light of the high-contention we witness, we believe that alternative definitions of efficiency for cloud environments should be introduced where strong performance guarantees do not exist. Concepts like expected performance or execution time, cost to completion, and variance measures—traditionally ignored in the HPC context—now should complement or even substitute the standard definitions of efficiency. This article also empirically explores computational efficiency in a cloud environment when resources are underutilized. We observe an abnormal behavior in the average performance on EC2: the peak average performance is reached when only a portion of the available resources is used, typically 25–50%. This behavior occurs both in single node performance and on clusters of up to 32 compute cores. Our results show that it is often more efficient to underutilize CPU resources: The solution can be obtained sooner, and thus the corresponding cost is also lower. Finally, we show that there is still available parallelism when underutilizing resources. In some cases, adding an extra node to the cluster is free: the computation finishes enough earlier to compensate for the marginal price of the extra node. The rest of this paper is organized as follows: we first give an overview of the Amazon EC2 environment, then we describe the single-node evaluations followed by the EC2 cluster evaluation. We summarize our results at the end of the paper.
2.
AMAZON ELASTIC COMPUTE CLOUD
Commercial vendors have discovered the potential of leasing compute time to customers on the Internet. For instance, Amazon, through the Amazon Elastic Compute Cloud (EC2) [8], provides the user with virtual machines to run different types of applications. Nodes allocated through EC2 are called instances. Instances are combined into entries known as availability zones. These zones are further combined into geographical regions: US, Europe, and Asia. Table 1 describes the differences between the available instance types: number of cores per instance, installed memory, theoretical peak performance, and the cost of the instance per hour. We only used instances with 64-bit processors. The costs per node vary by a factor of 7 from $0.34 for the smallest to $2.40 for nodes with the biggest theoretical peak performance and installed memory. We note that cost scales more closely with installed RAM than with peak CPU performance with the c1.xlarge instance being the exception. Peak performance is calculated using processor-specific capabilities. For example, the c1.xlarge instance type con-
Table 1: Information about various instance types: processor type, number of cores per instance, installed RAM (in Gigabytes), and theoretical peak performance (in GFLOPS/sec). Prices are on Amazon EC2 as of May, 2010.
Instance
Processor
Cores
RAM (GB)
Peak
Price ($/hr)
m1.large m1.large m1.xlarge m1.xlarge c1.xlarge m2.2xlarge m2.4xlarge
Intel Xeon E5430 AMD Opteron 270 Intel Xeon E5430 AMD Opteron 270 Intel Xeon E5345 Intel Xeon X5550 Intel Xeon X5550
2 2 4 4 8 4 8
7.5 7.5 15 15 7 34.2 68.4
21.28 8.00 42.56 16.00 74.56 42.72 85.44
$0.34 $0.34 $0.68 $0.68 $0.68 $1.20 $2.40
sists of 2 Intel Xeon quad-core processors operating at a frequency of 2.33 GHz. Each core is capable of executing 4 floating point operations (flops) per clock cycle, leading to a theoretical peak performance of 74.56 GFLOPS/sec per node. All instance types (with Intel or AMD CPUs) execute the RedHat Fedora Core 8 operating system using the 2.6.21 Linux kernel. The 2.6 line of Linux kernels supports autotuning of buffer sizes for high-performance networking, which is enabled by default. The specific interconnect used by Amazon is unspecified [8]. In order to reduce the number of hops between nodes, we run all experiments with cluster nodes allocated in the same availability zone. There have been previous evaluations of HPC performance on cloud systems. Edward Walker compared EC2 nodes to current HPC systems [11]. We also demonstrated through empirical evaluation the computational efficiency of compute intensive applications on EC2 nodes [6]. Preliminary results were antecedently reported in [5].
3.
SINGLE NODE EVALUATION
We analyze the performance of EC2 instances on dense linear algebra algorithms. We begin the study with the single node performance. Our goal is to analyze the stability of achievable performance and to characterize how performance varies with the utilized number of cores. In order to evaluate the consistency of EC2 performance, we execute compute intensive applications such as Matrix-Matrix Multiply (DGEMM) and High-Performance Linpack (HPL) benchmark—based on LU factorization [2]—for 24 hours, repeating the experiments over different days. We first present results for DGEMM and then discuss the results for HPL.
3.1
DGEMM Kernel
We perform measurements of the execution time of DGEMM under different scenarios to determine peak and average performance of single allocated VMs. The matrixmatrix multiplication kernel (DGEMM) of the BLAS library is the building block for all the other Level-3 BLAS routines, which form the most widely used API for basic linear algebra operations. DGEMM is highly optimized for target architectures, and its performance is typically taken as the
250
500
Average
450 400
150
350
Time (secs)
Execution time (secs)
200
Minimum Average
100
50
0 15:00
16:00
17:00
18:00
19:00
20:00
21:00
22:00
300 250 200 150
Time of day
100
Figure 2: DGEMM’s execution time over 6 hours using 1 of 8 cores of the c1.xlarge instance. The size of the input matrices is n = 10 k.
50 0 1
2
4
6
8
Number of cores 400
Figure 4: DGEMM’s average and best execution times on c1.xlarge vs. number of cores. The size of the input matrices is n = 10 k; error bars show one standard deviation.
Average
350
Execution time (secs)
300 250 200 150 100 50 0 16:30
17:00
17:30
18:00
18:30
19:00
19:30
20:00
20:30
21:00
21:30
22:00
22:30
Time of day
Figure 3: DGEMM’s execution time over 6 hours using 4 of 8 cores of the c1.xlarge instance. The size of the input matrices is n = 10 k.
peak achievable performance for a processor, often in the 90+% range of efficiency. To measure the achievable performance on allocated VM instances, we initialize three square matrices and invoke the GotoBLAS [3] implementation of DGEMM. We only measure the time spent in the BLAS library and not the time spent allocating and initializing the matrices. Our experiments show that contention among the co-located VMs (and possibly the hypervisor itself) degrades performance. Fig. 2 shows the execution time of repeated DGEMM on the c1.xlarge instance over 6 hours for matrices of size n = 10 k; the size is such that the input matrices do not to fit in the 8 MB L2 cache of the instance. For space reasons we show only 6 hours; however, the results over 24 hours and on different days show similar behavior. In this figure, only one of the eight cores of the c1.xlarge instance was used, and the results are quite stable. The average execution time over all our experiments is 227.9 s with standard deviation of only 0.23 s, i.e., 3 orders of magnitude smaller than the average. We calculate the average using the arithmetic mean of the samples, to demonstrate the statistically expected execution time of the computation. In the rest of this paper we use average, arithmetic mean, and expected execution time interchangeably. Executing on only 1 of 8 cores in an instance heavily underutilizes the paid resources. However, attempting to increase utilization quickly degrades performance. For example, in Fig. 3 we present the time to complete the same
DGEMM experiments using only 4 of the 8 cores of the c1.xlarge instance. The results already show very high variability in the execution time: the average execution time is 191.8 s, with standard deviation of 68.6 s. The average execution time is 84% of the single core case using four times the resources. In addition, the standard deviation is of the same order (36%) as the expected execution time. For comparison, we also ran the same DGEMM experiments on a node of a standard cluster: Intel Harpertown E5450 processor with 8 cores and 16 GB RAM. The node is quite similar to the c1.xlarge instance on Amazon EC2, but shows very little variability: when using 4 of 8 cores and limiting the memory to 7 GB, the average execution time is 43.73 s (25% of single core), with standard deviation of only 0.053 s (0.1% of the average). On the c1.xlarge instance we note that occasionally DGEMM executes with very high performance so that the best results are as fast as they would be expected, achieving 90% efficiency. These fast executions imply that the virtualization itself is not limiting the efficiency of the computation; instead, competition for the CPU and cache space through multi-tenancy significantly degrade the expected performance.1 The timings for the same experiments executed with all the eight cores show an even higher level of variability and much worse average execution time as shown previously in Fig. 1. The change in average and minimum execution times as utilization increases appears in Fig. 4. The figure presents times for DGEMM executed over 24 hours with n = 10 k. Error bars show the standard deviation from the average. The best performance (minimum) line indicates that DGEMM reaches roughly 90% of the efficiency.2 Such per1 The nature and the causes of the observed performance fluctuation and degradation would likely be better understood by using performance counters. Unfortunately, at the time of this study performance counters could not be used on EC2 instances, as necessary patches to the Linux kernels were not permitted. 2 Efficiency is the ratio between attained and theoretical (peak) performance. Attained performance comes from the
180
1800
Minimum Average
1600
160
1400
140
1200
Time (secs)
120
Time (secs)
Minimum Average
100 80
1000 800
60
600
40
400
20
200
0
0 1
2
4
6
8
1
Number of cores
Figure 5: DGEMM’s average and best execution times on a standard cluster vs. number of cores. The size of the input matrices is n = 10 k; error bars show one standard deviation.
formance is close to the optimal achievable. As the number of cores increases, the average execution time significantly increases along with the standard deviation. The standard deviation increases by four orders of magnitude. For comparison we present in Fig. 5 the average and minimum execution times of repeated DGEMM on the node of a standard cluster (as described previously). The difference between the average and minimum execution times is negligible, and thus the standard deviation of the average is always close to zero. Underutilization is clearly a good policy on EC2 to reduce overhead due to contention between VMs. Conversely, the results from the standard, unshared cluster imply the extra parallelism provided by more cores should reduce the execution time correspondingly. Each execution uses roughly the same amount of RAM with more cores using more (small) temporary buffers. Memory allocation is identical between the EC2 and cluster experiments. We infer that due to colocation of tenants, the higher pressure on cache space due to increased parallelism has the opposite, negative effect on EC2 than on an unshared cluster. As utilization increases, the performance on EC2 actually degrades roughly exponentially as the widening gap between the minimum performance—the expected performance on the unshared node—and the average performance demonstrates. Using two cores appears to be the optimal case; however, this sweet spot does not necessarily hold true for different workloads in the allocated VM or the co-allocated tenants. In our DGEMM experiment, using 4 of the 8 cores of a c1.xlarge instance takes longer on average than using only 2, and the trend worsens as the number of cores increases. Adding parallelism after two cores only succeeds in increasing contention. We conclude that multi-tenancy on EC2 probably does not go beyond 3–4 VMs per physical node (each with 2 cores) since some benefit from parallelism is still available. ratio between number of executed flops and execution time. Theoretical performance is calculated using the method described in section 2.
2
4
6
8
Number of cores
Figure 6: Average and minimum execution times of HPL on c1.xlarge vs. number of cores. The input configuration to each execution of HPL is identical.
Since the average performance is better (best) on 2 cores or even 1 core than on 8 cores, it would be better to rent part of the node than the whole node. By multiplexing several VMs on the same hardware, Amazon effectively supplies only part of the node to the customer, but provides access to all of the cores. We have shown that it is better to ignore the access to all of the cores and underutilize the instance to reduce the overhead of contending VMs.
3.2
HPL Benchmark
The GotoBLAS implementation of DGEMM supports parallelism only on shared memory architectures. In order to determine whether the effects we have seen using DGEMM extends to multiple nodes, we use the HPL benchmark [7] that can be scaled to large compute grids using MPI [4]. HPL computes the solution of a random, dense system of linear equations via LU factorization with partial pivoting and two triangular solves. The actual implementation of HPL is driven by more than a dozen parameters, many of which may have a significant impact on performance. Here we briefly describe our choices for the HPL parameters that were tuned: 1. Block size (NB ) is determined in relation to the problem size and the performance of the underlying BLAS kernels. We used four different block sizes, namely 192, 256, 512, and 768. 2. Process grid (p × q) represents how the physical nodes are logically arranged onto a 2D mesh. For instance, six nodes can be arranged in four different process grids, namely 1 × 6, 2 × 3, 3 × 2, and 6 × 1. We empirically observe that HPL performs better with process grids where p ≤ q. 3. Broadcast algorithm (BCAST ) specifies the algorithm used to transfer data among rows of processors; the optimal choice depends on the problem size and network performance. We first consider HPL on a single-node to provide a basis for comparison with the DGEMM kernel, and then extend
12000
Minimum 2 nodes Average 2 nodes Minimum 3 nodes Average 3 nodes
10000
Time (secs)
8000
6000
4000
2000
0 1
2
3
4
Number of cores
Figure 7: Average execution time of repeated HPL on m1.xlarge (AMD) by number of cores used per each node. 6000
Minimum 2 nodes Average 2 nodes Minimum 3 nodes Average 3 nodes
5000
4000
Time (secs)
the analysis to small clusters of instances. In Fig. 6 we execute HPL with n = 25 k on the c1.xlarge EC2 instance. We plot average and minimum execution times against the number of utilized cores. As with the previous DGEMM kernel experiments, error bars show the standard deviation. The input\output matrix for the computation fits in the main memory of a single instance. We do not directly compare the DGEMM and HPL experiments because of the different operations that they implement; however, we do note that Figs. 4–6 show similar behavior. Likewise, the comparison between HPL on EC2 and HPL on a standard cluster mirrors the comparison between DGEMM on EC2 and on a standard cluster; thus, we focus on the effects of scaling HPL. From the single node experiments we can conclude that the fastest performance of DGEMM and HPL on the EC2 cloud is nearly the same as on standard clusters. While the individual nodes provided are capable of efficient HPC computations even within virtual machines, the expected performance represented by the arithmetic mean can be several orders of magnitude worse than the best performance. Virtualization by itself is not the culprit. As the number of utilized cores per node increases, both the average and the standard deviation increase considerably. We infer that competition for CPU and cache space among co-located VMs causes significant performance fluctuations and overall degradation. On the High-CPU c1.xlarge instances, the best expected performance is obtained using from a quarter to half of the number of cores available. Amazon provides no quality of service guarantees on the number of VMs that might be multiplexed on a single hardware node, so this ratio is subject to change as Amazon changes the rate of multitenancy within EC2 nodes.
3000
2000
1000
4.
PERFORMANCE EXPERIMENTS: MULTIPLE NODES
In the previous section we described the significant benefits of the underutilization of resources on the performance of single-node computations. In this section, we extend our empirical analysis to parallel multi-node computations by measuring the HPL benchmark on a cluster composed of allocated EC2 instances. We execute HPL for one problem size, n = 50 k, on different clusters of EC2 instance types. We again observe significant performance improvements when underutilizing the resources on clusters of instances. In the rest of this section we show that not only does underutilization decrease the overall time to solution for computations across multiple nodes, sometimes adding extra nodes also increases performance and decreases marginal cost. We analyze the performance results on multiple nodes by determining the expected execution time using the arithmetic mean over many sample runs: on Intel instances we use 7–29 executions to determine the average, and on AMD instances, we use 3–11. The AMD instances have fewer runs because those instances became increasingly difficult to allocate starting in the Fall of 2009. We believe that those nodes were replaced by nodes with Intel processors in the availability zone that we used. We calculate average performance in GFLOPS by dividing the required flops for the operation (2n3 /3) by the average execution time of the samples. To demonstrate the effects of contention among clusters of multi-tenant VMs, in Figs. 7–9 we present the minimum
0 1
2
3
4
Number of cores
Figure 8: Average execution time of repeated HPL on m1.xlarge (Intel) by number of cores used per each node.
and average expected execution times (along with standard deviation) for different instance types, varying the numbers of nodes allocated and cores used. For each instance type we determined the minimum number of nodes needed to host a problem of size n = 50 k—HPL requires around 19 GB of RAM for the input\output matrix. As an example, in the case of c1.xlarge instances (7 GB of RAM per node), three nodes are required, and thus a maximum of 24 cores can be used. Using this minimum number of nodes, fully utilized, would typically provide the best performance in an unshared cluster environment. The total number of cores (total cores) corresponding to the minimum number of nodes is the maximum number of cores that we use in the experiment. In other words, we allow the use of extra (underutilized) nodes, as long as the number of cores involved does not exceed total cores. The execution times for the m1.large instances (not shown in a figure), which have two cores per node, improve when using both cores. In contrast, the figures show that on nodes
6000
0.6
Minimum 3 nodes Average 3 nodes Minimum 4 nodes Average 4 nodes
5000
Time (secs)
2 nodes 3 nodes
0.5
Average cost per GFLOP ($)
7000
4000
3000
2000
0.4
0.3
0.2
0.1
1000
0
0 1
2
4
6
1
8
2
Figure 9: Average execution time of repeated HPL on c1.xlarge (Intel) by number of cores used per each node.
3
Figure 10: Average cost per GFLOP ($/GFLOP) prorated to actual time spent for m1.xlarge (AMD) by number of cores used per each node.
0.18
2 nodes 3 nodes
0.16
Average cost per GFLOP ($)
with four or more cores, similarly to the single node evaluation, the average performance is substantially worse than the best performance. The variance on multiple nodes is smaller than the variance on single nodes, possibly because a conspicuous fraction of the execution time is spent on network overhead. The benefit of underutilization—that contention on memory is reduced—appears to extend to clusters of nodes. Although the interconnects used by Amazon are not specified, it is conjectured that nodes are typically connected with Gigabit ethernet [11]. It is not obvious that while using such a slow interconnect (compared to specialized HPC interconnects) the different CPU performance obtained with underutilization would have a tangible effect on the overall performance or whether the variation in CPU performance will have a significant effect on network performance. However, Figs. 7–9 show that underutilization is still effective for cluster computations. Moreover, using extra underutilized nodes can achieve better results. Fig. 9 demonstrates clearly that the expected execution time of HPL is faster using a 4 node cluster than using a 3 node cluster although the degree depends upon the level of underutilization. Note that the fastest expected execution time is obtained using 50% of a 4 node cluster, which is slightly faster than using 50% or more of a 3 node cluster even though the data easily fits within the RAM of the 3 node cluster. The 50% utilization is unsurprising because it was also optimal for expected execution time in the single node experiments. Using more nodes to achieve a quicker result is the opposite of what typically occurs on an unshared cluster with a slow interconnect where 3 nodes would perform better than 4 due to the reduced network overhead. The extra network overhead incurred on EC2 using 4 nodes is more than compensated by the extra parallelism. However, the computation time does not decrease linearly with the number of nodes; we infer that the extra network overhead remains significant. On a fixed cluster infrastructure, higher efficiency for each job increases the number of jobs that can be completed in a given time. Increasing overall throughput indirectly re-
4
Number of cores
Number of cores
0.14 0.12 0.1 0.08 0.06 0.04 0.02 0 1
2
3
4
Number of cores
Figure 11: Average cost per GFLOP ($/GFLOP) prorated to actual time spent for m1.xlarge (Intel) by number of cores used per each node.
duces costs per job since the cost of the cluster is typically fixed. On commercial clouds instead, each computation can be priced individually. We empirically studied the costs of using EC2 as determined by the execution time and instance types in our experiments. Figs. 10–12 provide the average cost for different instance types by utilized cores per node. To illustrate the marginal costs incurred when allocating a cluster to solve several problems, we calculate an average cost per GFLOP as the ratio between the (prorated) average cost to solution and the total GFLOPS achieved by the computation. This measure allows a rough estimation of expected cost for other problem sizes including other scientific applications that have similar computational needs. Since marginal cost is directly proportional to execution time, we include the standard deviation as well as the expected average cost. Figs. 11–12 show that the underutilization of resources on EC2 is not only a good approach from time to solution perspective, but it is also the most
0.4
12000
3 nodes 4 nodes
3 nodes 4 nodes 5 nodes 6 nodes 1 core (12.5%) 2 cores (25%) 4 cores (50%) 6 cores (75%) 8 cores (100%)
0.35
8000 0.25
Time (secs)
Average cost per Gflop ($)
10000 0.3
0.2 0.15
6000
4000 0.1 2000 0.05 0
0 1
2
4
6
8
0
0.5
1
1.5
Number of cores
Figure 12: Average cost per GFLOP ($/GFLOP) prorated to actual time spent for c1.xlarge (Intel) by number of cores used per each node.
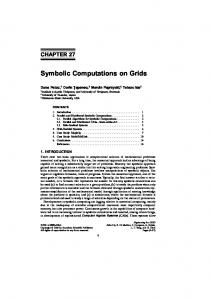
cost-effective strategy of using the commercial cloud. For instance, on the m1.xlarge (Intel) instances it is more costeffective to use only 75% of the available resources: the average cost is 18% less than when using all the cores. The results on the c1.xlarge instances are even more dramatic: it is more than 3 times cheaper to use 50% of the resources than 100%. In fact, for a 4 node cluster, any underutilization, even 12.5%, is more effective than using all the cores of each machine. There is clearly a tradeoff between price and speed in our EC2 cluster experiments. To demonstrate this tradeoff, we plot time to solution versus prorated cost for the HPL cluster evaluation. Fig. 13 refers to the c1.xlarge instance, and Fig. 14 combines the results from all instance types. In these graphs, closer to the origin is better. For all instance types except c1.xlarge, using fewer nodes is cheapest; for the c1.xlarge instance, an additional node can be added to get a noticeable speedup at the same cost. In this case, the extra parallelism speeds up the computation enough to offset the extra cost of the node. This is quite different from an unshared cluster with fixed costs. Fig. 14 shows that for our problem size underutilizing (by 50%) a c1.xlarge instances with 4 nodes is the fastest and most cost effective strategy. This strategy differs significantly from the expectation on an unshared cluster where performance is more stable and using fewer nodes is typically the optimal strategy.
5.
CONCLUSIONS
In this article we investigated the beneficial effects of underutilizing resources for high-performance computing in a commercial cloud environment. Through a case study using the DGEMM kernel and the HPL benchmark, we showed that the underutilization of resources can considerably improve performance. For instance, for some cluster configurations, on average the solution can be reached almost an order of magnitude earlier when the available resources are underutilized. The performance benefits for single node computations are even more impressive: underutilization can improve the expected execution time by two orders of magnitude. Finally, extending underutilized clusters by adding
2
2.5
3
3.5
4
4.5
Cost ($)
Figure 13: Time to solution versus prorated cost for c1.xlarge (Intel).
more nodes can often improve the execution time by exploiting more parallelism. In the best case in our experiments, the execution time was improved enough to entirely offset the cost of the extra node in the cluster, achieving faster computation at the same cost using extra underutilizes nodes. We presented the average execution time, cost to solution, and variance measures—traditionally ignored in the high-performance computing context—to determine the efficiency and performance of the commercial cloud environment where multiple VMs share a single hardware node. Under virtualization in this competitive environment, the average expected performance diverges by an order of magnitude from the best achieved performance. We conclude that there is significant space for improvement in providing predictable performance in such environments. Further, adaptive libraries that dynamically adjust utilized resources in the shared VM environment have the potential to significantly increase performance.
Acknowledgement The authors wish to acknowledge the Aachen Institute for Advanced Study in Computational Engineering Science (AICES) as sponsor of the experimental component of this research. Financial support from the Deutsche Forschungsgemeinschaft (German Research Association) through grant GSC 111 is gratefully acknowledged.
6.
REFERENCES
[1] Jack Dongarra, Robert van de Geijn, and David Walker. Scalability issues affecting the design of a dense linear algebra library. Journal of Parallel and Distributed Computing, 22(3):523–537, September 1994. [2] Gene H. Golub and Charles F. Van Loan. Matrix computations (3rd ed.). Johns Hopkins University Press, 1996. [3] Kazushige Goto. GotoBLAS. Available via the WWW. Cited 1 Jan 2010. http: //www.tacc.utexas.edu/resources/software/#blas.
12000
m1.large (Intel) m1.xlarge (Intel) m1.xlarge (AMD) c1.xlarge (Intel)
10000
Time (secs)
8000
6000
4000
2000
0 0
0.5
1
1.5
2
2.5
3
3.5
4
4.5
Cost ($) Figure 14: Time to solution versus prorated cost for different instance types.
[4] Argonne National Laboratory. MPICH2: High-performance and widely portable MPI. Available via the WWW. Cited 1 Jan 2010. http: //www.mcs.anl.gov/research/projects/mpich2/. [5] Jeff Napper and Paolo Bientinesi. Can cloud computing reach the Top500? In Unconventional High-Performance Computing (UCHPC), May 2009. [6] Paolo Bientinesi, Roman Iakymchuk, and Jeff Napper. HPC on Competitive Cloud Resources. In Handbook of Cloud Computing. Springer, 2010. [7] Antoine Petitet, R. Clint Whaley, Jack Dongarra, and Andrew Cleary. HPL - a portable implementation of the high-performance LINPACK benchmark for distributed-memory computers. Available via the WWW. Cited 1 Jan 2010. http://www.netlib.org/benchmark/hpl/. [8] Amazon Web Services. Amazon elastic compute cloud (EC2). Available via the WWW. Cited 1 Jan 2010. http://aws.amazon.com/ec2. [9] J¨ org Strebel and Alexander Stage. An economic decision model for business software application deployment on hybrid cloud environments. In Matthias Schumann, Lutz M. Kolbe, and Michael H. Breitner, editors, Tagungsband Multikonferenz Wirtschaftsinformatik, 2010. forthcoming. [10] TOP500.Org. Top 500 supercomputer sites. Available via the WWW. Cited 1 Jan 2010. http://www.top500.org/. [11] Edward Walker. Benchmarking Amazon EC2 for High-Performance Scientific Computing. ;login:, 33(5):18–23, October 2008. [12] Guohui Wang and Eugene Ng. The impact of virtualization on network performance of Amazon EC2 data center. In INFOCOM ’10: Proceedings of
the 2010 IEEE Conference on Computer Communications. IEEE Communication Society, 2010.