well as new analytic services and applications. While opti- .... The introduction of smart meters has led to fine grained data acquisition. The impact of smart ...
1
Improving Load Forecast in Prosumer Clusters by Varying Energy Storage Size Dejan Ili´c, Stamatis Karnouskos, and Per Goncalves Da Silva
Abstract—Forecasting already plays a crucial role in the current electricity grid as a key part of planning and energy management activities. Its role will be pivotal in the envisioned smart grid, as its stakeholders are expected to interact in realtime. The amount of data to be considered e.g., from the smart meters, will sky-rocket; however consistently accurate forecasting will still be needed in order for the smart grid stakeholders to make informed decisions and transact. Today forecasting efforts concentrate on increasing the accuracy of algorithms, especially by grouping energy producing or consuming entities such as the prosumers. However due to the dynamic nature of the smart grid, errors still remain as a result of dynamic and highly volatile events. The usage of distributed storage (potentially strategically positioned) that may exist in smart cities, such as electric cars, aggregations of residential storages, small scale industrial facilities etc., could be used in order to assist towards achieving better forecasting accuracy for groups of prosumers. The latter would enable them to participate in the new smart grid offerings such as smart city level marketplaces with more confident actions and strategies. We investigate here the role of distributed storage in residential areas, as well as a mean towards creating communities (groups) of prosumers that feature better forecast energy behaviour.
I. I NTRODUCTION
T
HE smart grid is a complex ecosystem of heterogeneous entities that can interact via modern information and communication technologies and benefit from the plethora of information that it brings [1], [2]. Its realization will empower advanced business services, offering to their stakeholders desired services [3] such as near real-time information, as well as new analytic services and applications. While optimal management of the highly distributed alternative energy resources that constitute the smart grid is sought, one has still to consider the physical limitations imposed by the grid. As supply and demand must be constantly in synchronization, production can be ramped up or consumption can be scaled down in order to maintain grid stability. Traditionally, the grid is balanced through an almost centralized control of the generation plants. Furthermore, in lieu of storage, the grid relies on “spinning reserves”, generation plants that are constantly on, waiting for signals from grid operators to inject power into the grid. Because they are always on, their usage is very costly. Although optimizing such a complex system is already a challenge, complexity grows further due the high penetration of Distributed Energy Resources (DERs). Some DERs are outside the grid manager’s control e.g., Renewable All authors are with SAP Research, Vincenz-Prießnitz-Straße 1, D76131 Karlsruhe, Germany, Contact Email: {dejan.ilic, stamatis.karnouskos, per.goncalves.da.silva}@sap.com
Energy Resources (RES) which produce energy intermittently [4]. Imbalance charges caused by load forecast errors may result in high penalties, but these costs are reduced by high aggregation of customers (and mitigation of costs). The lack of large-scale demand elasticity pushes most of the responsibility for balancing on the supply side. For stakeholders such as prosumers to be active in the new capabilities the smart grid offers, such as participation in smart city or neighbourhood marketplaces [2], [5], consistently accurate prediction is considered a business advantage as then more effective strategies can be formed. Today, with the Advanced Metering Infrastructure (AMI) in place, individuals can be included in the effort towards providing value-added information to all stakeholders [6]. Still, any forecasting algorithm would struggle to consistently meet the high-precision for the load-forecasting of an individual (e.g. a household). As such, forecast accuracy becomes a significant factor for the realization of prosumer Virtual Power Plants (pVPPs) [2], [7] from highly distributed resources. Results from previous work [8] show that clustering enables high prediction accuracy, even for a relatively small number of prosumers (e.g., 100) within a cluster. However, improving the prediction accuracy by clustering is not always sufficient to achieve the required accuracy. If a cluster of prosumers decide to create a pVPP, all the grid imbalances (as result of the prediction errors) occurring within the grid will lead to financial penalties. Therefore, all the electricity injected into– or extracted from– the electricity grid needs to be highly predictable within a cluster. The solutions to improve the predictability are well known for the highly volatile systems such as wind farms [9]. In a similar fashion, in this work we investigate how energy storage mechanisms can improve predictability of pVPPs. While significant ongoing work focuses on forecasting algorithms as such, we here investigate how we can take advantage of the potential existing distributed storage in order to improve the forecasting of clusters. In this work we do not focus on any specific aspects on the nature of the distributed storage which could be composed of multiple heterogeneous resources such as fleets of electric cars, residential storage, small industry storage (e.g. supermarket refrigeration units) and generally any kind of facility that could act like so. The work presented here focuses on investigating how storage sizing impacts the predictability and affects its behaviour. II. B USINESS R ELEVANCE Predictability plays a pivotal role to any strategic or business decisions the smart grid stakeholders will take. Advanced al-
2
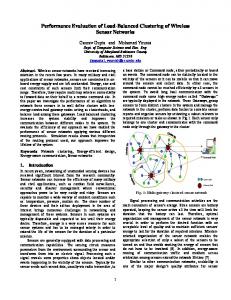
gorithms may not be sufficient to achieve the required forecast accuracy to economically sustain the costs of imbalances of a stakeholder. Meaningful integration of VPPs [10], especially as we face significant increase in complexity for smart grid management due the high penetration of DERs is sought. Their forecast accuracy is improved simply by aggregation of numerous DERs into the virtual equivalent of a large power station. The same can be applied to prosumers, as it is in their best interest [7], [11], where their aggregation can allow new business opportunities. Acting together they can become predictable as a virtually created cluster [12], accurate even for small number of prosumers within a cluster [8]. As predictability converges, distributed storage is identified as a mechanism to further improve it [4]. Its application is well known in wind farm prediction scenarios [9] to meet the expected (or reported) behaviour. This work considers the impact of distributed storage that may be available in various forms within a smart city and its impact on the predictability of virtual clusters. With fine-grained information coming from the smart grid, one can further analyse the associated costs of the predictability in such clusters. If highly predictable clusters can be created, understanding the costs of their lowest prediction errors may result to costs lower than retailer’s (mostly static from a point on) service fees (as depicted in the Figure 1).
benefits are not only on the grid management side but also for the participants of a pVPP. III. F ORECAST ACCURACY IN A C LUSTER The introduction of smart meters has led to fine grained data acquisition. The impact of smart metering data aggregation on load forecasting [8] shows that a rapid increase in predictability could be achieved even for smaller clusters of consumers e.g. 160 smart meters. One of the forecast algorithms applied in that work is the Seasonal Na¨ıve (SN) which uses values from previous day (season) as the forecast value for the current day [14]. Since the SN algorithm was demonstrated to be good enough when compared with the (more sophisticated) HoltWinters exponential smoothing algorithm [8] for our dataset, it was also chosen for this work. Following the same reasoning as discussed in [8], the realworld data of the NOBEL (www.ict-nobel.eu) project trial is used to measure predictability of individual smart meters. The original data set is filtered in order to acquire a high number of smart meters with the highest number of measurements (more then 50%). The resulting set M had N = 3564 smart meters without sampling interruption from 15-Aug-2012 to 15-Sep2012 (31 days in total). Figure 2 shows the individual MAPE distribution for each smart meter of the set M .
Automated forecast
0.005
Economical point
0.000
Retailer forecast
Density
balancing costs
0.010
0.015
Economical point
0
# of devices
50
100
150
200
250
MAPE
Figure 1. A predictable cluster may outperform a retailer (lower service costs)
Figure 2. Individual prediction accuracy of the set is poor
Additionally predictability is the key aspect to enable fully automatized brokerage agents to act on behalf of such cluster. In such scenarios, the earliest the “economical point” (as depicted in Figure 1) is achieved, the better the benefits for the end-users might be. Similarly, predictable clusters can participate in a more cost-efficient way on an electricity market. Better forecasting coupled with a pVPP allows even residential prosumers to potentially participate more costefficiently on an local electricity markets [2], [5]. From the increased predictability benefit also participants of Demand Response (DR) programs, as once load can be reported in advance, DR effectiveness does not need to be approximated [13], but rather directly measured. Hence it is in the benefit also of the infrastructure managers e.g., DSO to have larger clusters of prosumers (e.g., pVPPs) that would have the necessary footprint (due to the high number their members) to assist in critical situations by adjusting their load. However,
As expected, only few smart meters resulted in being highly predictable, while some demonstrate very stochastic behaviour. Overall, the individual load forecast of M resulted with a high error measured in an average MAPE of 47.35. In order to improve their predictability, different aggregation levels were analysed. Aggregation is done by randomly selecting n smart meters from M into a cluster G ⊆ M , without repetitions. The time-series data for each smart meter is then aggregated to produce a single time-series (for measures of 15 minutes intervals) for the cluster. The experiment is repeated 50 times for every cluster of size n, denoted as Gn , with an incremental step of 20 for the spectrum n = [20, 400] . The box plot in Figure 3 shows how MAPE of M converges as the SN algorithm is applied to time series growing values of n. The figure confirms that aggregation level n increase brings rapidly M to its MAPE convergence, while stochastic behaviour of the individuals diminishes by clustering. Slightly
30
30
25
25
Average MAPE
Average MAPE (%)
3
20
20
15
15
10 10
0
50
100
150
Average Power (kW) 20
40
60
80 100 120 140 160 180 200 220 240 260 280 300 320 340 360 380 400
Cluster size
Figure 3. Clustering effect on the prediction accuracy (MAPE)
higher values of MAPE are not a surprise, since SN algorithm introduces errors for three days per week (Saturday, Sunday, Monday) and has no trend component applied (while it is important in selected period due the temperature drop). However, having low MAPE values are not critical for evaluation in the following sections, while being able to compare the predictability convergence of different data set is. Although the number of smart meters within the cluster is relevant to business analysis, values are not comparable to different use cases. For example, the average consumption of a household in Spain may be different from an average household in Germany. Having said that, this work proposes to extend analysis by measuring comparable units i.e., the impact on predictability by clustering is therefore measured by average power consumption hP i. The analysis of the average power distribution of the individuals showed that no individual consumes more than 2kW within M , while the set resulted with the mean of individual average power of hP M i = 0.33kW . Since every cluster is made by random selection from M , it is expected that an average cluster power hP G i is in direct dependence of hP M i. Therefore, the average power of a cluster can be approximated n by its size as hP G i = hP M i ∗ n. Figure 4 depicts the same results that Figure 3 does, where every cluster G is presented by its measured (not calculated) average power hP G i. As expected, the behaviour depicted clearly represents the behaviour of Figure 3, while results on Figure 4 are now comparable to other sets. This representation did not only offered comparability, but now one can also approximate absolute value of the energy error Ee of a cluster G Ee = M AP E(G) ∗ hP G i Although the average power representation holds additional information, the representation via cluster size (Figure 3) brings forward the business information. As an example, its business relevance can be as simple as costs to be paid for every smart meter connected to the electricity grid. As this information can be included in evaluation of the economic sustainability of a cluster, both types of figures are found to
Figure 4. The prediction accuracy in a cluster is impacted by its power requirements
convey a key message towards the realization of pVPPs. IV. E NERGY S TORAGE S YSTEM R EQUIREMENTS FOR ACCURACY I MPROVEMENT Different RES also imply the usage of different techniques to maintain their predictability e.g. wind farms can brake turbines from spinning if power exceeds a generation setpoint. However, due the wind unpredictability their set-point needs to be set low, where predictability is high enough (since turbines can be stopped). Once turbine starts braking, until fully stopped, its potential to produce energy is wasted. For that reason, wind farms try to improve their business by applying different types of storage [4]. Since the unpredictability of wind farms can be improved by a storage component, the same methodology can be applied to create the predictable clusters. The forecast improvement by clustering, presented in the section III, is expected to be further improved by adding a storage component. Here we investigate the potential improvement by simulating a storage components of varying size, with no storage efficiency or control applied. Therefore, the actual energy load El (positive or negative) applied to the storage component, for every point within a cluster time series (i.e., intervals of 15 minutes) can be described as if Ee > 0 & ESOC = Emax 0, if Ee < 0 & ESOC = Emin 0, Emax − ESOC , if Ee ≥ Emax − ESOC El = Emin − ESOC , if Ee ≤ ESOC − Emin Ee , else, where Emin and Emax are storage capacity limits and ESOC is its current state of charge. The described component is then used to carry out multiple simulations and measure the impact of different storage sizes on reduction the forecast errors Ee . In other words, as ESOC has cumulative characteristics, every interval simulation of a cluster where Ei = |Ee | − |El | > 0 is considered as load imbalance. Every simulation is repeated 50 times for every cluster size n and every storage size, where storage capacity c is calculated individually for each cluster
4
c(G, s) = hP G i ∗ 24 ∗ s, where s is used for defining percentage of cluster’s average daily energy usage. Finally, a cluster of size n and storage size s is denoted as Gns . Figure 5 visualize the results of simulations for storage sizing s = [0%, 16%] in power of 2, to show how MAPE is affected by both improvement methods.
are reduced by average cluster power and applied storage. For visualization purposes, the points depicted only show the imbalances provoked by the simulations without any storage (s = 0%) and the trend line offers quantitative approximation of provoked electricity imbalances.
10000
G as
0
Storage %(s) 2 4 8
16
8000
25 Storage s = 0%
kWh
s=8%
4000
s=16% 10
2000
Average MAPE(%)
s=4% 15
6000
s=2%
20
5
0
0 0
50
100
150
200
250
300
350
400
450
Cluster size
0
20
40
60
80
100
120
140
kW
Figure 5. Measuring impact of a storage to improve prediction accuracy of clusters
The simulation results confirm that the storage increase results in faster convergence and reduction of MAPE. For s > 0% we see that smaller storage has a much higher impact on the predictability improvement, than bigger ones. As an example, for n = 200 there is a noticeable average MAPE reduction for first 2% increase by 200 M AP E(G200 0 ) − M AP E(G2 ) = 3, 5%,
than the second increase 200 M AP E(G200 2 ) − M AP E(G4 ) = 1, 3%.
Every increase in capacity follows the same behaviour, until capacity increase seems to be of minor importance e.g., average MAPE improved only for 300 M AP E(G300 14 ) − M AP E(G16 ) = 0, 25%.
Finally, results confirm that a small cluster with a storage component can have the forecast accuracy of an approx. 4 times bigger cluster (without storage). For example, clusters of size n = 60 with s = 2% are expected to average around M AP E(G60 2 ) = 9, 89%, while clusters of n = 300 with no storage average around M AP E(G300 0 ) = 9, 67%. Such a small difference (0, 22%) is only possible due the fact that predictability converges much faster with storage increase, while same difference without storage equals to
Figure 6. Absolute forecast error (kW h) in dependence of the cluster average power (kW ) and available storage capacity
The increase of s also has a saturation point, where further storage expansion would not make any significant improvement. Figure 6 shows how improvement for storage sizes close to s = 16% progress almost in parallel. Although this may depend on the algorithm prediction (in this case SN), one should expect even faster saturation if more robust algorithms are applied. Hence the economical significance of the storage needs to be evaluated as at some points its further expansion will not significantly impact the predictability of a pVPP. We can see that capacity has a critical impact, even if this corresponds to a minimum percentage of the daily energy usage. It is important to mention that prediction algorithms play a key role here. The simplicity of the SN algorithm can assist towards understanding the importance of storage. Even with storage availability, it is important to keep the positive prediction error as close as possible to the negative error in order to keep ESOC of a storage in the middle of its capacity. One way is to keep ESOC in the middle is the storage control, which has much higher impact than capacity increase. It is already shown that storage can be used more efficiently through control [15]. In order to meet optimal storage sizing, the same type of simulation needs to be executed with different strategies for storage control. Every case individually (e.g. neighbourhood of interest) needs to be simulated to understand how different s affects its individual imbalances Ei .
300 M AP E(G60 0 ) − M AP E(G0 ) = 5, 67%.
Understanding how different s affects the imbalance Ei of a cluster, is crucial towards realization of pVPPs. Simulations of different storage sizing will lead to evaluating quantitatively the impact on the imbalance reduction (that is relevant for further economical analysis). For this purpose, the trend lines on Figure 6 depict values obtained from the same experiment of Figure 5, but the trend lines show how load imbalances
V. R EAL W ORLD V ERIFICATION Although the pVPP concept may be appealing, the creation of a highly predictable one is challenging. Not all the clusters are equally predictable, therefore selection of a reliable one is highly relevant for this work. A potential constellation of a cluster is to include prosumers with a physical proximity to a storage unit. For demonstration purposes, a cluster of the real
5
Average MAPE (%)
Absolute imbalance reduction(MWh)
Storage size (MWh)
MAPE
12
6
10
5
8
4
6
3
4
2
2
1
0
MWh
electrical grid prosumers is selected to represent the pVPP; this is depicted Figure 7 as a polygon that identifies the cluster.
0
0
2
4
6
8
10
12
14
16
18
20
Storage capacity (%)
Figure 8. Capacity increase is reducing the cluster prediction error
0.004
Storage % (s) 4 8
16
0.002
Density
0.003
0
0.001
The selected cluster contains 186 smart meters with average power consumption of hP i = 63, 74kW and its MAPE is measured to be 11, 43. Its predictability is considered to average from entire set of the NOBEL trial. Within the cluster, individual power consumption averages around 0, 34kW . Individual MAPE from all the prosumers is as well measured with an average of 49, 75. As one can immediately notice, predictability within the cluster is almost 5 times better, then individual average. If measured in kWh for the same period defined in section IV, the total energy consumed from the cluster is approx. 47, 4M W h. If loads are predicted individually, the absolute prediction error results in 23, P 5M W h (49.6%), while the cluster had an error of only Ei = 5, 6M W h (11,8%). Considering a storage the cluster accuracy can be further improved as we will see at the second stage of the analysis. Since the Monte Carlo approach was used in previous experiments, in particular for results shown in Figure 6, no information on achieved imbalance reduction of a cluster is shown by applying different sizes of the storage. Figure 8 demonstrates not only how much reduction of energy imbalances due prediction error is achieved, but also the progress of the cluster’s MAPE by expanding storage capacity. Figure 8 shows that linear increase in the storage size, is not followed by linear improvement of the MAPE for the selected period. Without having linear improvement of MAPE, reduction in energy deviations are expected to behave the similarly. Depicted reduction in imbalances needs to be considered in an economical evaluation of a cluster, as costs of the storage capacity may exceed value of it savings. For comparison, 2% of the cluster’s daily average energy consumption is equal to battery capacity of approx. 2-3 electric cars. In this simulation, the real energy load from consumers participating in the NOBEL project’s field trial have been used. However, what is not easily measurable is the performance of a forecasting algorithm used for the simulation evaluation. As one can imagine, the better the algorithm, the less storage
0.000
Figure 7. Clustering prosumers in a GIS-aware system by physical proximity
for its imbalances is required. A simple algorithm like SN is sufficient to show impact of the storage, and especially the distribution of the storage requirements if no limits are applied. Figure 9 depicts the density function of the cumulative energy error Ei for the selected cluster.
−400
−200
0
200
400
600
kWh
Figure 9. Consecutive error highly related to error in between the forecast and actual load
Higher peaks in Figure 9 identify density functions of the prediction with the bigger storage sizes. In fact, such a peak identifies that due the insufficient storage capacity, the cumulative error of Ei reached the certain point, but it was more stable at that point than the distributions with the lower peaks. Figure 9 also shows a high deviation towards requirement for the positive storage capacity. Since energy loads in general have high correlation to the environmental temperature, the selected time frame for the experiment has a continuous load drop (due to the reduced usage of air-conditioning) and the selected SN algorithm considers trends, we see a growing capacity requirement. Such forecasting errors need to be carefully understood in the context of the storage requirements and how they can be reduced by controlling the storage. Furthermore, realization of a pVPP will require simulations over longer time periods (one or more years), in order to guarantee that most direct and indirect indicators affecting the load prediction algorithms are measured for a different storage
6
sizes, before final decision on its size is made. VI. C ONCLUSION Improving predictability might be of key importance towards realizing pVPPs and empowering their market-driven activities, as consistently accurate forecasts will form the basis for any strategies to be followed in these interactions. Although reducing forecast errors by clustering prosumers [8] can be achieved, prediction algorithms are still sensitive to smaller levels of aggregation. The potential availability of distributed storage in smart cities e.g., electric car fleets, small industry storage capabilities etc. may be used to enhance the forecasting within a prosumer cluster (pVPP). Predictability of a virtual cluster, being enhanced by applying storage of different sizing, is to be measured. Its impact is therefore further investigated on a real world example, where physical proximity to a storage unit is identified as potential case for creation of a pVPP. Once a cluster (pVPP) is created, storage systems of different capacity are considered in the simulation. The experiments carried out show that the improvement of the prediction accuracy is highly (exponentially) impacted by adding storage. Interestingly, forecasting accuracy of such clusters displays rapid increase even for small storage capacities e.g., that match a low percentage of the total cluster’s average daily usage. It was concluded that it is not a random effect, but rather applicable to any cluster of prosumers. In this work the high impact of the storage has been demonstrated, even for a simple load forecasting algorithm. Although we identified the high importance of the equipping a pVPP with a storage unit, additional work need to be done for the economical assessment. For simplicity no storage controlling (which further improves storage efficiency [15]) was considered here, nor efficiency of a specific storage technology. In future one should evaluate impact on both technical and business level, which is expected to be significant. Finally, more sophisticated forecasting algorithms should be applied and apply usage if direct and indirect indicators to improve the load prediction [12]. ACKNOWLEDGMENT The authors would like to thank the partners of European Commission co-funded projects SMARTKYE (www. smartkye.eu) and NOBEL (www.ict-nobel.eu) for the fruitful discussions. R EFERENCES [1] R. Katz, D. Culler, S. Sanders, S. Alspaugh, Y. Chen, S. DawsonHaggerty, P. Dutta, M. He, X. Jiang, L. Keys, A. Krioukov, K. Lutz, J. Ortiz, P. Mohan, E. Reutzel, J. Taneja, J. Hsu, and S. Shankar, “An information-centric energy infrastructure: The berkeley view,” Sustainable Computing: Informatics and Systems, 2011. [2] S. Karnouskos, “Demand side management via prosumer interactions in a smart city energy marketplace,” in IEEE International Conference on Innovative Smart Grid Technologies (ISGT 2011), Manchester, UK, Dec. 5–7 2011. [3] P. Goncalves Da Silva, S. Karnouskos, and D. Ilic, “A survey towards understanding residential prosumers in smart grid neighbourhoods,” in The third IEEE PES Innovative Smart Grid Technologies (ISGT) Europe, Berlin, Germany, 14–17 Oct. 2012.
[4] C. Rasmussen, “Improving wind power quality with energy storage,” in Sustainable Alternative Energy (SAE), 2009 IEEE PES/IAS Conference on, Sep. 2009, pp. 1–7. [5] D. Ilic, P. Goncalves Da Silva, S. Karnouskos, and M. Griesemer, “An energy market for trading electricity in smart grid neighbourhoods,” in 6th IEEE International Conference on Digital Ecosystem Technologies – Complex Environment Engineering (IEEE DEST-CEE), Campione d’Italia, Italy, Jun. 2012. [6] D. Ilic, S. Karnouskos, and P. Goncalves Da Silva, “Sensing in power distribution networks via large numbers of smart meters,” in The third IEEE PES Innovative Smart Grid Technologies (ISGT) Europe, Berlin, Germany, 14–17 Oct. 2012. [7] S. Karnouskos, “Communityware smartgrid,” in 21st International Conference and Exhibition on Electricity Distribution (CIRED 2011), Frankfurt, Germany, 6-9 June 2011. [8] D. Ilic, S. Karnouskos, P. Goncalves Da Silva, and M. Jacobi, “Impact assessment of smart meter grouping on the accuracy of forecasting algorithms,” in 28th ACM Symposium On Applied Computing (SAC), Coimbra, Portugal, 18 – 22 Mar. 2013. [9] M. Korpaas, A. T. Holen, and R. Hildrum, “Operation and sizing of energy storage for wind power plants in a market system,” International Journal of Electrical Power & Energy Systems, vol. 25, no. 8, pp. 599–606, 2003, 14th Power Systems Computation Conference. [Online]. Available: http://www.sciencedirect.com/science/ article/pii/S0142061503000164 [10] D. Pudjianto, C. Ramsay, and G. Strbac, “Virtual power plant and system integration of distributed energy resources,” Renewable Power Generation, IET, vol. 1, no. 1, pp. 10–16, Mar. 2007. [11] G. Chalkiadakis, V. Robu, R. Kota, A. Rogers, and N. R. Jennings, “Cooperatives of distributed energy resources for efficient virtual power plants,” in The 10th International Conference on Autonomous Agents and Multiagent Systems - Volume 2, ser. AAMAS ’11. Richland, SC: International Foundation for Autonomous Agents and Multiagent Systems, 2011, pp. 787–794. [Online]. Available: http://dl.acm.org/citation.cfm?id=2031678.2031730 [12] S. Aman, Y. Simmhan, and V. K. Prasanna, “Improving energy use forecast for campus micro-grids using indirect indicators,” 2012 IEEE 12th International Conference on Data Mining Workshops, vol. 0, pp. 389–397, 2011. [13] J. Mathieu, P. Price, S. Kiliccote, and M. Piette, “Quantifying changes in building electricity use, with application to demand response,” Smart Grid, IEEE Transactions on, vol. 2, no. 3, pp. 507–518, Sep. 2011. [14] R. J. Hyndman and G. Athanasopoulos, “Forecasting: principles and practice,” 2012. [Online]. Available: http://otexts.com/fpp/ [15] T. Brekken, A. Yokochi, A. von Jouanne, Z. Yen, H. Hapke, and D. Halamay, “Optimal energy storage sizing and control for wind power applications,” Sustainable Energy, IEEE Transactions on, vol. 2, no. 1, pp. 69–77, Jan. 2011.