Key-Words: - Production planning, Food processing, Productivity, Simulation models, Business Process .... paperwork, a call center, distribution center, or any.
12th WSEAS International Conference on SYSTEMS, Heraklion, Greece, July 22-24, 2008
Improving Productivity in Food Processing Industries Using Simulation - A Case Study SERAJ YOUSEF ABED Department of Industrial Engineering King Abdulaziz University P. O. Box 80204, Jeddah - 21589 SAUDI ARABIA
Abstract: - Process optimization is a major decision problem when drawing a balance between meeting variable demands and maintaining the quality of products in food processing industries. Simulation is a useful technique to study the effects of system changes in production processes. A case study conducted in a Rusk manufacturing company in Saudi Arabia gives the template for the reported work. An Arena simulation model was developed to analyse the effects of the processes involved on the productivity of the production line. Various scenarios representing different production setups were tried for running the model. Optimal conditions of production under which productivity can be improved were arrived at. The changes made in the production line resolved all bottlenecks, improved utilization of all machines, eliminated most of the queues at many production stations. An increase of about 50% in production and a decrease of 11.4% in average total time for a box of Rusk in the system were achieved for an additional capital investment that can be paid back in 35 days from the additional expected profit.
Key-Words: - Production planning, Food processing, Productivity, Simulation models, Business Process Reengineering. simple interactions. However, when the response depends on proportions of ingredients, such as in chemical or food formulations, factorial designs may not make sense. Mixture design offers a better solution procedure to analyze the dependence of the response variable, namely quality of food, on the proportionality of ingredients. However, the cost of time, precision required, and materials involved may not justify such experiments. Simulation, being a 'what if' experiment, is a useful technique to study the effects of system changes, in the processes involved as well as the proportion of ingredients. A case study conducted gives a template for action. The results of the simulation revealed the bottlenecks at various stages of the production. The Arena model provided the platform where virtual experiments are conducted to study independent solutions. The Rusk Company in Jeddah has the largest market share in the Saudi Rusk market. The company produces two main types of Rusk with different flavors, one with white flour and the other with whole wheat. The main goal of the work is to build a simulation model to study the effects of the processes involved on the productivity of the Rusk
1. Introduction The extreme fluctuations in the demand pattern of food products in the Kingdom of Saudi Arabia is unique to the country and is primarily due to the enormous floating population which amounts to about 8 to 10 million annually-represented by visitors (Pilgrims) visiting the holy lands; Makkah and Madinah. Drawing a balance between meeting this variable demand and maintaining the quality of food products is a challenging decision problem of the Kingdom's food processing industry. Process optimization turns out to be a major concern of the management in such situations. Process optimization is an application area where Design of Experiments (DOE) has found a niche of its own. A simple, but effective, strategy of experimentation involves optimizing the formulation via mixture design, and optimizing the process with factorial design and response surface methods. Industrial experimenters typically turn to two-level factorials as their first attempt at DOE. These designs consist of all combinations of each factor at its high and low levels. With large numbers of factors, only a fraction of the runs is needed to produce estimates of main effects and
ISBN: 978-960-6766-83-1
596
ISSN: 1790-2769
12th WSEAS International Conference on SYSTEMS, Heraklion, Greece, July 22-24, 2008
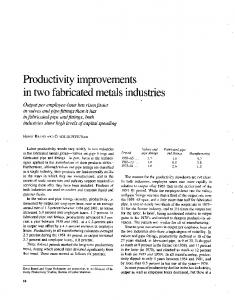
production line and to find optimal conditions of production under which the productivity can be enhanced. The objectives of the project included an in-depth study of the production processes involved, analysis of these processes in details, finding out the ways and means by which these processes can be optimized. A schematic diagram representing the production processes is shown in Figure 1. Stage 1
Stage 2
Stage 3
Preparation of basic Materials, for Rusk & Dough Making
Mixing, dividing, Fermentation of Dough, and mold filling
First Proffing, Molding and final Proffing
Stage 5
Stage 4
Rusk Packaging and Storage
Dough Baking and Changing Moulds Cooling, Bread Sliding & Toasting
2. Problem Formulation 2.1 Literature Review Fisher Len [5] points out that the application of scientific analysis called Baconian science to food production dates back to Francis Bacon. The search review also revealed that the most commonly applied optimization technique in food processing areas is response surface modeling (Bang Julio R. et.al.[4]. Response Surface Methods (RSM) was introduced in the 1950s associated with design of experiments methods (Box, Hunter & Hunter,[1]; Myers & Montgomery,[8]). Hammami Chokri et.al [2] presents a central composite design of RSM taking working pressure (P) and heating plate temperature (T) as the most important factors affecting the kinetics of the freeze-drying operation for apple slices as well as the criteria of final product quality (appearance/shape, color, texture, re-hydration ratio). By superimposing all quality criteria contour plots, the optimum levels of processing conditions yielding the best quality freeze-dried apple slices, they arrived at the optimal values of the operating pressure as 50 Pa, and heating plate temperature of 55 °C. Although the usefulness of RSM in certain conditions must be recognized, this approach has a number of important drawbacks due to the empirical, local, and stationary nature of the simple algebraic models used. Anderson Mark J. and Whitcomb P.J.[10] points out the drawbacks of using two-level factorials which consist of all combinations of influencing factors at its high and low levels. With large numbers of factors, only a fraction of the runs needs to be completed to produce estimates of main effects and simple interactions. However, when the response depends on proportions of ingredients, such as in chemical or food formulations, factorial designs may not make sense. They prove their argument quoting a case study on lemonade processing. In contrast, a number of powerful model-based optimization methods have been developed during the last decades which use more rigorous, time-dependent models. These model-based optimization methods have great potential for improving food processing. Simeonov S. and Simeonovová J.[12], discussed the potential uses of simulation for increasing productivity and profit, by reducing cycle time, improving due-date performance, reducing work in progress (WIP), providing plant-wide synchronization, etc. through a case study on coffee production. Synchronization of production capacity and material inputs to meet the promised delivery dates are simulated through a model that
Fig.1. Processes in Rusk production The production line of the Rusk has been divided into five general stages, namely preparation of the basic materials for Rusk & dough making, dividing and fermenting the dough and moulds filling, dough baking and cooling, bread slicing and toasting and finally Rusk packaging and storage. The entire production process consists of around 56 activities of which 17 activities are focused on for the research reported here. The selection of these seventeen activities was made based on the fact that these are directly associated with the actual production processes and include all production activities right from moving the trolley carrying the long dough prepared at the early stages to the proffer, fermentation of the dough, moving trolley to the baking ovens, baking the dough, cooling the bread, moving the trolley to the baskets area, unpacking breads from metal moulds, placing bread in the baskets, transporting baskets to the trolley, moving the trolley to waiting area before carrying them to the refrigerator, the bread waiting, and finally moving the trolley to refrigerator for cooling purposes. After cooling the toasted Rusk slices on the conveyor they are packed in the packaging section and ready for dispatch.
ISBN: 978-960-6766-83-1
597
ISSN: 1790-2769
12th WSEAS International Conference on SYSTEMS, Heraklion, Greece, July 22-24, 2008
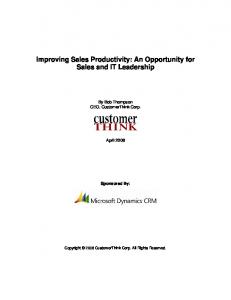
Submodel-3: The logic of this sub model is to simulate cutting and slicing the bread then toasting it, cooling it on the conveyor and finally packing and packaging the Rusk produced. Submodel-4: Terminating sequential-sampling control logic, this sub model is used to determine the required number of replications (i.e. sample size), to get a 95% confidence-interval half width of certain output performance measures. Data on arrival rates, inter-arrival times, waiting times and activity times were collected for those activities. The data were fed to the Input Analyzer application of Arena for analysis to obtain the statistical parameters of the raw data (Figure 2).
incorporates roasting, grinding and packaging processes. They obtained the basic features of the coffee production system, solutions for scheduling and capacity planning problems, and optimization. A module of the simulation software is used for improving the current structure of the production system. Garay Loza M. and Flores R.[6] focused on the flow characteristics of the product through the flour mill at the total flow rate. This is considered following a flow with normal distribution patterns. The model describes the flow of total matter in a stochastic analysis. The mass flow is linked directly to wheat attributes and to the specific process conditions of the pilot mill. Minegishi and Thiel [11] discuss the industrial management behavior in food industries where products have short or long manufacturing processes and short or long expiry dates. Three simulation models were tried by them according to the duration of the manufacturing processes and the expiry dates. Bailey K. et.al [7] presents a simulation study on dairy farms focusing on the evaluation of the impact of economies of scale on the profitability of alternative unit sizes. It is quite evident from the literature review that statistical and simulation techniques had been tried in various fields of food processing. It is felt that probably the DOE is more appropriate in food processing area, where experiments with various mixtures and combinations of food components are used until the expected results are arrived at. On the other hand simulation is proved to be efficacious in virtual experiments of food production. The literature review also reveals that simulation technique is more suitable in production areas.
Trolley Arrival 6+Gamm a (0.423, 0.385)
Store in Refrigerator
Baking Oven * 4 4 Resourses Oven1: 32.3Weibull (0.981, 2.35) Oven2: TRI (22, 23, 24) Oven3: TRI (22.4, 23.2, 24.5) Oven4: TRI (22.6, 23.3, 24.6)
Mold Changer Normal (7.46, 0.306)
Fan Cooling 10+Exp (0.191)
Fig. 2. Results from Input Analyzer
2.3 Verification and Validation In the Rusk production line, model verification and validation steps were implemented. For verification, the animation method was used to show the entities movement inside the model and to ensure that the movement is similar to what the designer think it should be. Validation of the Arena model was done by comparing the model output with the real system output. For the sake of validation, the number of produced Rusk boxes per day was 2280, while the real system production rate per day is 2100 boxes, which is pretty valid. The nature of this production system is a steady state –not a terminating system-because it works continuously for 24 hours a day and 7 days a week. Therefore we needed to warm up the model to reach to steady state condition before collecting any statistics to get good unbiased results. The warm up period for the simulation model was determined by the Arena Output Analyzer on the basis of the oven utilization. It is clear from figure 3 that 'warm up period' is very small. These statistics include utilization of the resources, number of entities in the
2.2 The Simulation Model Arena 10.0, which is one of the most powerful software for simulation, was used to build the model. As seen in the literature review, simulation is one of the useful techniques for conducting studies in food production. It could be a system for handling paperwork, a call center, distribution center, or any other systems that result in products or services (Kelton D. et.al, [3]). The Rusk production line model consisted of four sub models namely: Submodel-1: This sub model simulates the process of mixing raw materials for dough making, dividing it to small pieces, circulating and fragmenting these pieces and finally molding it. Submodel-2: The main feature of this sub model is to simulate the molded dough in the proffer and baking ovens, followed by the cooling process.
ISBN: 978-960-6766-83-1
Oven Proffer Resourses Const (30)
598
ISSN: 1790-2769
12th WSEAS International Conference on SYSTEMS, Heraklion, Greece, July 22-24, 2008
at 95% confidence levels. All the scenarios were used to build the simulation models, which were run using Arena software. It is to be noted that the criteria for scenario creation for improvement are based on the average waiting time of Rusk boxes in the system as well as the queue, and the number of Rusk boxes produced. These improvement scenarios were defined and developed as follows: 1) Addition of a center cutting machine: In the current system (as shown in Table 2) the bottleneck appears in the basket trolley area (BTA), the center cutting area causes this bottleneck since the bread in basket trolleys in the cooling room have to wait for long time until the center cutting machine is available. Therefore, the focus is for an improvement in the center cutting area. The results of this improvement are shown in Table 3. From scenario 1, the bottleneck moved to the next area which is the slicing machine area. 2) Addition of a center cutting machine and a slicing machine: Now the improvement should be at the slicing area. Results of this new scenario are given in Table 3. An examination of the results shows that the bottleneck has now moved from the basket trolley area, cooling room, center cutting machine area and slicing machine area to the toaster area. 3) Increasing the toaster length by 5 meters and employing one man to feed the trolley: In order to overcome the bottleneck appearing at the toaster area, the third scenario is created by increasing the length of the toaster by 5 meters and adding one more man to feed the trolley. The results of this scenario are presented in Table 3. It can be seen now that the bottleneck moved to the cutting machine area where the cutting, rolling and intermediate proffer machines are located. 4) Changing the cutting, rolling and intermediate proffer machines: The fourth scenario is created to overcome the bottleneck now appearing at the dough cutting machine area, by changing the cutting, rolling and intermediate proffer machines. This change is brought about by replacing the old machines with new high speed machines of 6 minutes per container. All the three machines had to be simultaneously replaced because changing one of them will cause bottlenecks to appear at the other two machine locations. The results of this scenario are presented in Table 3. 5) Changing the long dough machines: It can be seen now that the bottlenecks have moved from the dough cutting area to the long dough
Oven Utilization
system, number of entities out of the system, number of entities in the queue
Time →
Fig 3.Warm Up period and Oven Utilization Results
3 Problem Solutions 3.1 Simulation runs From the first run of the simulation model it was clear that utilization of the ovens (47.53%, 77.10%, 69.91%, 60.46%, 50.19%and 50.16%) are all quite low (Table1). Thus an increase in the utilization of the ovens would amount to the achievement of the main objective of the study namely, increase in the production. After executing the simulation runs, eight bottlenecks areas in the system were identified. Table 2 summarizes these bottleneck areas as the basket trolley area (BTA), cooling room (CR), basket trolley in cooling room for centre cutting machine (BTCCM), center cutting machine (CCM), men who feed trolleys (MFT), hold container area (HCA), cutting machine process area (CMP), and basket trolleys in center cutting machine for slicing machine (BTCSM). Productivity measures for the production stage under consideration are the 'average number of Rusk boxes produced', and the 'average total time for boxes in the system'. Thus the objectives of the simulation experiment were set as to minimize the first variable and maximize the second. Besides, average number of Rusk boxes in queue, average waiting time in queue was determined under all the eight bottleneck areas.
3.2 Improvement Scenarios Seven scenarios were tried for the simulation experiments to determine the optimal conditions of Rusk production. They are presented in Tables 3 to 9. Several new modules were added to the initial model to create these scenarios for the simulation runs. In each case the number of replications was 3,
ISBN: 978-960-6766-83-1
599
ISSN: 1790-2769
12th WSEAS International Conference on SYSTEMS, Heraklion, Greece, July 22-24, 2008
machine. Therefore this area needs improvement by replacing the long dough machine that has 10.2 minutes as the service time, with one that has 6 minutes' service time. Results of the simulation runs are presented in Table 3. The bottleneck has now disappeared from long dough area but it appears again in the toaster area. 6) Decrease the cooling conveyor length by 2 meters: Scenario 6 is developed by decreasing the cooling conveyor length by 2meters. Due to the space limitation at the toaster area the toaster length could not be increased. From the experiments on Rusk moisture contents it was established that the length of the conveyor can be reduced by 2 meters. Scenario 6 is thus created and the results of this experiment are shown in Table 3. Now it can be seen that the bottleneck appears in the basket trolley area again. 7) Decreasing the cooling time at the cooling room to 8 hours: The new bottleneck appears at the basket trolley area again as a result of creation of scenario 6. The cooling room causes this bottleneck since the bread congestion is now occurring at the basket trolley in the cooling room to complete the cooling time. So, the cooling room needs to be improved by decreasing its process time. From the experiment of Rusk taste and moisture degree, the cooling time can be reduced from 12 hours to 8 hours. Thus the scenario 7 is created and results are presented in Table 9. It can be seen from the last table that the average number of Rusk boxes produced per day has increased from 2280 to 3412 i.e. a 49.5% from the current situation shown in Table 2. Similarly the average total time in the system has been reduced from 1077.38 minutes to 955.15 minutes, i.e. a 11.35% decrease. The average number in queue and the average waiting time for both the cooling room and the basket trolley area becomes zero, which means that the bottlenecks have disappeared from those two areas.
employing additional worker which is SR 33 per day from the value of daily profit.
4 Conclusions The following achievements in productivity improvements can be noticed as follows: ◘ Utilization of the ovens has improved as shown in Table 5. ◘ The utilization of other production equipments have also improved as shown in Table 6. ◘ The queue lengths with their corresponding long average waiting times at each station of the production line were totally eliminated at most of the stations and vastly reduced at the rest of the stations. Table 7 shows queues statistics at main stations of the production line before and after improvements. ◘ An increase in daily production from 2280 to 3412 boxes per day, this increase represents 49.65% increase in daily production. The average total time for a box in the system was reduced from 1077.38 minutes to 955.15 minutes, this reduction represents 11.35% decrease in average total time for a box in the system. ◘ The changes that were made to the production line to achieve the above improvements were adding two new machines, replacing three other old machines, modifying two other machines and decreasing the time of one of the processes (cooling time), without affecting the quality of the product. The payback period of the new capital investment from the additional net profit that will be realized is estimated to be 35 days. Acknowledgements Major contributions to this research project were made from a senior project work done by Emad M. Al Dabbagh, Hattan S. Abo Roos, Waleed M. Basaffar, and Ahmed K. Al Etany, students from the Department of Industrial Engineering, King Abdulaziz University, Jeddah, Saudi Arabia. The author also remembers gratefully the unstinted cooperation extended by the management and employees of The Rusk Manufacturing Company in Jeddah.
3.3 Cost Analysis Increasing the capacity of Rusk production by replacing or adding new machines in the production line means that an additional cost will be added. Table 4 shows the total cost for each scenario and the time needed to cover that cost which depends on the net profit per box, which is S.R 8. In scenarios 3,4,5,6 and 7 the additional net profit is calculated by subtracting the cost of
ISBN: 978-960-6766-83-1
References: [1]
600
Box, G.E.P., Hunter, W.G. & Hunter, J.S. Statistics for experimenters: an introduction
ISSN: 1790-2769
12th WSEAS International Conference on SYSTEMS, Heraklion, Greece, July 22-24, 2008
[2]
[3] [4]
[5] [6]
[7]
to design, data analysis, and model building, Wiley, New York, 1978. Hammami Chokri, René Frédéric, and Marin Michèle, Process quality optimization of the vacuum freeze-drying of apple slices by the response surface method, International Journal of Food Science & Technology, Vol.34, April 1999, pp. 145 Kelton David, Sadowsk Randall P. i, and Sturrock David T., Simulation with Arena, 3rd Ed, Mc Graw Hill, Boston, 2004. Banga Julio R., Canto Eva Balsa, Moles Carmen G. and Alonso Antonio A. (2004) Improving Food Processing Using Modern Optimization Methods, Trends in Food Science & Technology, Vol. No.2, 2004. Fisher Len, Science of dunking a doughnut, http://www.arrowscientific.com/au accessed on 12/05/06, 2001. Garay Loza M. and Flores R.: Computer simulation of flour mill as a stochastic model. In: FOODSIM 2000- First International Conference on Simulation in Food and Bio Industries. June, 26–27, 2000: pp. 228–23. Bailey K., D. Hardin, J. Spain, J. Garrett, J. Hoehne, R. Randle, R. Ricketts, B. Steevens, and J. Zulovich. An Economic Simulation
Study of Large-Scale Dairy Units in the Midwest, Cited in Journal of Dairy Sciences, 86(13_suppl): July 1, 2003; E28 - 34. [8] Myers, R.H. & Montgomery, D.C., Response Surface Methodology: Process and Product Optimization using Designed Experiments, Wiley, New York, 2002. [9] Anderson Mark J and Anderson Hank P., Applying DOE to Microwave Popcorn, PI Quality, July/August, 1998. [10] Anderson Mark J. and Whitcomb Patrick J., Find the Optimal Formulation for Mixtures, Stat-Ease, Inc.2004. [11] Minegishi S. Thiel D., Generic models of food logistics and production management systems. FOODSIM 2000First International Conference on Simulation in Food and Bio Industries. June 26–27, 2000:247–251. [12] Simeonov Simeon and Simeonovová Jana (2002), Simulation Scheduling in Food Industry Application, Czech J. Food Sci., Vol. 20, No. 1: 31–37
Table1. Percentage utilization of ovens under current system Utilization of Proffer oven
Utilization of Baking oven1
Utilization of Baking oven2
Utilization of Baking oven3
Utilization of Baking oven4
Utilization of Mould changer
No of Trolley out/2days
47.53
77.10
69.91
60.46
50.19
50.16
375
Table 2. Bottleneck areas identified in the current system model BTA
CR
BTCCM
CCM
MFT
HCA
CMP
BTCSM
Avg. No. in Queue
438.808
13.936
26.001
2.403
6.498
1.035
1.414
0.049
Avg. waiting time (min)
4673.11
167.23
466.16
28.84
69.3
22.08
15.04
0.84
Avg. total time for box in system
1077.380 min
Avg. number of Rusk box produced
2280 boxes per day
BTA = Basket Trolley Area, CR=Cooling Room, BTCCM = Basket Trolley in Cooling Room for Center Cutting Machine, CCM = Center Cutting Machine, MFT = Men who Feed Trolleys, HCA = Hold Container Area, CMP=Cutting Machine Process Area, BTCSM = Basket Trolleys in Center Cutting Machine area for Slicing Machine
ISBN: 978-960-6766-83-1
601
ISSN: 1790-2769
12th WSEAS International Conference on SYSTEMS, Heraklion, Greece, July 22-24, 2008
Table 3: Results of the proposed scenarios from the simulation Scenario
1 2 3 4 5 6 7
BTA
CR
BTCCM
CCM
MFT
HCA
ANQ
437.443
13.936
26.001
2.589
6.498
1.035
AWT
4658.26
167.24
519.44
31.09
69.3
22.08
ANQ
0.34
0.642
0
0.041
6.498
1.035
AWT
3.625
6.85
0
0.439
69.3
ANQ
0
0
0
0.021
AWT
0
0
0
ANQ
239.704
13.908
AWT
1918.56
ANQ
CMP
BTCSM
Toaster
LDM
1.41
1.049
0
0
15.04
14.848
0
0
1.414
0.001
344.662
0
22.08
15.04
0.584
3669.64
0
0.118
1.035
1.414
0
0.848
0
0.227
1.26
22.08
15.04
0.547
9.045
0
0
0.067
0.468
0.132
0.619
0.002
711.461
937.562
116.44
0
0.56
3.744
2.971
4.262
0.658
5956.24
6452.89
239.716
13.908
0
0.067
0.468
0.132
0.619
0.002
711.461
0
AWT
1918.56
116.44
0
0.56
3.744
2.971
4.262
0.658
5956.66
0
ANQ
239.716
13.908
0
0.067
0.468
0.132
0.619
0.002
2.232
0
AWT
1918.56
116.44
0
0.56
3.744
2.971
4.262
0.658
18.658
0
ANQ
0
0
0
0.076
0.468
0.132
0.619
0.002
17.866
0
AWT
0
0
0
0.612
3.744
2.971
4.262
0.596
143.036
0
ATST
ANP
1076.300
2280.000
1030.404
2359.694
904.359
2565.000
1208.252
2838.565
1208.252
2838.565
1208.252
2838.565
955.146
3411.907
ATST = Ave Total time in System ANP = Ave Number of boxes produced ANQ = Ave number in Queue AWT =Ave Waiting Time
Table 4. Cost Analysis of Scenarios Scenarios Current Scenario 1 Scenario 2 Scenario 3 Scenario 4 Scenario 5 Scenario 6 Scenario 7
Total cost of the scenario (SR) (a) ---10,000 30,000 105,000 208,000 228,000 311,000 311,000
Cost of added labor (SR/day) (b) ---0 0 33 33 33 33 33
Boxes/day (boxes/day) (c) 2280 2280 2359.69 2565 2838.57 2838.57 3268 3411.91
Additional boxes/day (boxes/day) (d)=((c) – 2280) 0 0 79.69 285 558.57 558.57 988 1131.91
Additional net profit of scenario per day (SR/day) (e)=(8(d)-b) 0 0 637.52 2247 4435.56 4435.56 7871 9022.28
Days required to cover the scenario cost (days) (f)=(a/e) ------47.05735 46.72897 46.89374 51.40275 39.51213 34.47022
Table 5. Oven Utilization Percentage Utilization (Current Values and Optimal Values from Scenario 7) Proffer oven 1
Proffer oven2
Baking oven1
Baking oven2
Baking oven3
Baking oven4
Current Situation
69.69
47.53
77.1
69.91
60.46
50.19
Optimal Scenario
84.05
72.2
91.63
87.32
82.77
80.1
Table 6 Utilization of other Production Equipments Percentage Utilization (Current Values and Optimal Values from Scenario 7) Current Situation Optimal Scenario
Basket T
CCM
cooling R
CM
Feeder
LDM
Rouling M
Slicing M
Cooling Cov.
Toaster Cov.
100 60.09
100 71.16
100 69.76
100 87.35
74.95 50.4
75 87.35
100 87.35
100 74.95
48.31 68.61
53.68 59.26
Table 7 Queue Statistics at major stations - Bottlenecks Areas Current Situation Optimal Scenario
AWT AWT ANQ AWT ANQ
BTA 4673.1 438.8 0 0
ISBN: 978-960-6766-83-1
CR 167.23 13.93 0 0
BTCCM 466.16 26.001 0 0
CCM 28.84 2.403 0.574 0.072 602
MFT 69.3 6.498 3.744 0.468
HCA 22.08 1.035 2.953 0.132
CMP 15.04 1.414 4.268 0.624
BTCSM 0.84 0.049 0.615 0.002
Toaster ـــــ ـــــ 7.7 0.962
LDM ـــــ ـــــ 0 0
ISSN: 1790-2769