Improving progressive alignment for phylogeny reconstruction using parsimonious guide-trees Usman Roshan New Jersey Institute of Technology
[email protected]
Dennis R. Livesay California State Polytechnic University, Pomona
[email protected]
Abstract Phylogenies are widely used for understanding the evolutionary histories of species and gene products. Maximum parsimony (MP) and maximum likelihood (ML) are commonly used optimization criteria for constructing phylogenies. However, phylogenetic descriptions depend not only on the employed reconstruction technique, but also on the underlying sequence alignment. Here, we establish a simple prescription to improve the underlying alignments used in phylogeny reconstruction. We adapt Gotoh’s iterative strategy for improving a progressive alignment (by using better guide-trees) specifically for the purpose of constructing optimal MP phylogenies. We improve the progressive alignment heuristic as implemented in the MUSCLE alignment program by iterating with maximum parsimony guide-trees constructed using PAUP*, yielding both deterministic and randomized heuristics. We evaluate accuracy on simulated data under a wide range of model conditions and show that phylogenies produced using our technique are more accurate than phylogenies on other alignments.
1. Introduction Phylogenies are a fundamental tool for understanding the evolutionary history of species [1]. The most important input to a phylogeny reconstruction method is a multiple sequence alignment. The progressive alignment strategy of Feng and Dolittle [2] is a fast and widely used heuristic for aligning multiple sequences to a guide-tree (i.e. phylogenetic tree sequence alignment). For example, the popular ClustalW program [3] uses a progressive alignment combined with improvements built around it. Guide trees for progressive alignment are usually obtained by simple distance-based approaches such as neighbor joining or UPGMA [4], where distance matrices are constructed using pairwise alignments. Most previous phylogenetic reconstruction studies have focused on constructing optimal trees with the
Satish Chikkagoudar New Jersey Institute of Technology
[email protected]
alignment fixed. However, the input alignment is known to affect the reconstructed phylogeny [5,6,7]. Consequently, improving the alignment input could lead to better phylogenies. In this report we demonstrate that a simple MP iterative refinement method, based on Gotoh’s [8] doubly nested randomized iterative technique, can result in significantly improved sequence alignments for phylogeny reconstruction. We compare our approach to the standard ClustalW, and different stages of MUSCLE on simulated data.
2. Methods 2.1 Phylogeny reconstruction and alignment Maximum parsimony (MP) and maximum likelihood (ML) are two widely used optimization criteria for phylogeny reconstruction [4]. Both are known to be NP-hard; however, in practice, heuristic ML implementations are orders of magnitude slower than MP [4]. Consequently, we only examine MP for constructing phylogenies in this preliminary investigation; future work will also investigate ML. Standard heuristics for solving MP are hill-climbing strategies which use the Tree Bisection and Reconnection (TBR) technique for performing local moves [4]. These can be found in software packages like PAUP* [9]. Like MP and ML phylogenetic reconstruction, standard optimization criteria for multiple sequence alignment, i.e. sum-of-pairs and phylogenetic tree alignment [1] are also NP-hard. Sum-of-pairs (SP) aims to maximize the sum of pairwise similarity between the input sequences. Phylogenetic tree alignment, on the other hand, aims to minimize dissimilarity along the edges of a given tree. The progressive alignment strategy [2] has been adapted into most software packages for alignment, the most popular being ClustalW [3] because of its speed and accuracy. Various programs have implemented improvements around the basic progressive alignment.
ClustalW implements ideas such as sequence weighting and automatic gap penalties that are designed to improve the alignment based on biologically sound assumptions [3]. ClustalW uses neighbor joining for a guide-tree. MUSCLE [10] is a three-stage program each of which we study separately for this paper. Stage I is the basic progressive alignment on a UPGMA guide-tree. Stage II is Gotoh’s iterative heuristic [8] but without SP optimization, i.e. compute alignment on a UPGMA tree, compute UPGMA tree on alignment, recompute alignment on UPGMA tree, and iterate until the UPGMA tree does not change. Stage III is a SP optimization on the alignment from stage II.
2.3 Simulation Simulations are commonly used to evaluate phylogenetic accuracy since we have no way of knowing “true” evolutionary trees [11]. The ROSE software package [12] implements the HKY85 [13] model of DNA sequence evolution, but also allows for insertions and deletions. Given the true tree (which we know since we are simulating data) and an estimated tree, we can use the Robinson-Foulds distance [14] to measure accuracy. This is a standard measure of evaluating tree accuracy in phylogenetics and basically measures the number of false positive and false negative clades in the estimated tree. We present the error rate as percentages (between 0 and 100).
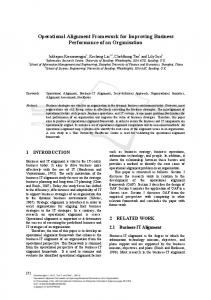
3. Improved progressive alignment Gotoh [8] introduced a doubly nested randomized iterative method which iterated between progressive alignments and distance-based UPGMA phylogenies. We modify this approach by alternating between MP trees and progressive alignments and output the pair of alignment and tree with the best MP score. We implemented this heuristic using the MUSCLE program (for computing the progressive alignment) and PAUP* (for computing MP trees) and call it MUSCLE-PARS (see Figure 1). Our approach is specifically designed to find alignments and phylogenies that optimize the MP score, and thus is likely to be more appropriate for phylogeny-centric applications, i.e. predicting functional sites with phylogenetic motifs [15]. In MUSCLE-PARS we strictly follow the order of the tree in aligning sequences. PAUP* implements various hill-climbing heuristics for solving MP. The MP heuristic we use builds a starting tree by adding sequences in the order of their closeness (see [4] for more details). Once the
tree is constructed, a TBR-based standard hill-climbing search is applied to it. The initial starting tree for the search can also be built by adding sequences in a random order instead of their closeness; this produces a randomized search heuristic since each time the search starts from a different tree. We use the former deterministic search for MP so that MUSCLE-PARS is also deterministic. We leave a thorough study of the randomized version of MUSCLE-PARS to a later study. Figure 1: Description of MUSCLE-PARS Input: unaligned sequences, initial guide-tree T, number of iterations n Output: alignment A* and guide-tree T* Algorithm: (1) Set best score bs to infinity. (2) Compute MUSCLE progressive alignment A on guide-tree T (3) Compute MP score MP(T,A) of tree T on alignment A. (4) If MP(T,A) < bs then set bs=MP(T,A), A*=A, and T*=T (5) Compute MP tree T on A using PAUP*. (6) If number of iterations not done then go to 2, else return A* and T*. MUSCLE-PARS differs from Gotoh’s original implementation in several key ways. First, the original method of Gotoh [8] used UPGMA trees instead of MP. Second, Gotoh’s method performed SP optimization on the progressive alignment before recomputing a phylogeny on it. We do not perform this additional optimization step because it does not necessarily improve accuracy and extends running time (data not shown here). Third, the stopping criterion for Gotoh’s method is when the UPGMA tree does not change; Gotoh’s method usually reaches convergence in a few iterations. MUSCLE-PARS uses parsimony trees (that may be deterministic or randomized) which provides no guarantee of convergence; alignments and trees could get worse or improve with iterations. If the same alignment is obtained in two consecutive iterations, the MP trees (which are used for constructing the alignment of the following iteration) may not be the same if randomized heuristics are used. And fourth, the alignment outputted from Gotoh [8] is the one from the most recent iteration. MUSCLE-PARS outputs the alignment and tree with the best MP score over all the iterations.
4. Experimental design
We compare ClustalW, and MUSCLE and its three different stages to two variants of MUSCLEPARS using default scoring matrices and gap penalties. The scoring matrices and gap penalties of the MUSCLE variants and MUSCLE-PARS are exactly the same; the only difference is in the guidetree iterations. We use the abbreviations MUSCLEPROG to refer to stage I of MUSCLE, MUSCLEUPGMA to refer to stage II, and MUSCLE to refer to the final stage III alignment. Additionally, we present two variants of MUSCLE- PARS. In the first, which we call MUSCLE-PARS, the initial guide-tree is the UPGMA one constructed on pairwise alignment distances, and in the second one, which we call MUSCLE-PARS2, the initial guide-tree is the one used in the last iteration of MUSCLE-UPGMA. We construct MP phylogenies on all the alignments (on each simulated dataset) using a more thorough TBR search heuristic than the basic one used in MUSCLE-PARS (available upon request from authors). Since PAUP* was used in MUSCLE-PARS, we use PAUP* for constructing MP phylogenies on all alignments Simulation parameters are selected such that the MP tree on the true alignment has, at most, 15% error. We use birth-death model trees produced using the r8s software package [16]. Birth-death trees produced by r8s are scaled to be ultrametric by default, which means that the evolutionary distance from the root to each leaf is the same. Biological trees on real data are not necessarily ultrametric; therefore, to deviate the tree from ultrametricity we randomly multiply each edge length by a deviation factor as described in [17]. A deviation of 1 means no deviation, 2 means small, and 4 is moderate deviation. We also multiply the edge lengths of each tree by scaling factors of 16, 32, and 64 to produce different levels of evolutionary rates. We generated 20 model trees of sizes 100, 200, and 400 taxa for each setting of deviation and scale to produce a total of 360 different model trees. For each model tree we generate DNA sequences using ROSE under the HKY85 [13] model with transition/transversion ratio set to 2. We study two sequence lengths used at the root, 500 and 1000, and examine two different indel probabilities of 0.00005 and 0.0005 (see [12] for more details). On each of the 360 model trees we evolved DNA sequences for each setting of sequence length and indel probability; thus, producing a total of 1,440 simulated datasets.
5. Experimental results For each set of simulated unaligned sequences, we compute ClustalW, MUSCLE (all three stages), and
MUSCLE-PARS (both variants) alignments. Subsequently, we construct MP trees, using a thorough TBR search heuristic. The accuracy of each phylogeny, computed using the RF distance, is compared against the true tree. In Tables 1 and 2, we report the average error rate for each parametric setting. The improvement, in terms of percentage differences, is also provided for the best scoring alignment. We also report the improvement in MUSCLE-PARS1 and MUSCLE-PARS2 error rates over the best error rate of the other methods. While the average gain is modest, the overall results clearly indicate that improvement when using the two MUSCLE-PARS methods is a robust result. Our results follow some of the general trends one would expect to see in simulation studies. For example, the error rates decrease as the sequence length increases. Conversely, error rates tend to increase as the evolutionary rates, number of taxa, deviations, or indel probabilities increases, all of which are known to make the phylogeny estimation problem harder. However, trees at evolutionary rates of 32 fare better than 16. Overall MUSCLE-PARS1 and MUSCLE-PARS2 have the lowest error rates. At sequence lengths of 1000 and low indel probability of 0.00005 the improvement using MUSCLE-PARS is the smallest (especially at 100 taxa), if any at all. We take a closer look at the part of the parameter space where improvement is over 1% in topological accuracy. There are 9 parametric settings at which MUSCLE-PARS has error rate lower than 1% than the other methods. Out of those 7 are for sequence lengths of 500. Thus MUSCLE-PARS can be most effective when sequence lengths are short relative to the number of sequences. On 6 of these settings the indel probability is 0.0005 (the higher value) thus showing that MUSCLE-PARS can be useful for data that has undergone a modest number of insertions and deletions. The largest improvement is of 2.2% for 200 sequences, 500 sequence length, 64 scaling, 4 deviation, and 0.0005 indel probability, which can be considered a hard setting. A curious observation is that MUSCLE has high error rates, especially when considering high evolutionary rates and indel probabilities. In fact, the error rates sometimes go above 25%, which is much higher than that of the other methods. Recall that MUSCLE computes a SP optimization in stage III after the progressive alignments are done. We conjecture that this significantly decreases the quality of the alignment for phylogeny reconstruction. However, for other tasks, such as aligning structurally conserved regions, it may be more appropriate as seen from performance on BAliBASE [18] structural alignment
benchmarks. When considering protein data, we have also noticed this anti-correlation between phylogeny reliability (using bootstraps) and BAliBASE accuracy. These observations underscore the reality that no single assessment strategy can be considered perfect when evaluating alignments and phylogenies.
6. Conclusions Our experiments on data show that MUSCLEPARS1 and MUSCLE-PARS2 produce phylogenies of better accuracy than those on ClustalW, MUSCLEPROG, MUSCLE-UPGMA, and MUSCLE. Furthermore, MUSCLE-PARS is efficient in the running time required to produce an alignment and phylogeny (data not shown here), which means it can be used to analyze datasets containing even hundreds to thousands of sequences. We expect MUSCLEPARS to quickly produce very good starting trees for expensive simultaneous alignment and phylogeny reconstruction local search strategies, such as those conducted in Poy [19] and statistical alignment packages [20]. MUSCLE-PARS can easily be implemented using existing available software packages with a simple Perl script.
7. References [1] D, Gusfield, Algorithms in strings, trees, and sequences, Cambridge University Press, 1997 [2] D-F. Feng and R. F. Dolittle, Progressive sequence alignment as a prerequisite to correct phylogenetic trees, Journal of Molecular Evolution, 25, 1987, 351-360. [3] J. D. Thompson, D. G. Higgins, and T. J. Gibson, CLUSTALW: improving the sensitivity of multiple sequence alignment through sequence weighting, position specific gap penalties, and weight matrix choice. Nucleic Acids Research, 22(22), 1994, 4673–4680. [4] D. L. Swofford and G. J. Olsen, Phylogeny Reconstruction, In D. Hillis, C. Moritz, and B. K. Marble, editors, Molecular Systematics, chapter 11, pages 407-514, Sinauer Ass. Inc., Sunderland, Massachusetts, USA, 1996, 2nd edition [5] D. A. Morrison and J. T. Ellis, Effects of nucleotide sequence alignment on phylogeny estimation: a case study of 18S rDNAs of Apicomplexa. Mol. Biol. Evol.,1997, 14:428-441 [6] N. Goldman, Effects of sequence alignment procedures on estimates of phylogeny. Bioassays, 20, 1998, 287-290
[7] B. G. Hall, Comparison of the Accuracies of Several Phylogenetic Methods Using Protein and DNA Sequences, Molecular Biology and Evolution, 22, 2005, 792-802 . [8] O. Gotoh, Significant improvement in accuracy of multiple protein sequence alignment by iterative refinement as assessed by reference to structural alignments. J. Mol. Biol., 264, 1996, 823-838. [9] D. L. Swofford, PAUP*: Phylogenetic Analysis Using Parsimony (and Other Methods), Sinauer Associates, Sunderland, Massachusetts, Ver 4.0, 1996 [10] R. C. Edgar, MUSCLE: a multiple sequence alignment method with reduced time and space complexity, BMC Bioinformatics, 2004, 5(113) [11] K. Sjolander, Phylogenomic inference in protein molecular function: advances and challenges, Bioinformatics, 20(2), 2004,170-179. [12] J. Stoye, D. Evers, and F. Meyer, Rose: generating sequence families, Bioinformatics, 14(2), 1998,157-163. [13] M. Hasegawa, H. Kishino, and T. Yano, Dating the human-ape splitting by a molecular clock of mitochondrial DNA, Journal of Molecular Evolution, 22, 1985,160-174 [14] D. F. Robinson and L. R. Foulds Comparison of phylogenetic trees, Mathematical Biosciences, 53, 1981, 131-147 [15] D. La D, B. Sutch, and D. R. Livesay, Predicting protein functional sites with phylogenetic motifs. Proteins: structure, function and bioinformatics, 58(2), 2005, 309-320. [16] Sanderson M.J., (2004) r8s software package available from http://ginger.ucdavis.edu/r8s/. [17] L. Nakhleh, U. Roshan, L. Vawter, T. Warnow, Estimating the deviation from a molecular clock, Lectures Notes in Computer Science, Springer Verlag, 2452, 2002, 287-299 [18] J. D. Thompson, F. Plewniak, and O. Poch, BAliBASE: a benchmark alignment database for evaluation of multiple alignment programs, Bioinformatics, 15, 1999, 87-88. [19] W. Wheeler POY: the optimization of alignment characters. Version 3.0.4. , 2002, Program and Documentation, New York, NY, Available from ftp.amnh.org/pub/molecular. [20] B. D. Redelings and M. A. Suchard, Joint Bayesian estimation of alignment and phylogeny, Systematic Biology, 2005
Table 1: Summary of simulation results (continued on next page) Scale / MUSCLE- MUSCLEMUSCLEClustalW MUSCLE Deviation PROG UPGMA PARS1 Percent error rates for 100 taxa, 500 sequence length, indel probability 5x10⁻⁵ 16 / 2 9.4 9.1 9.5 9.4 8.7 (0.1) 32 / 2 8.7 8.7 8.6 8.7 8.2 (0.3) 64 / 2 10.2 10.1 10.9 10.3 11.0 16 / 4 13.8 13.8 13.9 13.7 13.5 (tie) 32 / 4 13.3 13.0 (tie) 13.1 13.2 13.0 (tie) 64 / 4 14.1 14.3 15.0 14.0 (0.1) 15.5 Percent error rates for 100 taxa, 1000 sequence length, indel probability 5x10⁻⁵ 16 / 2 6.1 6.0 5.9 5.8 5.4 (tie) 32 / 2 4.8 5.0 4.9 4.8 4.6 (0.1) 64 / 2 7.0 6.9 7.1 6.5 6.4 (0.1) 16 / 4 9.1 9.1 8.9 9.0 8.9 32 / 4 8.9 8.5 8.7 8.4 8.0 (0.1) 64 / 4 13.4 11.5 (0.7) 13.8 12.2 14.0 Percent error rates for 100 taxa, 500 sequence length, indel probability 5x10⁻⁴ 16 / 2 10.9 10.9 10.8 10.7 10.3 (tie) 32 / 2 11.5 10.2 9.0 (0.2) 9.2 9.3 64 / 2 16.6 25.3 19.7 17.6 17.3 16 / 4 13.9 13.9 13.7 13.5 12.7 (0.3) 32 / 4 17.5 16.4 14.9 14.6 14.4 64 / 4 24.4 30.6 24.2 23.3 22.9 Percent error rates for 100 taxa, 1000 sequence length, indel probability 5x10⁻⁴ 16 / 2 5.7 5.6 5.6 5.8 5.2 (0.3) 32 / 2 6.9 6.7 6.1 6.4 6.0 64 / 2 13.9 (0.4) 18.3 18.5 15.9 15.9 16 / 4 8.8 9.0 8.5 8.5 8.3 (tie) 32 / 4 13.4 12.3 10.6 10.5 (tie) 11.0 64 / 4 23.4 26.7 23.7 21.7 23.1 -5 Percent error rates for 200 taxa, 500 sequence length, indel probability 5x10 16 / 2 11.1 11.2 11.2 11.3 10.5 (0.7) 32 / 2 8.3 8.2 7.9 (tie) 7.9 (tie) 7.9 (tie) 64 / 2 10.2 11.2 11.4 9.6 (0.4) 11.3 16 / 4 15.3 15.5 15.4 15.5 13.8 (0.2) 32 / 4 11.5 11.3 11.4 11.4 11.3 64 / 4 17.0 16.5 17.3 15.4 (0.3) 17.0 Percent error rates for 200 taxa, 1000 sequence length, indel probability 5x10⁻⁵ 16 / 2 6.2 6.3 6.3 6.3 5.7 (tie) 32 / 2 5.6 5.6 5.5 5.5 5.4 (tie) 64 / 2 7.2 7.7 8.2 6.9 (tie) 8.2 16 / 4 9.4 (tie) 9.5 9.4 (tie) 9.4 (tie) 9.5 32 / 4 9.0 8.9 8.8 (tie) 8.8 (tie) 8.9 64 / 4 14.4 13.6 14.4 12.8 14.2 Percent error rates for 200 taxa, 500 sequence length, indel probability 5x10⁻⁴ 16 / 2 11.9 11.7 11.2 11.2 10.2 32 / 2 12.5 14.7 10.3 10.0 10.0 64 / 2 19.0 (0.4) 37.4 22.2 20.7 19.9
MUSCLEPARS2
Best Diff.2
8.8 8.5 9.9 (0.2) 13.5 (tie) 13.0 (tie) 14.7
0.4 0.4 0.2 0.2 ---0.7
5.4 (tie) 4.7 6.9 8.8 (0.1) 8.1 12.5
0.4 0.2 0.1 0.1 0.4 -1.0
10.3 (tie) 9.2 16.4 (0.2) 13.0 13.7 (0.7) 22.6 (0.3)
0.4 -0.2 0.2 0.8 0.9 0.7
5.5 5.9 (0.1) 14.3 8.3 (tie) 10.5 (tie) 20.6 (1.1)
0.4 0.2 -0.4 0.2 --1.1
10.5 (0.7) 8.0 10.0 14.0 11.2 (0.1) 15.7
0.7 ---0.4 1.5 0.1 -0.3
5.7 (tie) 5.4 (tie) 6.9 (tie) 9.5 8.8 (tie) 12.7 (0.1)
0.6 0.1 ---0.1 --0.1
9.7 (0.5) 9.5 (0.5) 19.4
1.5 0.5 -0.4
16 / 4 32 / 4 64 / 4
16.1 17.0 26.6
16.4 19.6 44.0
15.3 15.6 26.6
15.3 15.4 26.1
14.4 14.6 25.6
14.2 (0.2) 14.5 (0.1) 23.9 (1.7)
1.1 0.9 2.2
Scale / MUSCLE- MUSCLEMUSCLEMUSCLEClustalW MUSCLE Deviation PROG UPGMA PARS1 PARS2 Percent error rates for 200 taxa, 1000 sequence length, indel probability 5x10⁻⁴ 16 / 2 7.2 7.6 7.1 6.9 6.6 6.4 (0.2) 32 / 2 9.5 10.4 6.8 6.8 6.6 (tie) 6.6 (tie) 64 / 2 15.8 (0.9) 28.4 19.8 18.4 17.6 16.7 16 / 4 11.1 11.4 10.1 10.1 9.5 (0.2) 9.7 32 / 4 14.4 16.0 11.9 11.8 11.2 (0.1) 11.3 64 / 4 23.7 36.0 24.6 22.9 22.6 21.5 (1.1) Percent error rates for 400 taxa, 500 sequence length, indel probability 5x10⁻⁵ 16/2 12.6 12.6 12.6 12.6 11.5 (0.1) 11.6 32/2 8.7 8.6 8.6 8.6 8.3 8.1 (0.2) 64/2 9.0 10.1 9.6 8.6 9.0 8.3 (0.3) 16/4 17.8 17.9 17.9 17.9 16.2 (0.2) 16.4 32/4 13.3 13.3 13.2 13.2 12.8 (0.1) 12.9 64/4 15.1 15.7 14.7 13.9 14.5 13.5 (0.4) Percent error rates for 400 taxa, 1000 sequence length, indel probability 5x10⁻⁵ 16 / 2 7.4 7.3 7.4 7.3 7.0 (tie) 7.0 (tie) 32 / 2 5.5 (tie) 5.6 5.5 (tie) 5.5 (tie) 5.5 (tie) 5.5 (tie) 64 / 2 6.5 7.1 6.8 6.0 (0.1) 6.4 6.1 16 / 4 10.3 10.3 10.3 10.3 9.6 (tie) 9.6 (tie) 32 / 4 8.8 8.9 8.5 (tie) 8.7 8.5 (tie) 8.5 (tie) 64 / 4 12.2 11.9 11.5 10.9 (0.1) 11.9 11.0 Percent error rates for 400 taxa, 500 sequence length, indel probability 5x10⁻⁴ 16 / 2 13.1 14.5 12.8 12.7 12.0 (tie) 12.0 (tie) 32 / 2 11.8 16.3 10.0 9.8 9.4 9.3 (0.1) 64 / 2 15.9 40.1 17.9 16.6 15.5 15.3 (0.2) 16 / 4 18.2 19.7 17.6 17.6 15.9 (tie) 15.9 (tie) 32 / 4 17.0 21.2 15.4 15.6 14.5 (0.1) 14.6 64 / 4 22.8 44.5 22.9 21.8 22.4 21.5 (0.3) Percent error rates for 400 taxa, 1000 sequence length, indel probability 5x10⁻⁴ 16 / 2 8.0 9.3 7.6 7.6 7.2 (tie) 7.2 (tie) 32 / 2 8.2 10.0 6.6 6.4 6.2 (0.1) 6.3 64 / 2 12.3 (0.6) 33.3 15.0 14.5 13.5 12.9 16 / 4 11.6 13.4 11.0 11.0 10.3 (0.1) 10.4 32 / 4 12.9 15.1 10.6 10.6 10.2 (0.1) 10.3 64 / 4 20.4 39.5 19.8 19.0 18.6 18.2 (0.4) Overall results: number of times each method was best (ties are counted in each occurrence) Dev. = 2 5 0 3 5 16 20 Dev. = 4 1 2 3 6 16 21 Total 6 2 6 11 32 41
Best Diff.2
Table 2: Summary of simulation results (continued from previous page)1
1
0.5 0.2 -0.9 0.6 0.6 1.4 1.1 0.5 0.3 1.6 0.4 0.4 0.3 ---0.1 0.7 ---0.1 0.7 0.5 0.6 1.7 0.9 0.3 0.4 0.2 -0.6 0.7 0.4 0.8 -------
Best scoring alignments (across all six possibilities) also included the percent difference between it and the next best scoring alignment (again, across all six possibilities) in parentheses. 2 In the final column, the difference between the best scoring MUSCLE-PARS alignment and the best of the remaining four alignments is presented.