Improving quantum-transition temperatures in BaFe2As2-based crystals by removing local-lattice strain & electronic-structure disorder Li Li,1,* Qiang Zheng,1,* Qiang Zou,2,* Shivani Rajput,1,2 Anota O. Ijaduola,3 Zhiming Wu,2,4 Xiaoping P. Wang,5 Huibo B. Cao,6 Miafang Chi,2 Zheng Gai,2 David Parker,1 Athena S. Sefat1,^ 1
Materials Science and Technology Division, Oak Ridge National Laboratory, Oak Ridge, TN 37831, USA 2 Center for Nanophase Materials Sciences, Oak Ridge National Laboratory, Oak Ridge, TN 37831, USA 3 Department of Physics, University of North Georgia, Dahlonega, GA 30597, USA 4 Fujian Provincial Key Laboratory of Semiconductors and Applications, Collaborative Innovation Center for Optoelectronic Semiconductors and Efficient Devices, Department of Physics, Xiamen University, Xiamen 361005, P. R. China 5 Chemical and Engineering Materials Division, Oak Ridge National Laboratory, Oak Ridge, TN 37831, USA 6 Quantum Condensed Matter Division, Oak Ridge National Laboratory, Oak Ridge, TN 37831, USA * ^
Authors contributed equally to this manuscript Corresponding author:
[email protected]
Quantum materials such as antiferromagnets or superconductors are complex in that chemical, electronic, and spin phenomena at atomic scales can manifest in their collective properties. Although there are some clues for designing such materials, they remain mainly unpredictable. In this work, we find that enhancement of transition temperatures in BaFe2As2-based crystals are caused by removing locallattice strain and electronic-structure disorder by thermal annealing. While annealing improves Néelordering temperature in BaFe2As2 crystal (TN=132 K to 136 K) by removing in-plane electronic defects and overall reduction of a-lattice parameter, it increases superconducting-ordering temperature in optimally cobalt-doped BaFe2As2 crystal (Tc=23 to 25 K) by precipitating-out the cobalt dopants and giving larger overall a-lattice parameter. Although annealing promotes local chemical and electronic uniformity resulting in higher TN in the parent, it results in nanoscale phase separation in the superconductor resulting in lower disparity and strong superconducting band gaps in the dominant crystalline regions, which lead to both higher overall Tc and critical-current-density, Jc. After much research on cuprates and iron-based superconductors, the causes of unconventional superconductivity, and at a particular Tc, remain elusive. Iron-based superconductors can be created by chemical substitutions and charge doping of antiferromagnetic ‘parent’ materials that alter the nuclear and electronic structures, Fermi surfaces, carrier concentrations, and strength of spin fluctuations [1-8]. As is well-known, AFe2As2 (A= Ca, Sr, Ba) parents (known as ‘122s’) have coupled antiferromagnetic striped order (Fe spins parallel along b-, antiparallel along a- and c-axes) and orthorhombic transitions below TN =Ts [9]. However, there are variations of TN in the literature within each family. For example, a BaFe2As2 crystal is reported to have TN = 134 K [10,11] that rises to TN = 140 K after thermal annealing (at 700°C) [12,13], while polycrystalline samples have TN = 140 K [14]. Similarly, TN values in SrFe2As2 can vary by 6 to 8 K [13-15]. Moreover, CaFe2As2 crystals can be produced to have different TN and even a nonmagnetic ground state [13,16]. We found that the thermal-annealing temperature matters and it can lead to homogenous crystalline lattices giving the highest coupled TN =Ts [13]. As there are several parents and superconducting doping types, the cause of superconductivity for a particular dopant and at a particular superconducting temperature is unpredictable [1]. Even looking within the family of BaFe2As2-based crystals and a particular doping level (x), Tc variations can be observed. For example, the specific heat results on Ba(Fe1-xCox)2As2 with x=0.045, 0.08, and 0.105 have shown that annealing (800 C, 2 weeks) 1
increases Tc between 2 to 5 K, decreases the residual linear term in specific heat (γ o) in the superconducting state by as much as half while suppressing the Schottky-like contribution below 1 K [17,18]. Moreoever, the magnetic susceptibility on Ba(Fe1-xCox)2As2 crystals with 0.04x0.14 showed an increase of Tc values by ~ 1 to 3 K, with no significant change in superconducting Meissner or shielding fractions [19]. In addition, annealing (800 C, 1 week) of Ba0.5Sr0.5(Fe1-xCox)2As2 with x=0.14 showed a Tc increase of 5 K in bulk properties, and a decrease in heat capacity γo of more than half [20]. In all of these examples, it is assumed that annealed crystals have improved crystallinity due to the release of residual strain, hence improve TN or Tc. This paper offers an insight on the complexity of Ba(Fe1xCox)2As2 quantum materials with intermingled effects of disorder, charge doping, and and electronic and crystal structure effects demonstrated by comparing results across multi-length scales using bulk techniques (diffraction, transport, magnetization), local probes (spectroscopy, microscopy) and theoretical input. Our results suggest that annealing improves electronic uniformity and antiferromagnetic order, while it promotes clustering of cobalt dopants at nanoscales to form more pinning sites and improved Jc, yet uniform and stronger areas of superconducting gaps that give improved Tc. We assume that the overall strength of antiferromagnetism or superconductivity below a particular transition temperature in a crystal is produced by a complex combination of many local-scale details such as chemical and lattice structures, defects, and and electronic structure variations [1-7,21-23]. In this manuscript, we report on two sets of crystals, each with same average composition of x that give slightly different TN or Tc values. Previously, we found praseodymium clustering to prevent bulk superconductivity in Pr-doped CaFe2As2 [24], and here we explore each pair of “as-grown” versus “annealed” antiferromagnetic BaFe2As2 or superconducting optimally cobalt-doped BaFe2As, in order to understand reasons for their improved transition temperatures with annealing. We analyze the bulk properties in crystals, and also their nanoscale variations in the atomic-resolved and real-space lattice and electronic structures that get averaged by them. We report that higher transition temperatures in annealed crystals are due to the higher overall electronic and chemical uniformity, as expected. However, surprisingly, some cobalt dopants precipate out of crystalline matrix that yields larger electronically connecting regions with stronger superconductivity, and better pinning. Although there is no distinct change in the average compositions of each as-grown versus annealed Ba(Fe1-xCox)2As2 crystal, the average structures change only in-plane as will be shown here in alattice parameter variations, and smearing effects along the ac plane. Figure 1a (top) shows typical size and quality of Ba(Fe1-xCox)2As2 crystals that were used for our annealing studies, and the roomtemperature tetragonal crystal structure that is made of covalently-bonded layers of (Fe/Co)As in the abplane separated by Ba ions along the c-axis. The average chemical composition of each crystal was measured with a Hitachi S3400 scanning electron microscope operating at 20 kV, and use of energydispersive x-ray spectroscopy (EDS). For the line analysis on a crystal, the instrument used was the Hitachi S3400 Scanning electron Microscope operating at 20kV; the beam current was set to provide approximately 1500 counts/second using a 10 mm sq EDAX detector set for a processing time of 54 microsecond; data were reduced using EDAX’s standardless analysis program. Figure 1a (bottom) shows the variation in cobalt composition across a crystal with an average composition of 2.4% cobalt; this result shows that cobalt amount is non-uniform on the micrometer scale changing by ~0.1%. For all the crystals studied here, the x chemical composition is reported after averaging the results of energy on 3 random spots (~90 μm diameter each). For structural changes, powder X-ray diffraction data on numerous Ba(Fe1-xCox)2As2 were collected on an X’Pert PRO MPD diffractometer (Cu K1 radiation, λ=1.540598 Å); the lattice parameters were refined by least-squares fitting within the program package WinCSD [25]. Figure 1b shows the refined lattice paramters versus x, from X-ray diffraction of powdered crystals. As expected for as-grown Ba(Fe1-xCox)2As2 crystals [10,26], a-lattice constant remains mainly invariant while c-axis shrinks with increasing x due to smaller Co ions substituting for Fe. However, upon annealing, the c-lattice parameter does not change while the a-lattice parameter changes slightly, decreasing for the parent while increasing for optimally-doped x=0.063 crystal. This negligent c2
parameter change of less than 0.01 Å was reported for x=0 annealed crystals [13]. To supplement these structural results, single crystal X-ray diffraction data on the set of as-grown and annealed crystals, with either x=0.063 or x=0.146, were collected on a Rigaku Pilatus 2000K diffractometer (Mo K, =0.71073 Å). Crystals were mounted on MiTegen loops with a superglue for data collection at room temperature, with approximate sizes of ~0.10.10.02 mm3. Data processing and reduction were carried out using the CrystalClear [27] software package. Crystal structure of the parent compound BaFe2As2 with a fixed site occupancy ratio for Fe and Co atoms at the 4d site was used as the starting model in structural refinement; structures were refined to convergence using SHELX-2014 [28]. Figure 2a shows evidence of peak broadening and lattice distortions for two sets of annealed crystals from axial photographs of singlecrystal X-ray diffraction. We show the simulation for an overlay of a section of [101] layer to produce this smearing effects of lattice due to these results: for x=0.063, a small misalignment along [010] of ~ 1.0 degrees can give the evident peak broadening; for x=0.146 a twin law rotation along [010] by 2.4 degrees can produce peak splits. This result is also reflected in atom displacement along the crystallographic c direction, demonstrated in Figure 2b, found by refining the full dataset for x=0.063. The amplitude of this distortion causes the increase of arsenic height by ~ 0.0026 Å for annealed x=0.063, although the averaged c-lattice parameter stays the same. The smearing effect along the ac plane may be due to clustering of cobalt atoms in small regions as is evident from local microscopy results (explain below).
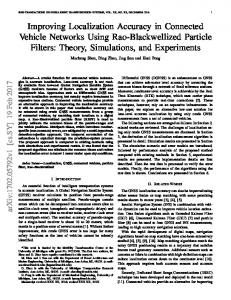
Figure 1: Small variations of cobalt concentrations within a crystal, and changes in a-lattice parameters with annealing of Ba(Fe1-xCox)2As2 crystals. (a) (Top) Typical size and quality of as-grown Ba(Fe1-xCox)2As2 crystals, and room-temperature tetragonal crystal structure of Ba(Fe1-xCox)2As, with unit cell shown in solid black line; (Bottom) A line scan across a crystal with average composition of Ba 0.98(Fe0.976Co0.024)2As2, assuming full occupancy of layers. (b) The refined a- and c-lattice parameters at room temperature, from powdered crystals with doping levels (x). The level of x does not change upon annealing, within error.
3
Figure 2: Smearing effects in annealed crystals demonstrated by single crystal X-ray diffraction on Ba(Fe1xCox)2As2 crystals. (a) (Left) [110] axial photographs computed from omega-scan images on as-grown compared to annealed crystals, for x=0.063 and 0.146. (Right) Overlay a section of [101] layers to simulate the effects of lattice misalignment for the annealed crystals: Top is demonstrating misalignment along [010] by ~1.0 degrees for x=0.063; bottom is showing twin law rotation along [010] by ±2.4 degrees, with upper-right giving the peak split, which may result for x =0.146. (b) Table shows the refined atomic displacement parameters1 (Å2) for as-grown and annealed crystals of Ba(Fe1-xCox)2As2 with x=0.063. A site occupation ratio of 0.937:0.063 obtained from elemental analysis for Fe/Co atoms at 4d site was used in structural refinement. Polyhedral drawing of the crystal structure of these crystals at the 90% ellipsoid level, is shown on the right. For annealed crystal, there is an overlay of electron density (e Å-3) with iso-surface level shown at 5% of the maximum.
4
For the annealed BaFe2As2 crystal and as evident below, the coupled antiferromagnetic (TN) and structural (Ts) transition temperatures improve while the crystal becomes more homogeneous. For measurements of bulk properties and inferring the transition temperatures, temperature-dependent magnetic susceptibility (χ) data were collected on Ba(Fe1-xCox)2As2 using a Quantum Design Magnetic Property Measurement System (MPMS), in zero-field-cooled or field-cooled modes, with field perpendicular to ab-plane at 10 Oe or 1 Tesla. Temperature-dependent electrical resistivity (ρ) or heat capacity (C) data were collected using a Physical Property Measurement System (PPMS). Hall coefficient (RH) was calculated from the antisymmetric part of the transverse voltage perpendicular to the applied current under magnetic field ±6 T reversal at fixed temperature. Figure 3a represents thse results on BaFe2As2. In the bulk properties, the shift of anomalies due to antiferromagnetic transition from TN = 132 K to 136 K is similar to those reported [13]. There is no change in the heat capacity Sommerfeld coefficient (γ o 6 mJ/K2mol) upon anneal. The RH results on as-grown crystal is similar to those reported [29,30], although its magnitude increases for annealed crystal probably due to higher electron mobility. For finding the structural and magnetic ordering, single-crystal neutron diffraction was performed on ~ 0.02 gram pieces of the parent, measured at the four-circle diffractometer HB-3A at the High Flux Isotope Reactor at ORNL; neutron wavelength of 1.546 Å was used from a Si-220 monochromator [31]. In Figure 3b, the neutron diffraction results for the changes in nuclear and magnetic structures are shown. Comparing the tetragonal, T, (220)T Bragg peak for BaFe2As2 at 4 K and 200 K, there was not sufficient resolution to observe the peak splitting similar to others reported [32,33]. However, the intensity change with temperature due to peak broadening or extinction effect indicates the tetragonal-orthorhombic structural transition (Ts), as seen by the temperature dependence of peak intensity. The stronger intensity change in annealed crystal indicates the larger tetragonal-orthorhombic lattice distortion compared to as-grown. The peak intensities of the magnetic Bragg reflection (½½5)T versus temperature are also plotted here. We confirm that structural and magnetic transitions start at 132 K while for annealed crystal they occur at ~136 K, similar to transitions inferred from bulk properties. Our neutron diffraction results are also consistent with the combined result of magnetic susceptibility and X-ray diffraction measurements that showed that increase in structural and magnetic phase transitions are coincident [34].
Figure 3: Increase in the coupled antiferromagnetic (TN) and structural (Ts) temperatures upon annealing BaFe2As2 crystal. For BaFe2As2 crystals of asgrown (in black) and annealed (in red), temperature dependence of anomalies in (a) magnetic susceptibility (χ), heat capacity (C) and Hall coefficient (RH), and (b) structural and magnetic Bragg neutron reflections. In (b), temperature-dependence of the peak intensity change of the tetragonal (½½5)T magnetic reflection and (200)T structural Bragg peaks are shown.
5
The annealing of BaFe2As2 results in a more electronically homogeneous crystal, which is most probably due to lattice strain relief, confirmed here from scanning-tunneling microscopy/spectroscopy (STM/S) statistical analyses here on local areas. STM/S experiments were carried out with mechanically cut Pt-Ir tip in ultra-high vacuum variable temperature-STM chamber. The x=0 crystals of as-grown and annealed were mounted on a moly plate side by side to do a direct comparison between the two by keeping all the experimental conditions same. The samples were cleaved in situ at ~ 120 K and immediately transferred to STM head, which was precooled at 90 K. Topographic images are acquired in constant current mode with the bias voltage applied to the sample. Differential conductance (dI/dV) spectra were calculated numerically by taking derivative of current-voltage (I-V) measurements. Figure 4a gives the STM results of a large-scale image of as-grown parent crystal surface; atomically-resolved images have already been reported [35]. We see hundred nanometers wide flat terraces on both cleaved as-grown and annleaed BaFe2As2 crystalline surfaces; the most common step terrace height is 0.75 nm, which is about half of a unit cell in c-axis. Zooming on the flat terrace reveals spatial bright and dark nanoscale regions shown in Figure 4b; line profile across the surface indicates a height variation of less than 1 Å (inset). These height variations are too small to be caused by missing atoms in the top layer, and hence most likely related to electronic inhomogeneity due to the fact that STM image is a convolution of spatial variation in the topographic height and the local density of states. The insets of Figure 4c show the spatial map of dI/dV spectra at 25 meV, measured in a region with a step edge that appears as a bright line (marked by the arrow) at 90 K. The conductance map on the two flat terraces (as-grown is top; annealed is bottom) looks homogeneous, and an average dI/dV spectra over the whole area exhibits a V-shape (black curves), which is consistent with earlier reported tunneling spectroscopy measurements on the parent compound [36]. However, a detailed analysis reveals different dI/dV spectra in different areas on the surface. Each colored curve is an average of 1250 individual spectra taken in the areas of (200×100) nm marked by corresponding color rectangle in the inset of each figure. For the as-grown crystal (Figure 4c, top), in one area, the dI/dV spectra (red curve) exhibits a peak near the Fermi level at 25 mV surrounded by two dips at -125 mV and 85 mV, in contrast to having a single minimum at 65 mV in the adjacent area (blue curve). In another area (green curve), peak at 25 mV is suppressed and result in a more U-shaped dI/dV spectra. The origin of the peak near the Fermi level is unknown at present, and has been also observed in golddoped BaFe2As2 [37]. Nevertheless, these results indicate that as-grown BaFe2As2 crystal is electronically inhomogeneous at local scales, and the averaging of differential conductance spectra over a large area hides information. A similar analysis done with the dI/dV map taken on the annealed crystal (Figure 4c, bottom) shows that annealed sample is comparatively electronically homogeneous as the dI/dV spectra taken at various locations on the surface are qualitatively similar to the one averaged over the whole area (black curve). All the curves show a V-shape with local minimum at 45 mV. However, occasionally a peak type feature appeared near the Fermi level similar to red curve on annealed BaFe 2As2 sample with variation in the peak position from -15 mV to 35 mV. In order to observe local chemistry, thin Transmission Electron Microscopy (TEM) specimens of the parent was prepared by focused-ion-beam (FIB), and subsequently by ion milling with liquid nitrogen cooling at a weak beam of 1.5 kV and 3 mA. The conventional TEM and atomic resolution aberration-corrected scanning STEM studies were carried out on an aberration-corrected FEI Titan S 80-300 equipped with a Gatan Image Filter (Quantum-865) at 300 kV. Z-contrast STEM-HAADF (high angle annular dark field) imaging was performed with a probe convergence angle of 30 mrad and an inner collection angle of 65 mrad. STEM images have been reported on various members of iron-based superconductors along different crystallographic projections [38] with high angle annular dark-field detector (HAADF) mode, in which the image’s intensity is proportional to Z1.6-2. Figure 4d shows a typical plane-view of STEM-HAADF image of BaFe2As2. The beam parallel to [001] projection resolves the Ba+As, and Fe columns appearing in bright and medium light, respectively. Although no analyzes of such images were performed along many microns, we suspect that there is some local strain relief for annealed crystalline lattice. For example, our previous study on CaFe2As2 parent annealed (350 C) crystal with TN=168(1) K showed a strain relief through local 0.2 Å atomic displacements found in-plane HAADF images [39]. 6
Figure 4: The improved electronic homogeneity in annealed BaFe 2As2 crystals. For as-grown BaFe2As2, inplane topographic STM image of (a) cleaved surface showing large atomically flat terraces (Vs=-0.5 V, It=20 pA), (b) a close-up of a flat terrace with tunneling conditions Vs=-0.5 V, It=20 pA, and inset is a line profile taken along the dashed blue line. (c) For as-grown and annealed BaFe2As2, slices of dI/dV maps at 25 meV energy (size for maps is 1000×400 nm, shown in top insets, where spatially averaged differential conductance in smaller locations are marked by corresponding colors and sizes of 200×100 nm); all the dI/dV spectra are offset in y-direction for clarity. In the surface morphology maps, there are step edges that appear as bright lines (marked by arrows). (d) For BaFe2As2, a typical STEM-HAADF image of BaFe2As2 along [001] orientation.
In order to gain insight on TN changes for BaFe2As2, our first principles calculations here indicate a strong sensitivity of magnetism to structure, consistent with our previously shown strong magnetoelastic coupling [40]. We performed theoretical calculations using the all-electron code WIEN2K [41], within the local density approximation, and using the low-temperature orthorhombic structure. As in [40], we have computed the magnetic ordering energy, defined as the difference in energy E between the groundstate ‘stripe’ structure and the ‘checkerboard’ structure of the parent compound and several structural modifications, as presented in Table 1. Within a mean-field approximation, this energy difference is proportional to the TN. We note that while the structural modifications described here might be envisioned as application of pressure, one may view them as arising from changes in average lattice parameters caused by synthesis condition or thermal annealing. Indeed, in Figure 1b we see an approximate 0.1% decrease in planar lattice parameter (within the tetragonal phase) from annealing. Consistent with this experimental fact, we find that the application of uniform compressive pressure (“hydrostatic”), or along the c-axis (“c-axis uniaxial”) substantially decreases the ordering energy, and hence the Néel temperature in these calculations. For in-plane changes, however, the situation is more complex, and indeed we find that the application of 1% compression along the ferromagnetic Fe-Fe alignment direction (“FM uniaxial”), combined with a 1% tensile stress along the antiferromagnetic Fe-Fe direction, in fact increases the ordering energy by 9.2%. Such an increase is roughly consistent with the observed 3% increase in TN we observe from the annealing, particularly when one considers that the observed decrease in planar lattice parameters would generally be expected to increase the exchange interaction. The suggestion of these results is that slight structural changes can be responsible for the observed TN change. 7
Table 1: Calculated ordering energies for several structural modifications of BaFe 2As2 parent, as could be produced via hypothetical lattice-parameter changes. scenario baseline hydrostatic c-axis uniaxial FM uniaxial AF uniaxial
a (%) -1 +1 -1 +1
b (%) -1 +1 +1 -1
c (%) -1 -2 -
E (meV/Fe) 49.41 42.14 42.29 53.97 44.78
% change from baseline -14.7 -14.6 +9.2 -9.4
For superconducting Ba(Fe1-xCox)2As2 crystals annealing produces sharper and higher Tc values, while for optimally-doped crystal critical-current-density (Jc) also increases. In the annealed crystal, there is probably nanoscale phase separation of cobalt-depleted and cobalt-rich regions within the same crystal, diminishing the overall distribution of chemical and electronic disorder, leading to the formation of more uniform electronic regions of enhanced or no superconductivity, as is demonstrated below. Figure 5 shows temperature-dependent results of resistivity (ρ) and magnetic susceptibility (χ) for under-doped x=0.023, optimally-doped x=0.063, and over-doped x=0.146 crystals. For x=0.023 (Figure 5a), annealing reduces the overall magnitude of ρ and χ, while shifting the TN value from ~ 90 K to 93 K. For x=0.063 (Figure 5b), annealing shows both higher and sharper Tc and a lower normal-state resistivity, and although χ magnitude is increased slightly at lower temperatures and 1 Tesla, the Meissner fraction is slightly increased at 10 Oe with improvement of Tc. For x=0.146 (Figure 5c), annealing produces bulk superconductivity at higher temperature of ~ 12 K, even though the absolute values of ρ and χ increase. A broad superconducting transition temperature in magnetic susceptibility was observed frequently for overdoped crystals, ascribed to most inhomogeneous cobalt-doping composition [19]. For annealed crystal with x=0.063, the rise in Tc is confirmed with anomalies in heat capacity (not shown), although there is no change in the electronic contribution (γ3 mJ/K2mol). Jc values were inductively (magnetically) determined by applying the modified critical state model [42,43] to the magnetic hysteresis via the relation Jc=20M/[a(1-a/3b)]. This relation applies to a rectangular solid with field perpendicular to a face with sides b > a. Sample dimensions were 1.52 1.50 0.162 mm3 for as-grown crystal, and 1.62 1.69 0.345 mm3 for annealed crystal. Here, M=M--M+ is the magnetic hysteresis, where M-(M+) is the magnetization at temperatures T measured in decreasing (increasing) field H history. With the superconducting crystals in perpendicular field geometry, the flux density B can be replaced by μoH to a close approximation. Fields in the range 0 - 6.5 T and in the c-direction were applied at different fixed temperatures (5 to 18.5 K) and the moment generated by the induced flowing current in the crystal was measured; before beginning measurement, the magnet was reset to eliminate any trapped flux and assure zero H. Figure 6a shows improved Jc values for annealed crystals. Jc values are calculated at two different temperatures below Tc, and as a function of applied field H. The ‘fishtail’ Jc peak effects have been observed and reported in similar crystals [44-47]; Jc is fairly constant at very low fields (up to 0.07 T), then starts to drop off (from about 0.08 to 0.6 T), and can gradually increase and fall again. This feature may indicate the presence of nanoscale phase separation into regions of weaker superconductivity, perhaps caused by an inhomogeneous distribution of the cobalt [48]. Also for both crystals, Jc does not fall off too rapidly with the application of magnetic field; this implies its weaker dependence on H. The Jc in the annealed crystal is more than four times larger than that measured in the as-grown crystal at very low fields, while it is about three times larger at intermediate and higher fields. The annealed sample has a self-field Jc of about 1 MA/cm2 at 5 K, which compares favorably with those measured in Co-doped BaFe2As2 epitaxial films deposited on LSAT and MgO substrates at 1-4 MA/cm2 at 4 K [49]. Other Jc values of 0.4 MA/cm2 at 4.2 K [44] and 0.26 MA/cm2 at 5 K [46] have also been reported. Further insight into the pinning strength can be achieved when the temperature dependence of Jc is analyzed, shown at an applied field H = 0.2 T (Figure 6b). Superconductors with a weak pinning behavior such as ours usually exhibit an exponential decrease in Jc with temperature at low applied fields, owing to the low effectiveness of point-like defects against thermal activation of vortices [50]. Strong pinning mechanisms, 8
such as correlated disorder pinning instead exhibit more smooth temperature dependence. The enhancement in Jc in the annealed sample is attributable to cobalt clustering seen as defects in the plane view (seen in microscopy images, below), giving rise to better pinning.
Figure 5: The improvement in superconducting critical temperature (Tc) signals upon annealing Ba(Fe1xCox)2As2 crystals. For Ba(Fe1-xCox)2As2 crystals of as-grown (in black) and annealed (in red), temperature dependence of resistivity (ρ; top row) and magnetic susceptibility (χ; bottom row) for (a) x = 0.023, (b) x = 0.063, and (c) x = 0.146.
Figure 6: The increase in superconducting critical current density (Jc) for annealed optimally-doped Ba(Fe1-xCox)2As2 crystal. For x = 0.063 and as-grown (in black) and annealed (in red) crystals, (a) field dependence of critical current density (Jc) below Tc, and (b) temperature dependence of Jc at 0.2 Tesla.
Figure 7 gives evidence of chemical clustering in annealed superconducting crystal. Thin TEM specimens of Ba(Fe1-xCox)2As2 with x=0.063 were also prepared as described above. Also, electronenergy-loss-spectroscopy (EELS) data were collected in STEM mode using a dispersion of 0.25eV per channel, a 5 mm aperture, and a collection angle of 40 mrad. Some EEL spectra and EELS mapping were acquired on a Nion UltraSTEM 100TM operating at 100 kV [51] equipped with a 5th order probe aberration corrector and a Gatan Enfina EEL spectrometer. STEM images of several micron areas on two 9
pieces of each of as-grown versus annealed x= 0.063 were comparable. STEM results can give bulk chemical nature, as they are the average signal of many atomic unit cells along the beam direction. As shown in Figure 7a, the low-magnification image along [001] that which STM/S were analyzed, show differences: uniform contrast in as-grown crystal indicates chemical homogeneity (top), however, the nano-clusters (dark regions) in size of around 10 nm or smaller in annealed crystal indicates chemical non-uniformity (bottom) that can be separated by more than 100 nm. Typical atomic resolution image on either crystal is shown in the inset of top image, and shows no visible defects. EELS results are shown in Figure 7b, indicating chemical inhomogeneity for annealed crystal and two types of nano-clusters: one type of nano-cluster regions shows weaker Ba signal (top spectra; collected on Titan at 300 kV), while the other one reveals stronger Ba signal (bottom spectra; collected on Nion 100 at 100 kV). The EELS mapping of the latter type was performed and is shown in Figure 7c, demonstrating such chemical inhomogeneity. Since Co L2,3 edge overlaps with Ba M-edge, the weaker or stronger Ba M-edge in the nano-clusters could be the result of less or more cobalt. In support of this and as evident in refinements of unit cells above, c-parameter should increase if there is less cobalt substituted in the 122 structure, i.e. it is possible that cobalt precipitates out by forming grain boundaries, leaving the main matrix of annealed crystal having less cobalt. Figure 7: Evidence of chemical clustering in annealed optimally-doped Ba(Fe1-xCox)2As2 crystal: (a) Typical STEM HAADF images along [001] showing chemical homogeneity for as-grown (top) versus nano-clusters in annealed (bottom) crystals, the insets are typical electron diffraction patterns and atomic resolution image. For annealed crystals, two different types of nano-clusters showing chemical inhomogeneity as revealed by (b) EEL spectra and (c) EELS mapping for one type of nano-clusters.
Such chemical non-uniformity should effect local electronic structures. Although the surfaces of BaFe2As2 are known to reconstruct, the superconducting gaps from different surface reconstruction are expected to be almost identical since the superconductivity is a global property and ~3 nm coherence lengths are found for these materials [52-54]. In fact, for Ba0.5Sr0.5(Fe1-xCox)2As2 with x=0.073 as-grown crystal (Tc=17K), scanning tunneling microscopy/spectroscopy (STM/S) results of at 4.3 K found inhomogeneous gap values from about 3 meV down to 0 meV [20]. For Ba(Fe1-xCox)2As2 crystals, Figure 8 demonstrates STM/S results at 4.2 K and the smaller variability in superconducting gap maps for the annealed x=0.063 crystal. For x=0.063 crystals, both as-grown and annealed pieces were cleaved in situ at ~ 100 K and then immediately transferred to STM head which was precooled at 4.2 K. Topographic images were acquired in constant current mode with the bias voltage applied to the sample. The dI/dV spectroscopies were obtained using the lock-in technique with bias modulation Vrms = 0.5 mV at 973 Hz. Figure 8a shows the topographic images acquired from the set of crystals. While the large-scale 10
morphologies of the surfaces are essentially the same for the two, the detailed atomic-level structures may show some discrepancies from cleavages, consistent with the reported cleavage dependent controversies from the literature [52]. To reveal the real space superconductor gap information from the crystals, the current-imaging-tunneling spectroscopy (CITS) were carried out; Figure 8b gives the normalized dI/dV spectroscopy averaged over the whole areas of (a). By fitting the dI/dV spectroscopies using the standard functional form from Dynes et al [55] the gap Δ maps can be deducted from the CITS images, as shown in Figure 8c. In the map of the as-grown crystal, much more dispersed electronic regions with different gaps are seen, while in the map of the annealed crystal, there are larger areas of non-superconducting clusters and the green regions with gap ~5 meV is more prominent and are connected. The statistic histogram distributions of the superconducting gaps in Figure 8d show that the peaks of the gap are located at 6.6 meV and 5.0 meV, respectively for as-grown versus annealed, with full-width-at-halfmaximum (FWHM) of 4.9 and 4.0. The main difference between the two gap distributions is a much higher probability at Δ=0 for the annealed crystal, supporting the higher pinning sites suggested by higher Jc. The smaller FWHM for the annealed sample means narrower gap distribution, consistent with the sharper superconductivity transition, shown in bulk properties. The extracted corresponding gap-to-Tc ratios R=2Δ/kbTc from the peaks of the gaps are 6.7 and 4.6, respectively, using Tc=23 K and 25 K for the as-grown and annealed crystals. Although in the weak coupling s-wave BCS theory the R is a constant of 3.53, the d-wave symmetry of the order parameter in cuprate superconductors makes the ratio to a larger value of 4.28 and higher [56]. Furthermore, recent studies found R of electron or hole doped BaFe2As2 can vary from 2.2 to 10.3 [53,57-61]. Therefore, in the annealed crystal, there is evidence of nanoscale phase separation (cobalt clustering) into cobalt rich and deleted regions reducing the local lattice strain introduced by doping directly within the Fe planes, giving sharper and slightly higher Tc. Such nano-size chemical phase separation of cobalt may be responsible for the higher Jc value. With regards to the effects of annealing on the superconducting state, it is rather remarkable that annealing increases Tc while significantly decreasing the average superconducting gap size. Usually a smaller gap correlates with a decreased Tc, given that most theories predict a constant ratio of the gap to Tc, within a weak-coupling regime. One clue to the origin of this unusual behavior can be found in the averaged dI/dV curves. One notes that the coherence peaks located at approximately ±5 mV are significantly sharper in the annealed sample, and reach greater heights and form better-connected percolating regions. In these samples, these features are ultimately controlled by two factors: the amount of quasiparticle scattering in the sample (discussed below), as well as by the distribution of gap values. A sample with a narrower distribution of gap values, as we observe in the annealed sample, will also tend to have higher and sharper coherence peaks when the resulting dI/dV curves are averaged over many locations. Quasiparticle scattering is typically modeled by the parameter introduced by Dynes. In a pure s-wave sample, the scattering modeled by does not typically affect Tc substantially, if the scattering originates in a non-magnetic manner (Anderson’s theorem). However, for more complex pairing symmetries such as s+/- or d-wave, such scattering can greatly impact Tc, with the magnitude of the effect dependent both upon the specific pairing symmetry as well as the strength of the scattering. We therefore suggest, in addition to inducing a narrower distribution of gap values, that the annealing in some manner reduces the quasiparticle scattering, and thereby the pair-breaking effects of such scattering, thus raising Tc. Complicating such an interpretation, however, is the substantially larger fraction (12%) of small (