Improving Representational Competence in Chemistry with Model-Based Feedback Shamin Padalkar (
[email protected]) Mary Hegarty (
[email protected]) Department of Psychological & Brain Sciences, University of California, Santa Barbara Santa Barbara, CA 93106 USA
Abstract
Diagrams Used in this Study
Representational competence is an important component of learning Organic Chemistry. However, students are seen to be incompetent in translating from one kind of molecular diagram to another. An instructional method informed by spatial cognition research was designed and administered individually. The instruction involved having students check their solutions by attempting to match concrete models to their solution. The instruction helped students in the experimental group to identify their mistakes, understand the usefulness of concrete models and lead to large improvements in performance for the experimental group. Keywords: concrete visualization.
models;
chemistry
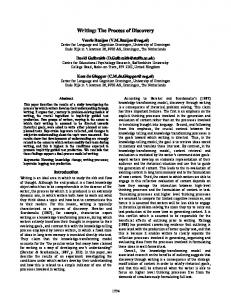
Dash-Wedge Diagram (Sometimes referred to, as perspective formula): In a Dash-Wedge diagram (Figure 1a), the molecule is oriented with the backbone carbons 1 at the two 4-way intersections of lines on the left and right of the diagram. Dashed lines represent bonds to atoms that are going into the page (below the plane of the paper). Wedge lines represent atoms that are coming out of the page (above the plane of the paper). Solid lines represent bonds to atoms that are in the plane of the paper.
CH3
education;
HCH3
HH33CC
Introduction The literature in science education and chemistry education in particular, shows that interconnected cognitive skills, such as visualization, construction of mental models, model based reasoning, and representational competence are essential for acquiring mastery in the discipline (Kozma & Russell, 2005; Coll, 2006; Justi and Gilbert 2006; Treagust & Chittleborough, 2001). Kozma & Russell (2005) define ‘representational competence’ in the context of chemistry as ‘a set of skills and practices that allow a person to reflectively use a variety of representations or visualizations, singly and together, to think about, communicate, and act on chemical phenomena in terms of underlying, aperceptual physical entities and processes’. Representational competence is particularly important in organic chemistry. Organic chemists use several different representations of molecules, including different kinds of diagrams, models, and equations, for different purposes. For example, three kinds of diagrams are commonly used in organic chemistry and are introduced in the introductory college course on this topic. Mastering these diagrams is challenging, because they use different conventions to represent the three-dimensional (3-D) arrangement of atoms in the molecules in the two-dimensions of the printed page. They are also drawn from different orthogonal perspectives. This paper describes a study in which we examined students’ ability to translate between these models, and tested an educational intervention that was designed to improve their representational competence using 3-D molecular models. Examples of the three types of diagrams are given in Fig. 1 and their conventions and a brief description of each is given below.
H
H
OH
H
CH H 3
HOH 3C
CH CH3
H3C
H
3
CH3
a. Dash-Wedge diagram
b. Newman projection
CH3 HO
H
H
H CH3
c. Fischer projection d. Ball-stick model Figure 2: 2-Butanol molecule presented in three types of diagrams and concrete models used in Figure 1: 2-Butanol molecule presented in this threestudy types of diagrams and concrete models used in this study Newman Projections: In a Newman projection (Figure 1b), the molecule is oriented with one backbone carbon in front of the other. The front carbon is located at the intersection of the 3 lines (noon, 4 o’clock and 8 o’clock around the circle). The substituents (atoms or groups of atoms) at the ends of these three lines are attached to the front carbon. The rear carbon is behind the circle. The substituents at the ends of the shorter lines connected to the circle (2 o’clock, 6 o’clock, and 10 o’clock around the circle) are attached to the rear carbon. 1
Carbon backbone: longest series of covalently bonded carbon atoms in an organic compound.
2162
Fischer Projections: In the Fischer projection (Figure 1c), the atoms at the right and left of the horizontal lines are coming out of the page (above the plane of the paper) and the atoms at the top and bottom of the vertical line are going into the page (below the plane of the paper). The two backbone carbons are located where the horizontal lines cross the vertical line. These carbons are in the plane of the paper. The arrangement of atoms is of great importance in Chemistry, because even if the chemical formula is same, different arrangements of atoms result in different chemical properties. Dash-Wedge, Newman and Fischer diagrams serve different functions and hence chemists are often required to translate from one diagram to another. Ability to perform this representation translation task is also a measure of students’ understanding of the 3-D structure of a molecule, as well as the conventions of a diagram, and prepares them for further problem solving. Therefore representation translation problems are included in typical assessments in organic chemistry classes. Since it is difficult to visualize the 3-D structure of molecules from these diagrams, concrete, 3-D models (see Figure 1d) are sometimes used as pedagogic tool. A model represents the 3-D structure of the molecule directly, and therefore does not depend on remembering conventions for how the three dimensions are represented in a 2-D diagram. Furthermore, in translating between diagrams of molecules from different orientations, a student can rotate a physical model and observe the results, rather than having to perform difficult internal spatial transformations (mental rotation or perspective taking). This corresponds to what Kirsh (1997) referred to as a complementary action, that is, an action performed in the world that relieves the individual of the need to perform an internal computation. However chemistry instructors differ in their use of models. Some chemistry teachers use models while teaching and encourage their students to use them, but others rarely use models. In recent studies (Stull, Hegarty, Dixon, & Stieff, submitted), undergraduate students were asked to translate between different kinds of diagrammatic representations of organic molecules and concrete models were made available to them. In different conditions across three experiments, students were encouraged to use the models and the correspondence between the models and diagrams was explicitly pointed out to the students. Students performed poorly on the representation translation task. When models were made available to them, many of the students did not use the models. However, those students who used the models performed significantly better on the diagram translation task. In conclusion, if models are used, they are extremely helpful in the translation task, but many students face a barrier to using them. Thus, just providing models is not enough; research is required to develop an appropriate instructional method for scaffolding the use of models.
Exploratory study In order to explore what strategies students use to solve the translation problems and how they interact with models, we first conducted a pilot study. Six undergraduate students were interviewed and asked to think aloud while solving six diagram translation problems. The students were familiar with the diagrams and their conventions. Most of the students used algorithms (rules) and/or internal visualization to solve the translation problems, rather than using models. Interestingly despite making many errors, these students were confident that they were performing the task correctly, which decreased their motivation for exploring the possibility of using models and improvement. That is, students had an illusion of understanding (cf. Rozenblit & Keil, 2002; Dunning, et. al., 2003). Specifically, they did not have clear understanding of the difference between stereoisomers and conformations2. Molecules that are stereoisomers have the same bond structure (in terms of which atoms are bonded with which other atoms) but different structures in terms of the relative locations of the substituents (atoms and groups of atoms) in 3-D space. An informal task in which they were asked to match the concrete model to their solution made students realize their mistake and to use the models effectively. From this study it was clear that (1) the participants need to know that they are making errors and what kind of errors they are making, and (2) they need to be guided to pay attention to the 3-D structure of the molecules as shown in the concrete models.
Experimental Intervention Study A short instruction, which required the participants use the model to check their solution, was designed and tested in an experiment. This instruction served two purposes: First it provided feedback to the participants. Second, it forced them to structurally align the model, therefore making them pay attention to the 3-D structure of the molecules, and revealed how the model could be used to help translate between the diagrams. We compared the accuracy of solutions of a group given this instruction (experimental group) to that of control group who performed the same representation translation tasks, but without the intervention. In addition to the accuracy of their solutions and demographic facts, we measured their spatial ability and general intelligence. Performance of the diagram translation task has been found to be correlated with spatial ability (Stull et al., submitted) but previous studies did not assess its relation to general intelligence. In addition, given that students are overconfident with their responses and many students do not spontaneously use models, we asked 2
Stereoisomers have the same bond structure, but the different geometrical positioning of atoms and functional groups in space (e.g. switching the groups around one or more chiral (asymmetric) Carbon atom, which results into different chemical properties. However, rotation around C-C sigma bond results in a different conformation of the same molecules and it has the same chemical properties.
2163
them to judge their levels of confidence and the usefulness of models before and after the interventions. We also videotaped the students while they performed the task and coded whether or not they used the models on each trial.
Experimental Task Students solved 18 problems (6 pre-test, 6 post-test and 6 transfer) in which they were provided one kind of diagram of a molecule (e.g., a dash-wedge diagram) and were asked to draw another kind of diagram (e.g. a Newman diagram) for the same molecule. The worksheet (8.5” x 11”) included an instruction on the top and a diagram below it. Solution space on the work-sheet for the pre-test was divided into two equal parts by a horizontal line and participants were asked to draw their solution above the line. Post-test worksheets were not divided and participants were allowed to draw their solution wherever they wished.
Aptitudes as a test of general reasoning ability (40 items, no time limit). Participants were videotaped with their consent. The video camera was situated 2 feet above the table, usually on the left side of the participant. The experimenter sat to the left side of the participant, gave relevant instructions, provided relevant models and occasionally monitored the video camera. Participants saw only one model at a time, that is, the model of the molecule in the problem they were solving; the others were kept behind a screen. The assembly is shown in Figure 2.
Research Design The experiment followed a pre-test post-test design with control and experimental groups. Both experimental and control groups were first given basic instructions, which included the nature of the task, examples of three kinds of diagrams (see Figure 1) and their conventions (as described earlier). Participants were told that the instruction sheet would be kept, face down on the table and they could refer to it as necessary. They were also given a concrete (Ball & Stick) model3 and reminded of the color codes for the different atoms in the models. The model was positioned in a clay stand. The experimenter demonstrated that the concrete model could be taken out of the stand and that it could be rotated in space and around the main carboncarbon bond. The pre-test consisted of six problems involving 4-Carbon molecules. It was followed by a short questionnaire on participants’ level of confidence in their solutions and the usefulness of the concrete models. Then the experimental group went through a training intervention (described below) and the control group participants were given a 5minute break. The post-test included a second set of six problems with 4-carbon molecules (enantiomers, or, mirror images) of the molecules in the pre-test problems and six 5carbon problems. We refer to the set of 5-carbon problems as transfer problems, although they were very near transfer. The post-test was followed by a questionnaire which included questions about demographics and the same statements about confidence and usefulness of models as in the pre-test questionnaire. Finally, all participants completed the Vanderberg and Kuse (1978) Mental Rotation Test as a test of spatial ability (20 items administered in two 3 minute blocks) and Abstract Reasoning Test from the Differential
3
We used a ‘Fundamental Organic Chemistry Set’ manufactured by HGS Hinomoto Plastic Co., LTD (see Fig. 1d).
Figure 2: Assembly for the study
Intervention
The intervention involved directions for participants to use models to check their own solutions and to draw correct solutions, if any of their solutions were found to be incorrect. In the beginning of the intervention, participants were told “We are going to check the solutions”. They were provided the concrete model for each problem and each problem was checked in three steps. Participants were provided help at each step if necessary. As a first step and were asked to match (i.e., structurally align) the model with the given diagram (cf., Gentner, 1983). This gave participants an opportunity to confirm that the given model indeed represented the given diagram and also gave practice in seeing the correspondence between model and diagram. In the second step of the intervention, participants were asked to align the model with their solution to the problem (which was drawn above the horizontal line). If the participant had drawn a correct solution, once s/he matched aligned the model with the solution, s/he was asked to move to the next problem. If the solution was incorrect, it would not be possible to structurally align the model with the solution. In this case, s/he realized that the model could not be matched and the solution was incorrect. The third step involved drawing a new corrected solution (below the horizontal line). If the participant again drew an incorrect solution, Steps 2 and 3 were repeated. This was necessary for only 16 participants (on a total of 25 trials, i.e. an average of 1.56 trials per participant). If the participant drew an incorrect solution on the third attempt, he/she was told his/her mistake and was asked to go to the next problem. There was only one participant who could not draw the correct solution even after 3 cycles, and that was only on one trial.
2164
Participants
Coding of Model Use
The experimental group consisted of 30 participants (15 females) and the control group consisted on 24 participants (12 females), all undergraduate students at a research university. These students had completed at least one course in Organic Chemistry, in which they had been introduced to the three types of diagrams of organic molecules. The two groups did not differ in age (average = 20.3 years), spatial ability (average MRT scores = 35.67), general intelligence (average abstract reasoning test scores = 28.94), GPA (average = 3.15) or number of years in college (average = 3). The participants received course credit or $20 for their participation.
Participants’ use of the models was coded using the videos. Each trial was coded for whether or not participants moved the model in any way during each trial. Whenever participants moved the model it was coded as a use of the model. Pointing at the model (which happened extremely rarely) was not counted as using the model.
Coding of Diagrams The data were coded in 2 ways: Number of correct solutions: A score of ‘0’ or ‘1’ was assigned to each problem. A drawing had to be completely correct to receive a score of 1. The sum of correct solutions served as the total accuracy scores for the pre-test, post-test, and transfer problems. Level of accuracy: Depending upon the type of error a level of 0 to 2.5 was assigned to each problem. In this scoring scheme, level 0 was assigned if a participant drew the wrong type of diagram or drew a diagram with missing or additional substituents. Level 1 was assigned when the diagram drawn was made up of the correct substituents, but these were incorrectly connected to the central carbon atoms. If the substituents were attached to the correct carbon atoms, but their 3-D spatial arrangement was incorrect, level 2 or 2.5 was assigned depending upon whether the mistake was made on both sides of the molecule (level 2) or only on one side (level 2.5). A fully correct diagram was assigned a level of 3. In addition to scoring the level of understanding for each problem, a student was assigned to a level of understanding (ranging from 0 to 3) if two_thirds of their solutions (4 of 6) were at or above this level of understanding for the pre-test, post-test, and transfer problems. Data for 20 participants were coded independently by two researchers to establish the inter-rater reliability. Cohen’s Kappa for the scores of pre-test, post-test and transfer problems together was 0.977.
Results Analysis of Correct Solutions: Performance of the control and experimental groups on the pre-test, post-test and transfer problems is shown in Figure 3. The control group and experimental group had relatively poor performance on the pre-test, consistent with previous studies (Stull et al., submitted) and did not significantly differ on the pre-test, t (52) = 1.844, p = .07. The experimental group performed significantly better after the intervention than before, t (29) = 9.344, p < .001, and scored significantly better than the control group on the post-test, t (52) = 4.06, p < .001. The average score for this group on the transfer problems is almost the same as for the post-test for the experimental group, t (29) = .162, p = .87, indicating that what was learned from the intervention transferred to solving slightly more difficult problems.
Figure 3: Average scores The control group improved significantly from the pretest to the post-test, t (23) = 2.18, p < .05, and from the posttest to the transfer problems, t (23) = 2.41, p < .05, thus making the difference between scores of the pre-test and transfer problems significant, t (23) = 3.72, p = .001. Despite this, the experimental group outperformed the control group on the transfer problems, t (52) = 3.08, p< .01.
Figure 4: Percentage of participants at each level in the experimental and the control group
2165
Thus, the intervention was successful and lead to very accurate performance (approximately 5 out of 6 problems solved correctly) on the post-test and transfer problems; although the control group spontaneously improved, they solved less than half of the post-test and transfer problems correctly. Analysis of Levels of Accuracy: In the pre-test, the majority of students’ drawings were at level 2.5 indicating that they understand the connectivity between the molecular substituents, but not their relative locations in 3-D space. In the post-test and transfer problems, the majority of students in the experimental group were at level 3, i.e., fully correct solutions. For the control group, the number of students performing at level 3 gradually increased (Figure 4). At the final (transfer) phase of the experiment 83% of participants in the experimental group and 58% of those in the control group were performing at Level 3. Correlations: As Table 1 shows, for the control group, scores on the pre-test, post-test and transfer correlated with each other. However this was not true for the experimental group. Participants in the experimental group performed well in post-test and transfer problems, regardless of their performance in the pre-test, which shows that the intervention was successful, irrespective of students’ initial ability to do this task. As expected, scores on the pre-test and post-test correlated with scores on the mental rotation test (MRT) but this test was not significantly correlated with the transfer problems. The abstract reasoning test was correlated with performance only for the control group. Partial correlations of MRT with drawing performance, controlling for abstract reasoning, were significant for the pre-test (0.34* pooling all participants). However, the correlations of MRT with the post-test and transfer problems were not significant. Thus, spatial ability is an important predictor of performance in the pre- and post-test but as the participants become familiar with the task, spatial ability becomes less important. Table 1: Correlations (‘*’ indicates a significant correlation) Scores
Pre-test
Post-test
Transfer
Post-test
Ctrl Expt
0.832* 0.095
1
Transfer
Ctrl Expt
0.778* 0.079
0.902* 0.705*
1
MRT
Ctrl Expt
0.480* 0.528*
0.410* 0.361*
0.275 0.134
Abstract reasoning
Ctrl Expt
0.519* 0.238
0.441* 0.311
0.410* 0.130
Students’ perceptions about models and confidence level: Students were given six statements (shown in Figure 5) to judge on scale of 1 to 5 after both the pre and post-test.
The arrows indicate the shift in their judgments from pretest to post-test, with the experimental group shown in blue and the control group shown in red. Although overconfident in the pre-test, after the intervention, participants in the experimental group were significantly more and appropriately confident. They found models to be more helpful, and they recorded that they used the models more after the intervention. I am confident about my solutions. Strongly agree
2
3
4
Strongly disagree
The transformation problems were challenging. Strongly agree
2
3
4
Strongly disagree
The molecular models were helpful. Strongly agree
2
3
4
Strongly disagree
I did not need to use the models. Strongly agree
2
3
4
Strongly disagree
The models helped me visualize the projections. Strongly agree
2
3
4
Strongly disagree
I found it necessary to pickup the models during the task. Strongly agree
2
3
4
Strongly disagree
Figure 5: Shift in students' attitudes (‘*’ indicates a significant difference)
Participants’ use of the models: Participants in the experimental group moved the model on only 35% of trials during the pre-test but this percentage increased to 86% for the post-test and the transfer problems (Figure 6). On the other hand, participants in the control group moved the model on 62% trials in the pre-test and this percentage increased to 68% for the post-test. Thus the intervention was successful in inducing the experimental group to use the models. The tendency for the control group to use the model more in the pre-test appears to be due to sampling error, however it might also explain why these participants spontaneously improved on the problems, even without an intervention.
Figure 6: Percentages of trials on which participants moved the models (‘*’ indicates a significant difference)
2166
Discussion In summary, the intervention was successful. The accuracy of the experimental group increased from 27% to 83%. Although the control group underperformed the intervention group on the post-test, their accuracy steadily increased from 42% to 55% and their scores for the transfer problems were significantly higher than the pre-test scores. Spatial ability was an important predictor of performance on the pre and post-test, but it did not predict performance on the transfer problems, which suggests that spatial ability becomes less important with practice on the task. Participants in the experimental group also showed an increase in confidence level, reported that they found models more useful, and reported that they used the models more often after the intervention. The latter result was validated by objective measures of their use of the models. Analysis of students’ levels of understanding (Figure 4) shows that the majority of participants were at level 2.5 in the pre-test which means that they switched the positions of two of the chemical groups around one of the central carbon atoms in the model. This mistake reflects a lack of understanding of the 3-D spatial relations between the chemical groups. There are two possible reasons for this error. First, participants may not realize the importance of the relative 3-D locations and hence draw a different molecule (an isomer of the correct molecule). Second they might understand the importance of the 3-D structure, but not be able to perform the required spatial transformation. The current experiment does not rule out either of these explanations, but it shows that once participants attempted to structurally align the models with the diagrams, they discovered their error and this in turn lead to increased use of the models and better performance in the post-tests. If students do not understand the importance of the 3-D spatial relations, then giving them constructive feedback, that they drew an isomer, rather than the correct molecule, should be sufficient to improve performance. If they understand the importance of the 3-D relations, but are unable to perform the required spatial transformations, showing them how models map onto the diagrams should help them perform the correct spatial transformations. To identify which of these two reasons played an important role in students’ inability to perform the diagram translation task, we are currently conducting a second experiment which compares a ‘feedback’ condition and ‘model match’ condition. In any case, the current paper documents an intervention that was certainly useful. It took a short time (an average of 17 minutes to check the 6 pre-test problems) and could be accommodated in a laboratory or tutorial session in the context of an organic chemistry class. Further studies will be necessary to examine whether this type of intervention can lead to lasting gains in student performance, and whether the intervention leads to an understanding of the structure of molecules that can improve performance in a situation where students do not have access to models. Although experts often use more abstract rule-based
strategies to translate between diagrams (Stieff, 2007) understanding the 3-D structure of molecules is central to organic chemistry knowledge, and models appear to be an important stepping stone to reaching higher levels of understanding. Also, since models, in contrast to diagrams, are powerful representations having the unique quality of three-dimensionality, they have been an important tool in cutting edge research and hence students should be familiar with strengths and weaknesses of models through their own experience. The general approach of the intervention can be adopted and tested in the instructions of other disciplines such as geology, astronomy, architecture etc. in which threedimensional structure and dynamic properties of the system are very important.
Acknowledgments This research was funded by National Science Foundation Grant DRL 1008650. We are thankful to Andrew Stull, Trevor Barrett, David Sanosa, Emily Steiner, Bonnie Dixon, Mike Stieff for their contributions to the research.
References Coll, R. (2006) The role of models, mental models and analogies in chemistry teaching. In P. Aubusson, A. G. Harrison, S. Ritchie (Eds.) Metaphor and analogy in science education. Springer. Dunning, D., Johnson, K., Ehrlinger, J., & Kruger, J. (2003). Why people fail to recognize their own incompetence. Current Directions in Psychological Science, 12(3): 83-87. doi:10.1111/1467-8721.01235. Gentner, D. (1983). Structure-mapping: A theoretical framework for analogy. Cognitive Science, 7, 155-170. Justi, R. and Gilbert, J. (2006) The role of analog models in the understanding of the nature of models in Chemistry. . In P. Aubusson, A. G. Harrison, S. Ritchie (Eds.) Metaphor and analogy in science education. Springer. Kirsh, D. (1997). Interactivity and multimedia interfaces. Instructional Science, 25, 79–96. Kozma, R. & Russell, J. (2005) Multimedia learning of chemistry. In R. Mayer (Ed.), Cambridge Handbook of Multimedia Learning, 409-428. New York: Cambridge University Press. Rozenblit, L. & Keil, F. (2002). The misunderstood limits of folk science: An illusion of explanatory depth. Cognitive Science, 26, 521-562. Stieff, M. (2007). Mental rotation and diagrammatic reasoning in science. Learning and Instruction, 17, 219234. Stull, A. T. Hegarty, M., Dixon, B., Stieff, M. (submitted) Representational Translation with Concrete Models. Treagust, D. F., Chittleborough, G. (2001), Chemistry: A matter of understanding representations, in J. Brophy (Ed.) Subject-specific instructional methods and activities (Advances in Research on Teaching, Volume 8), Emerald Group Publishing Limited.
2167