Improving Rietveld-Based Clay Mineralogic Quantification of Oxisols Using Siroquant M. E. Alves* Dep. de Ciências Exatas Escola Superior de Agricultura ‘Luiz de Queiroz’ ESALQ/USP Piracicaba, SP, 13418-900, Brasil
O. Omotoso
SOIL MINERALOGY
CanmetENERGY Natural Resources Canada Devon, AB, T9G 1A8 Canada
Although mineralogic quantitative phase analysis (QPA) of the soil clay fraction can provide useful information for the improvement of soil management practices, QPA often requires a combination of several analytical techniques, which can be expensive and time consuming. One alternative that involves a single analysis to give accurate QPA of soils is the use of the Rietveld method to analyze powder x-ray diffraction (XRD) data. In this study, we evaluated the accuracy of the XRD–Rietveld approach for mineralogic quantitative analyses of Oxisol clays when observed structure factors [F(hkl)] of pedogenic minerals (i.e., kaolinite, hematite, and goethite) are used in the Rietveld analyses performed using Siroquant software. The results showed that although the structures of disordered clay minerals are especially difficult to incorporate in standard Rietveld refinement, which relies on ordered three-dimensional structure models, Mineralogic quantification can be accurately done for complex matrices having a large number of phases and various degrees of structural and compositional disorders when observed F(hkl) values are used. It is also possible to develop observed F(hkl) values for Al-hematite and Algoethite from impure samples of such oxides to use as starting structure models for Rietveld analysis. We believe that this approach can be successfully extended to other geologic materials. Abbreviations: LOI, loss-on-ignition; XRD, x-ray diffraction; XRF, x-ray fluorescence.
O
xisols are weathered soils that are widely distributed in tropical regions and cover most of Brazil. In general, kaolinite is the most abundant mineral found in the clay fraction of these soils, followed by variable amounts of gibbsite, hematite, goethite, and Ti oxides (Schaefer et al., 2008). Besides these minerals, it is common to find maghemite making up part of the clay fraction of the basalt-derived red Oxisols (Fontes and Weed, 1991), while, in the less weathered soils, small amounts of hydroxy-interlayered vermiculite and illite are often observed. The minerals found in the clay faction of Oxisols play important roles in both the physical and electrochemical behaviors of these soils. Their microaggregation appears to be related to their high gibbsite (Ferreira et al., 1999) and Fe oxide contents (Pinheiro-Dick and Schwertmann, 1996). On the other hand, kaolinite does not favor discrete microaggregation due to its tendency to form face-to-face arrangements (Ferreira et al., 1999; Schaefer, 2001). The particle aggregation engendered by the oxides tends to increase the porosity of Oxisols (Ghidin et al., 2006) and, therefore, it can be stated that the clay mineralogy not only contributes to enhancing air and water availability to This work was supported by the State of São Paulo Research Foundation (FAPESP). Soil Sci. Soc. Am. J. 73:2191-2197 doi:10.2136/sssaj2008.0365 Received 12 Nov. 2008. *Corresponding author (
[email protected]). © Soil Science Society of America 677 S. Segoe Rd. Madison WI 53711 USA All rights reserved. No part of this periodical may be reproduced or transmitted in any form or by any means, electronic or mechanical, including photocopying, recording, or any information storage and retrieval system, without permission in writing from the publisher. Permission for printing and for reprinting the material contained herein has been obtained by the publisher. SSSAJ: Volume 73: Number 6 • November–December 2009
the plant roots in such soils but also to reducing physical resistance to root elongation. The high and well-documented phosphate sorption exhibited by Oxisols is ascribed to their clay contents of gibbsite, hematite, and goethite (Bigham et al., 1978; Karim and Adams, 1984; Fontes and Weed, 1996). On the other hand, goethite appears to hinder the release of both phosphate and arsenate to the soil solution (Guzman et al., 1994; Ladeira and Ciminelli, 2004). The high sulfate sorption also exhibited by Oxisols is more dependent on the quantities of oxides in the soil than the soil clay content (Alves and Lavorenti, 2004), and the same can be stated for the point of zero salt effect of these soils (Alves and Lavorenti, 2005). Considering the influence of clay mineralogy on the soil physical-chemical behavior, its quantitative characterization can provide important data for the improvement of soil management practices since, in general, detailed mineralogic investigations can indicate the most probable fate of pollutants and plant nutrients added to a soil and can also support a better understanding of the soil electrochemical behavior. In general, combinations of two or more methods such as selective dissolution, chemical, thermal, and spectroscopic analyses, and XRD must be used to accomplish quantitative soil mineralogic analysis. For this reason, the conventional approaches used for this purpose are often expensive and time consuming. Furthermore, some quantitative methods have drawbacks that give rise to inaccurate results. For example, the peak areas observed in kaolinite thermograms obtained by differential thermal analysis (DTA) or differential scanning calorimetry (DSC) are dependent not only on the amount of this mineral in the sample but also on its crystallographic features (Carthew, 1955), so it is very difficult to obtain reliable DTA- or DSC-determined kaolinite contents due to the crystallographic differences that usually exist between the kaolinite used for calibration of these thermal methods and the kaolinite of the sample to be analyzed. 2191
Table 1. Classification, parent materials, location in São Paulo State, and sampling depth of soils. Soil
1 2 3 4 5 6 7 8 9 10 11 12
Classification
Typic Hapludox Rhodic Acrudox Typic Hapludox Rhodic Acrustox Rhodic Acrudox Rhodic Acrudox Typic Hapludox Typic Hapludox Xanthic Acrustox Typic Hapludox Rhodic Acrustox Xanthic Acrustox
Parent material
Location
Depth
m sandstone Aguaí 0.80–1.00 argillites Piracicaba 0.80–1.00 schist Piracicaba 1.00–1.20 basalt Guaíra 0.15–0.30 diabase Leme 0.70–0.80 argillites Cordeirópolis 0.50–0.60 basalt Ribeirão Preto 0.30–0.40 argillites Itirapina 0.30–0.50 basalt Guaíra 0.40–0.60 granite Espírito Santo do Pinhal 1.30–1.50 basalt Miguelópolis 0.15–0.35 diabase Ribeirão Preto 0.40–0.70
The application of the Rietveld method to XRD data is a potential alternative for carrying out accurate and fast soil quantitative mineralogic analyses. This method was proposed in 1969 by H. Rietveld (Rietveld, 1969) for the refinement of crystal structures from neutron diffraction data. Afterward, it was extended to XRD (Young et al., 1977) and to quantitative phase analysis (Hill and Howard, 1987; Taylor and Matulis, 1991). In this approach, a calculated diffraction profile of a mineral mixture, which corresponds to the sum of theoretical patterns calculated for each phase considering its refined structural factors and instrumental effects, is fitted to the measured profile using a nonlinear least-squares procedure. When the best fit is achieved, the experimental and calculated patterns of each phase are related by a scale factor, which allows calculation of the relative phase content (Taylor and Hinczak, 2003). One of the factors that influences the achievement of reliable results using the Rietveld method is the use an adequate structural model for the calculation of the theoretical diffraction profile. In general, such a model is rarely available for soil phyllosilicates because soil minerals often show extensive structural and compositional disorder in their lattices and therefore diffraction profiles different from those of the more ordered analogous ones. Taking into consideration that the convergence of a nonlinear least-square procedure to a reliable minimum depends on the closeness between the initial iterative value and the real one, a lack of reasonable agreement between the theoretical and measured diffraction profiles can invalidate the application of the classical Rietveld method to disordered minerals. Taylor and Rui (1992) proposed an alternative to overcome this by using observed structure factors [F(hkl)] extracted from the XRD patterns of the disordered minerals. A database containing files with empirical F(hkl) values, also called hkl files, was then incorporated into the Rietveldbased software Siroquant (Taylor, 1991) enabling its application for the quantification of poorly ordered minerals. This approach, among others, can be useful, for instance, for Rietveld-based kaolinite quantification in soil materials since weathering gives rise to a high degree of disorder in this mineral in tropical soils. Some Rietveld refinement programs that have been successfully applied to clay-bearing rocks have different ways of handling structural and compositional disorder in phases without published three-dimensional structure. For example, BGMN and AutoQuan (Bergmann and Kleeberg, 1998) use a novel method to model spe2192
cific mineral structural disorders for Rietveld refinement. The method has been successfully used to model severe stacking faults in clay minerals from a simple b-axis disorder in kaolinite to turbostratic disorder in smectite (Ufer et al., 2008). Other Rietveld programs incorporate structureless phases with reference intensity ratios calculated from pure standards for quantitative phase analysis. Whichever program is used, realistic models of disordered minerals are essential for successful quantitative phase analysis of geologic materials. Although Rietveld-based mineralogic quantifications of soils are reported in the literature (Jackman et al., 1997; Weidler et al., 1998; Jones et al., 2000; Dermatas and Dadachov, 2003; Taubaso et al., 2004; Ji et al., 2006), to our knowledge, there is a lack of more detailed investigations related to the accuracy achievable using this approach when more appropriate F(hkl) values for soil minerals are obtained and used in the refinement procedure. Therefore, in this work we evaluated the accuracy of a Rietveld-based Siroquant technique when appropriate hkl files of observed structure factors are developed and applied to the quantification of minerals in the clay fraction of representative Oxisols from São Paulo State, Brazil.
MATERIALS AND METHODS Soil and Chemical Analyses Subsurface samples (B horizon) of 12 Oxisols presenting different degrees of weathering (Table 1) were collected in São Paulo State, Brazil, air dried, and crushed to pass through a 2-mm sieve. The clay fractions were separated by gravity settling (Jackson, 2005) and their total contents of Al, Si, Fe, Ti, Mn, Mg, Ca, K, Na, and P were determined by x-ray fluorescence (XRF) spectroscopy (Mori et al., 1999) in a Philips PW 2400 spectrometer. The standard NIST 97B was also analyzed under the same conditions to check the accuracy of the XRF results. The Si, Al, and Fe clay contents were used to calculate the weathering indexes Ki (SiO2/Al2O3, mol mol−1) and Kr [SiO2/(Al2O3 + Fe2O3), mol mol−1] (EMBRAPA, 1997). Iron-oxide-concentrated clays were obtained by boiling the soil clays with 5 mol L−1 NaOH (Singh and Gilkes, 1991).
X-Ray Diffraction and Rietveld Analyses Approximately 3 g of clay and 1 g of Fe-oxide-concentrated clay were micronized separately in a McCrone micronizing mill (McCrone Microscopes & Accessories, Westmont, IL) using methanol as a grinding aid, followed by mixing in a Retsch mixer (Retsch, Newtown, PA) with glass balls and sieving through a 0.038-mm (400-mesh) screen to produce random aggregates, which were deposited on a 25-mm-diameter by 2-mmdeep sample holder. Excess material was removed using a knife edge to produce a fairly flat surface. The diffraction patterns were collected on a Bruker D8 Advance (Bruker AXS, Madison, WI) diffractometer (θ–θ with a vertical goniometer) using an incident beam parabolic mirror (Co Kα), a 25-mm sample diameter, and a VÅNTEC-1 linear detector. An incident exit slit of 0.2 mm was used to minimize intensity aberrations above 2° 2θ. The patterns were collected using a step size of 0.02° between 5 and 90° 2θ for the clays and between 16 and 80° 2θ for the Fe oxide concentrates. Aluminum substitution for Fe in Fe oxides (e.g., hematite and goethite) has a significant impact on the structure factor and hence the intensity distribution. Given that the Siroquant code was conceived with the focus on quantitative phase analysis based on the Rietveld method, it does not allow refinement of atom coordinates or composition. This is adequate for most minerals having negligible compositional disorder where the form factors of the atoms involved in the substitution are similar. To improve the accuracy of the structure model used for Al-substituted goethite and Al-substituted hematite, another Rietveld refinement program BGMN SSSAJ: Volume 73: Number 6 • November–December 2009
Table 2. X-ray fluorescence spectroscopy data of the soil clays. Soil
SiO2 Al2O3 Fe2O3 TiO2 MnO CaO ___________________________________________________________ %
MgO
K2O
Na2O
P2O5
LOI†
Total
(w/w) ___________________________________________________________ 0 0 0.08 0.10 0.10 16.9 99.5 0 0.10 0.10 0.10 0.12 16.6 99.4 0 0.04 0.05 0.10 0.10 20.5 99.3 0 0.05 0.03 0.20 0.20 18.6 99.7 0.01 0.04 0.04 0.04 0.20 16.5 99.5 0 0.02 0.10 0.10 0.15 17.1 100.0 0.03 0 0.60 0.60 0.30 18.2 99.3 0 0 0.60 0.60 0.10 22.3 98.8 0 0 0.40 0.40 0.15 18.9 99.6 0 0 0.01 0.01 0.30 21.5 99.2 0 0 0.05 0.05 0.40 22.1 99.8 0 0 0.40 0.40 0.20 29.5 99.2
1 35.2 38.1 7.4 1.6 0.02 2 31.4 36.1 13.4 1.5 0.02 3 29.4 36.2 10.7 2.2 0.02 4 26.4 33.8 16.1 4.3 0.05 5 25.1 32.2 22.0 3.3 0.03 6 25.6 33.4 21.5 2.0 0.04 7 22.4 31.9 22.7 3.1 0.05 8 23.1 41.0 9.2 2.4 0.03 9 18.7 35.9 18.6 6.8 0.08 10 20.9 42.3 12.0 2.1 0.01 11 13.2 35.5 24.0 4.4 0.07 12 1.3 46.8 18.5 2.4 0.03 † Loss-on-ignition. ‡ Weathering index given by 1.7 SiO2/Al2O3. § Weathering index given by 1.7 SiO2/(Al2O3 + 0.64Fe2O3).
(Bergmann and Kleeberg, 1998) was used to obtain the observed structure factors directly from the Fe-oxide-concentrated clays. Goethite was refined in the space group Pnma and hematite in the hexagonal setting of R-3c. First, the d111 (nm) for goethite was determined following a multiphase LeBail fit. This was used to estimate the Fe/Al ratio following the relationship developed by Li et al. (2006), given by: Al ( mol% ) = −7657 d111 + 1874
[1]
The atom and displacement parameters of the three published structure models for goethite with an Al mol% of 7, 10, or 20 (Li et al., 2006) were then used as starting models for Rietveld refinement with the Fe/ Al constrained to the calculated value. The model having an Fe/Al ratio closest to the calculated Fe/Al ratio for each Fe ore concentrate was used for that particular sample. The cell parameters were refined. Attempts to refine the atom positions of the starting model resulted in distortion of the Fe–O–H octahedral and were discontinued. For hematite, the cell parameters were determined from the LeBail refinement and were used to estimate the Fe/Al ratio. The relationship between cell volume (V) (nm3) and Al (mol%) was derived from a straight line through the cell volumes of the end members in the Fe–Al series, hematite and corundum: Al ( mol% ) = −2060V + 622.42
[2]
To develop the relationship, all the hematite and corundum structures in the Inorganic Crystal Structure Database (2007–2) were averaged (the minimum and maximum volumes were discarded). The average cell volume of hematite was determined as 0.3021 nm3 and of corundum as 0.2534 nm3. Preferred orientation was not refined since it was minimized during sample preparation by using micrometer-sized spherical aggregates of the nanometer-sized crystallites. Anisotropic size broadening was also successfully refined for goethite and hematite. The cell parameters and extracted intensities after refinement with BGMN were then used to develop the observed structure files in Siroquant following the procedure presented by Taylor and Rui (1992). Taking into consideration that neither the kaolinite hkl files available in the Siroquant database nor the kaolinite structural models provided in the BGMN database were suitably similar to those of the disordered kaolinites found in the Oxisol clays, a pure kaolinite sample (from Bath, SC) presenting b-axis disorder similar to that of the Oxisol clays SSSAJ: Volume 73: Number 6 • November–December 2009
Ki‡
Kr§
1.57 1.48 1.38 1.33 1.32 1.30 1.19 0.96 0.89 0.84 0.63 0.05
1.40 1.19 1.16 1.02 0.92 0.92 0.84 0.82 0.71 0.67 0.44 0.04
was used for developing an hkl file for this mineral, also following the procedure of Taylor and Rui (1992). In all quantitative analyses performed using Siroquant, the background line of each XRD pattern was fitted to a fifth-order polynomial equation and the diffraction peak shapes were modeled using the Pearson VII function (Snyder, 1993). For the samples in which kaolinite was the major phase, its unit cell dimensions and the full widths at half maximum (FWHMs) of its diffraction peaks were first refined, being the initial FWHM refinement done considering only the W parameter of the Caglioti et al. (1958) equation: FWHM = (Utan2 θ + Vtanθ + W)1/2, in which U, V, and W are refinable parameters and θ is the Bragg angle; afterward, the preferred orientation was corrected using the March equation (Dollase, 1986) and the FWHM refinement was concluded (U and V parameters). This was followed by cell parameter and profile width (W) refinements for gibbsite. When gibbsite was the most abundant phase, the FWHM was refined using the three parameters of the Caglioti et al. (1958) equation and only one (W) for kaolinite. For hematite and goethite, the cell parameters and W were refined. For minor phases—maghemite, anatase, and rutile— only the scale factors were refined. For all cases, the phase scale factors and the instrumental zero were refined throughout the analyses. The accuracy of the Rietveld-determined mineral contents in the clay fraction was evaluated by statistical comparisons (t-test) of the mean XRFdetermined composition of SiO2, Al2O3, Fe2O3, and TiO2 and their respective compositions calculated from the mineral contents given by the XRDRietveld approach converted to oxides using factors derived from the following ideal chemical formulae: SiO2 for quartz, Mg1.8Fe0.9AlSiO10(OH)2·4H2O for vermiculite, Al2Si2O5(OH)4 for kaolinite, Al(OH)3 for gibbsite, Fe(2−2x) Al2xO3 for Al-substituted hematite, Fe(1−x)AlxOOH for Al-substituted goethite (x = [Al/(Al + Fe)], mol mol−1), Fe2O3 for maghemite, and TiO2 for both anatase and rutile.
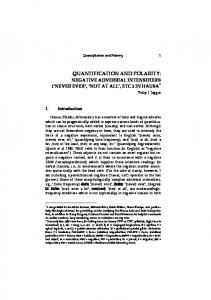
RESULTS AND DISCUSSION Chemical and Mineralogic Compositions of the Soil Clays The clay chemical composition data obtained by XRF is summarized in Table 2. Silicon, Al, Fe, and Ti are the most abundant elements found in the studied clays, with an average oxide-expressed content of 79% (w/w). From the XRD patterns (Fig. 1), the most abundant elements are associated with 2193
Fig. 1. X-ray diffraction patterns of the Oxisol clays.
kaolinite, gibbsite, hematite, goethite, and anatase in all samples and, for some, minor quantities of quartz, vermiculite, maghemite, and rutile are present as Si-, Al-, Fe-, and Ti-bearing minerals. The weathering-induced kaolinite destabilization and the consequent accumulation of gibbsite and Fe oxides were responsible for the variation of the weathering indexes Ki and Kr whose values ranged from 1.57 (Ki) and 1.40 (Kr) for the less weathered Typic Hapludox (Soil 1) to 0.05 (Ki) and 0.04 (Kr) for the deeply weathered Xanthic Acrustox (Soil 12). Although the other analyzed elements were measurable by XRF as given in Table 2, except for the structural Mg of vermiculite, no XRD-detectable amounts of Mn-, Ca-, K-, Na-, and P-bearing minerals were found. The sum of the oxide-expressed contents of all analyzed elements plus the amount of structural water, measured by the loss-on-ignition (LOI), averaged 99.4% (w/w), indicating that other unanalyzed elements comprise a very small fraction of the studied clays.
2194
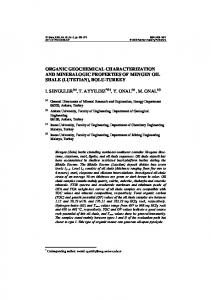
The extraction of individual diffraction profiles of hematite and goethite performed using the Rietveld-based software BGMN from XRD data collected for the Fe-oxideconcentrated clays of all studied soils is exemplified in Fig. 2. These patterns and the refined unit cell dimensions (a, b, and c) given in Table 3 were used to modify the hkl files of Al-substituted hematite and goethite available in the Siroquant database, giving rise to new ones that were used in the Rietveldbased quantitative analyses of the soil clays. Considering the need for concentrating the Fe oxides in the soil clays to obtain XRD patterns that allow accurate assessment of Fe for Al substitution, such patterns can also be used for the development of sample-specific phase hkl files. This approach has the advantage of not requiring the use of pure standards for the development of hkl files to account for the modification of atom coordinates and composition due to Al substitution. Unlike hematite and goethite, for which sample-specific hkl files were used in the Siroquant operations, one kaolinite hkl file developed from an XRD pattern obtained for one pure kaolinite sample (Fig. 3) was added to the Siroquant database and used in the Rietveld-based quantitative phase analyses performed on all the clay samples. The fittings performed using Siroquant provide, in general, good agreement between the measured and calculated XRD patterns, as in the case observed for the clay fraction of Soil 5 (Fig. 4). The clay mineral contents determined using the XRD–Rietveld approach are presented in Table 4. Considering that the soils were ordered in a largely increasing weathering sequence, it can be observed that the kaolinite content tends to decrease whereas the gibbsite content tends to increase from Soils 1 to 12. No clear tendency of increase or decrease in the Fe oxide concentrations was observed with the weathering advance. Furthermore, the statistical analyses based on the independentsamples t-test (SAS Institute, 1989) failed to reveal significant differences between the means of the XRF-determined and XRDderived clay contents of SiO2 (t = −0.22, P > |t| = 0.8265), Al2O3 (t = −1.32, P > |t| = 0.2005), Fe2O3 (t = −0.70, P > |t| = 0.4894), and TiO2 (t = 0.18, P > |t| = 0.8572). As a consequence, the mean values of both Ki and Kr weathering indexes calculated from the XRF and XRD data also did not differ (Ki: t = 0.16, P > |t| = 0.8716; Kr: t = 0.11, P > |t| = 0.9138) (Table 5). Although good similarities were observed for both means and standard deviations of XRF-determined and XRD-derived clay contents of SiO2, Al2O3, Fe2O3, and TiO2, for some samples Al2O3 was somewhat overestimated by XRD. We believe that such differences were due in part to the use of ideal chemical formulae for calculating the oxide contents from the mineral contents. For instance, when the structural Al for Fe substitution SSSAJ: Volume 73: Number 6 • November–December 2009
Fig. 3. X-ray diffraction pattern of the kaolinite sample used for hkl file development.
Fig. 2. X-ray diffraction patterns of the Fe-oxide-concentrated clay of the Xanthic Acrustox (Soil 9) showing the results of Rietveld refinement (Rwp = weighted profile figure of merit [R factor] and Rexp = expected R factor for the Rietveld fittings; Young, 1993).
of significant contents of amorphous materials like those studied by Ward and French (2006). Considering the mean structural water content of kaolinite (14%), goethite (10%), and gibbsite (35%), the calculation of structural water content that could be lost due to heating to 1000°C (H2O % = 0.14 kaolinite + 0.10 goethite + 0.35 gibbsite) averaged 17% (w/w) whereas the XRF-measured LOI showed a mean value of 19.9% (w/w); these similar values and the correlation observed between the XRD-derived and the XRF-measured LOI values (r = 0.96, P > |t| < 0.0001) reinforce the conclusion that the procedure used in this research was able to provide accurate clay component contents. Despite the minor differences observed between some XRFdetermined and XRD-derived data, the development of appropriate hkl files enables application of the Rietveld method in the simultaneous quantification of minerals in mixtures having not only a large numbers of phases but also extensive structural disorder, which makes standard Rietveld refinement impractical. Without modifying the model structures to account for disorder, XRD Rietveld analysis would not produce results sufficiently accurate
in kaolinite (Mestdagh et al., 1980) is not considered, there is the tendency for a small overestimation of the Al derived from this mineral and the XRF-determined Fe2O3 contents tend to be greater than the XRD-calculated ones; similarly, when the Al for Fe substitutions in goethite and hematite are overestimated, XRD-calculated contents of Al2O3 and Fe2O3 are over- and underestimated, respectively. Another possibility could be the presence of minor quantities of an Al-rich amorphous phase. If, however, significant quantities of an amorphous phase were indeed present in the samples and not accounted for in the Rietveld-based quanti- Table 3. Unit cell dimensions (a, b, and c) and Fe for Al substitutions [Al/(Fe+Al)] tative phase analyses, all the other oxide assessed for the soil clay hematites and goethites. Hematite Goethite components calculated from the XRD Soil Al/(Fe+Al)† Al/(Fe+Al)‡ a b c a b c data would be overestimated. In contrast _______________ nm _______________ _______________ nm _______________ to other soils such as the tephra-derived mol % mol % 0.50131 0.50131 1.37150 7.5 0.98380 0.29806 0.45582 22.5 ones, the Oxisols present very small 1 0.50109 0.50109 1.37260 7.5 0.98431 0.29889 0.45751 17.7 amounts of amorphous phases as shown 2 0.50109 0.50109 1.37730 5.4 0.97885 0.29721 0.45546 26.9 by their usually low contents of oxalate- 3 0.50146 0.50146 1.37219 6.8 0.98510 0.29975 0.45683 14.3 extractable Fe and Al (Fontes and Weed, 4 0.50205 0.50205 1.37450 4.3 0.97704 0.29645 0.45486 30.9 1996; Trakoonyingcharoen et al., 2006). 5 0.49845 0.49845 1.36448 17.6 0.97179 0.29588 0.45330 35.6 This makes spiking for XRD amorphous 6 0.50249 0.50249 1.37606 2.5 0.97697 0.29630 0.45536 31.0 components ( Jones et al., 2000; Ufer et 7 0.50265 0.50265 1.37634 2.0 0.97624 0.29608 0.45537 32.0 al., 2008) unnecessary. Spiking could also 8 0.50182 0.50182 1.38303 1.0 0.98448 0.29894 0.45814 16.2 lead to overdilution of the sample and, by 9 0.50146 0.50146 1.37940 3.5 0.98410 0.29815 0.45624 21.6 consequence, missing the detection of the 10 0.50158 0.50158 1.37330 6.0 0.98257 0.29836 0.45730 19.7 XRD peaks of well-ordered minor phases. 11 0.50139 0.50139 1.37196 7.1 0.98421 0.29924 0.45685 16.4 Furthermore, none of the XRD patterns 12 of the soil clays (Fig. 1) showed the hump † Al/(Fe+Al) (mol%) = −2060V + 622.42, where V = unit cell volume (nm3). that, in some cases, is due to the presence ‡ Al/(Fe+Al) (mol%) = −7657d111 + 1874, where d111 = 111 spacing (nm) (Li et al., 2006). SSSAJ: Volume 73: Number 6 • November–December 2009
2195
for practical purposes such as those related to the improvement of soil management practices like liming and fertilization.
CONCLUSIONS The use of suitable hkl files for modified structural factors [F(hkl)] of pedogenic minerals like kaolinite, hematite, and goethite enables the Rietveld-based software Siroquant to accomplish simultaneous and reliable quantifications of Oxisol clay components. For minerals such as Al-hematite and Algoethite, there is no need for pure samples for hkl file development. Instead, hkl development can be performed by means of Rietveld-based analysis performed on XRD data collected for Fe-oxide-concentrated clays, which allows both the extraction of the individual patterns of hematite and goethite and the determination of their crystallographic and structural parameters.
ACKNOWLEDGMENTS We are grateful to Dr. John Stirling of the Geological Survey of Canada for providing the kaolinite sample used in hkl file development; Dr. David H. French of CSIRO Energy Technology, Australia, for the directions related to the development of Siroquant hkl files; and Dr. Reinhard Kleeberg, TU Bergakademie Freiberg, for help with BGMN real-structure models.
REFERENCES
Fig. 4. X-ray diffraction patterns (a) measured, (c) calculated, and (b) their difference obtained using the Rietveld-based software Siroquant for the Rhodic Acrudox (Soil 6) clay fraction.
Alves, M.E., and A. Lavorenti. 2004. Sulfate adsorption and its relationships with properties of representative soils of the Sao Paulo State, Brazil. Geoderma 118:89–99. Alves, M.E., and A. Lavorenti. 2005. Point of zero salt effect: Relationships with clay mineralogy of representative soils of the Sao Paulo State, Brazil. Pedosphere 15:545–553. Bergmann, J., and R. Kleeberg. 1998. Rietveld analysis of disordered layer silicates. Mater. Sci. Forum 278–281:300–305. Bigham, J.M., D.C. Golden, S.W. Buol, S.B. Weed, and L.H. Bowen. 1978. Iron oxide mineralogy of well-drained Ultisols and Oxisols: II. Influence on color, surface area, and phosphate retention. Soil Sci. Soc. Am. J. 42:825–830. Caglioti, G., A. Paoletti, and F.P. Ricci. 1958. Choice of collimators for a crystal spectrometer for neutron diffraction. Nucl. Instrum. Methods 35:223–228. Carthew, A.R. 1955. The quantitative estimation of kaolinite by differential thermal analysis. Am. Mineral. 52:293–298. Dermatas, D., and M.S. Dadachov. 2003. Rietveld quantification of montmorillonites in lead-contaminated soils. Appl. Clay Sci. 23:245–255. Dollase, W.A. 1986. Correction of intensities for preferred orientation in powder diffractometry: Application of the March model. J. Appl. Cryst. 19:267–272. EMBRAPA. 1997. Manual of methods of soil analysis. Ministry of Agriculture, Rio de Janeiro, Brazil. Ferreira, M.M., B. Fernandes, and N. Curi. 1999. Influence of clay mineralogy
Table 4. Clay component contents determined using the Rietveld method. Soil
Vermiculite Kaolinite
Quartz
Gibbsite
Hematite
Goethite Maghemite
Anatase
Rutile
Total
R factor†
___________________________________________________________________ %
(w/w) ___________________________________________________________________ 1 0.0 75.4 0.9 13.5 0.6 8.4 0.0 0.6 0.5 100.0 0.200 2 0.5 68.1 0.3 12.5 4.4 12.9 0.0 1.1 0.7 100.5 0.242 3 0.2 64.0 0.6 18.2 7.9 7.2 0.0 1.5 0.6 100.2 0.222 4 0.0 57.4 0.2 20.3 6.9 10.7 0.0 3.3 1.2 100.0 0.201 5 0.0 58.9 0.2 15.8 22.0 0.9 0.0 1.2 1.1 100.0 0.274 6 0.1 51.9 1.1 15.9 9.8 19.2 0.0 1.6 0.4 100.1 0.221 7 0.0 53.3 0.2 20.4 20.4 0.5 2.0 1.7 1.4 100.0 0.223 8 0.0 47.1 0.0 38.2 0.0 12.5 0.0 1.6 0.6 100.0 0.221 9 0.0 44.0 0.0 25.3 4.8 19.0 0.0 5.7 1.3 100.0 0.244 10 0.0 41.9 0.7 36.6 0.0 18.8 0.0 2.0 0.0 100.0 0.206 11 0.0 27.7 0.2 40.2 11.5 15.8 0.5 3.6 0.5 100.0 0.210 12 0.0 7.3 0.0 68.9 0.3 20.8 0.0 2.0 0.6 100.0 0.231 † Siroquant fitting figure of merit given by the ratio of the sum of the difference between the intensities of the background-removed measured and calculated x-ray diffraction (XRD) patterns plus the sum of the intensities of background-removed measured (XRD) pattern. 2196
SSSAJ: Volume 73: Number 6 • November–December 2009
Table 5. Total clay contents of Si, Al, Fe, and Ti determined by x-ray fluorescence (XRF) spectroscopy and calculated from mineral clay contents determined by applying the Rietveld method to x-ray diffraction (XRD) data. Soil
SiO2 XRF
Al2O3 XRD
XRF
XRD
Fe2O3 XRF
XRD
TiO2 XRF
Ki† XRD
(w/w) ________________________________________________ 1 35.2 36.0 38.1 39.8 7.4 6.9 1.6 1.1 2 31.4 32.0 36.1 36.9 13.4 14.4 1.5 1.8 3 29.4 30.4 36.2 38.8 10.7 12.8 2.2 2.1 4 26.4 26.9 33.8 37.2 16.1 15.2 4.3 4.5 5 25.1 27.6 32.2 34.4 22.0 22.0 3.3 2.2 6 25.6 25.3 33.4 36.6 21.5 21.2 2.0 2.0 7 22.4 25.0 31.9 34.8 22.7 22.4 3.1 3.1 8 23.1 21.9 41.0 46.1 9.2 8.5 2.4 2.2 9 18.7 20.5 35.9 35.8 18.6 19.8 6.8 7.0 10 20.9 20.2 42.3 43.0 12.0 14.3 2.1 2.0 11 13.2 13.1 35.5 39.6 24.0 23.8 4.4 4.1 12 1.3 3.4 46.8 50.0 18.5 16.9 2.4 2.6 Mean 22.7 a§ 23.5 a 36.9 b 39.4 b 16.3 c 16.5 c 3.0 d 2.9 d SD 8.9 8.8 4.5 4.8 5.7 5.5 1.5 1.6 † Weathering index given by 1.7 SiO2/Al2O3. ‡ Weathering index given by 1.7 SiO2/(Al2O3 + 0.64Fe2O3). § Means followed by the same letter do not differ according to the independent-samples t-test.
Kr‡
XRF
XRD
XRF
XRD
1.57 1.48 1.38 1.33 1.33 1.30 1.19 0.96 0.89 0.84 0.63 0.05 1.08 e 0.4
1.54 1.48 1.33 1.23 1.37 1.18 1.22 0.81 0.97 0.80 0.56 0.12 1.05 e 0.4
1.40 1.20 1.16 1.02 0.93 0.93 0.82 0.84 0.67 0.71 0.44 0.04 0.85 f 0.4
1.39 1.19 1.10 0.98 0.97 0.86 0.87 0.72 0.72 0.66 0.41 0.10 0.83 f 0.3
________________________________________________ %
on physical properties of Oxisols of southeast region of Brazil. Rev. Bras. Cienc. Solo 23:515–523. Fontes, M.P.F., and S.B. Weed. 1991. Iron oxides in selected Brazilian Oxisols: I. Mineralogy. Soil Sci. Soc. Am. J. 55:1143–1149. Fontes, M.P.F., and S.B. Weed. 1996. Phosphate adsorption by clays from Brazilian Oxisols: Relationships with specific surface area and mineralogy. Geoderma 72:37–51. Ghidin, A.A., V.D. Mejo, V.C. Lima, and J. Lima. 2006. Oxisol toposequences developed from basaltic rocks in Paraná State, Brazil: II. Relationship between clay fraction mineralogy and physical soil properties. Rev. Bras. Cienc. Solo 30:307–319. Guzman, G., E. Alcantara, V. Barron, and J. Torrent. 1994. Phytoavailability of phosphate adsorbed on ferrihydrite, hematite, and goethite. Plant Soil 159:219–225. Hill, R.J., and C.J. Howard. 1987. Quantitative phase analysis from neutron diffraction data using the Rietveld method. J. Appl. Cryst. 20:467–474. Jackman, J.M., R.C. Jones, R.S. Yost, and C.J. Babcock. 1997. Rietveld estimates of mineral percentages to predict phosphate sorption by selected Hawaiian soils. Soil Sci. Soc. Am. J. 61:618–625. Jackson, M.L. 2005. Soil chemical analysis: Advanced course. 2nd ed., rev. Parallel Press, Madison, WI. Ji, J., L. Zhao, W. Balsam, J. Chen, T. Wu, and L.W. Liu. 2006. Detecting chlorite in the Chinese loess sequence by diffuse reflectance spectroscopy. Clays Clay Miner. 54:266–273. Jones, R.C., C.J. Babcock, and W.B. Knowlton. 2000. Estimation of the total amorphous content of Hawai’i soils by the Rietveld method. Soil Sci. Soc. Am. J. 64:1100–1108. Karim, M.I., and W.A. Adams. 1984. Relationships between sesquioxides, kaolinite, and phosphate sorption in a catena of Oxisols in Malawi. Soil Sci. Soc. Am. J. 48:406–409. Ladeira, A.C.Q., and V.S.T. Ciminelli. 2004. Adsorption and desorption of arsenic on an Oxisol and its constituents. Water Res. 38:2087–2094. Li, D.Y., B.H. O’Connor, I.M. Low, A. van Riessen, and B.H. Toby. 2006. Mineralogy of Al-substituted goethites. Powder Diffr. 21:289–299. Mestdagh, M.M., L. Vielgvoye, and A.J. Herbillon. 1980. Iron in kaolinite: II. The relationship between kaolinite crystallinity and iron content. Clay Miner. 15:1–13. Mori, P.E., S. Reeves, C.T. Correia, and M. Haukka. 1999. Development of a fused disc XRD facility and comparison with the pressed powder pellet technique at Geoscience Institute, São Paulo University. Rev. Bras. Geosci. 29:441–446. Pinheiro-Dick, D., and U. Schwertmann. 1996. Microaggregates from Oxisols and Inceptisols: Dispersion through selective dissolutions and physicochemical treatments. Geoderma 74:49–63. Rietveld, H.M. 1969. A profile refinement method for nuclear and magnetic structures. J. Appl. Crystallogr. 2:65–71.
SSSAJ: Volume 73: Number 6 • November–December 2009
SAS Institute. 1989. SAS/STAT user’s guide. 4th ed. SAS Inst., Cary, NC. Schaefer, C.E.R. 2001. Brazilian latosols and their B horizon microstructure as long-term biotic constructs. Aust. J. Soil Res. 39:909–926. Schaefer, C.E.G.R., J.D. Fabris, and J.C. Ker. 2008. Minerals in the clay fraction of Brazilian Latosols (Oxisols): A review. Clay Miner. 43:137–154. Singh, B., and R.J. Gilkes. 1991. Concentration of iron oxides from soil clays by 5 M NaOH treatment: The complete removal of sodalite and kaolin. Clay Miner. 26:463–472. Snyder, R.L. 1993. Analytical profile fitting of x-ray powder diffraction profiles in Rietveld analysis. p. 111–131. In R.A. Young (ed.) The Rietveld method. Oxford Univ. Press, Oxford, UK. Taubaso, C., M.D. Afonso, and R.M.T. Sanchez. 2004. Modelling soil surface charge density using mineral composition. Geoderma 121:123–133. Taylor, J.C. 1991. Computer programs for standardless quantitative XRD analysis of minerals using the full powder diffraction profile. Powder Diffr. 6:2–9. Taylor, J.C., and I. Hinczak. 2003. Rietveld made easy: A practical guide to understanding the method and successful phase quantifications. Sietronics, Belconnen, ACT, Australia. Taylor, J.C., and C.E. Matulis. 1991. Absorption contrast effects in the quantitative XRD analysis of powders by full multiphase profile refinement. J. Appl. Crystallogr. 24:14–17. Taylor, J.C., and Z. Rui. 1992. Simultaneous use of observed and calculated standard profiles in quantitative analysis by multiphase Rietveld method: The determination of pseudorutile in mineral sands products. Powder Diffr. 7:152–161. Trakoonyingcharoen, P., I. Kheoruenromne, A. Suddhiprakarn, and R.J. Gilkes. 2006. Properties of iron oxides in red Oxisols and red Ultisols as affected by rainfall and soil parent material. Aust. J. Soil Res. 44:63–70. Ufer, K., H. Stanjek, G. Roth, R. Dohrmann, R. Kleeberg, and S. Kaufhold. 2008. Quantitative phase analysis of bentonites by the Rietveld method. Clays Clay Miner. 56:272–282. Ward, C.R., and D. French. 2006. Determination of glass content and estimation of glass composition in fly ash using quantitative x-ray diffractometry. Fuel 85:2268–2277. Weidler, P.G., J. Luster, J. Schneider, H. Sticher, and A.U. Gehring. 1998. The Rietveld method applied to the quantitative mineralogical and chemical analysis of a ferralitic soil. Eur. J. Soil Sci. 49:95–105. Young, R.A. 1993. Introduction to the Rietveld method. p. 1–38. In R.A. Young (ed.) The Rietveld method. Oxford Univ. Press, Oxford, UK. Young, R.A., P.E. Mackie, and R.B. von Dreele. 1977. Application of the patternfitting structure-refinement method to x-ray powder diffractometer patterns. J. Appl. Crystallogr. 10:262–269.
2197