Improving Semantic Consistency of Web Sites by Quantifying User Intent Carsten Stolz1 , Maximilian Viermetz2 , Michal Skubacz3 ,Ralph Neuneier4 1
University of Eichst¨ att-Ingolstadt, Germany,
[email protected] Heinrich-Heine-Universit¨ at D¨ usseldorf, Germany,
[email protected] 3 Siemens AG, Corporate Technology, Germany,
[email protected] 4 Siemens Corporate Research Princeton, USA,
[email protected] 2
Abstract. The design and organization of a website reflects the authors intent. Since user perception and understanding of websites may differ from the authors, we propose a means to identify and quantify this difference in perception. In our approach we extract perceived semantic focus by analyzing user behavior in conjunction with keyword similarity. By combining usage and content data we identify user groups with regard to the subject of the pages they visited. Our real world data shows that these user groups are nicely distinguishable by their content focus. By introducing a distance measure of keyword coincidence between web pages and user groups, we can identify pages of similar perceived interest. A discrepancy between perceived distance and link distance in the web graph indicates an inconsistency in the web site’s design. Determining usage similarity allows the web site author to optimize the content to the users needs.
1
Introduction
Web Mining provides many approaches to analyze usage, user navigation behavior, as well as content and structure of web sites. They are used for a variety of purposes ranging from reporting through personalization and marketing intelligence. In most cases the results obtained, such as user groups or clickstreams, are difficult to interpret. Moreover practical application of them is even more difficult. We would like to present a way to analyze web data giving clear recommendations for web site authors on how to improve the web site by adapting it to user’s interest. For this purpose we have to first identify and evaluate the interest. Since we analyze corporate web sites that mainly provide information, but no e-commerce, there is no transactional data available. Transactions usually provide insight into the user’s interest: what the user is buying, that is what he or she is interested in. But facing purely information driven web sites, other approaches must be developed in order to reveal user interest. Our goal is to automatically generate recommendations for information driven web sites enabling authors to incorporate user’s perception of the site in the process of optimizing it.
We achieve the goal by combining and analyzing web site structure, content as well as usage data. For the purpose we collect the content and structure data using an automatic crawler. The usage data we gather with the help of a web tracking system integrated into a large corporate web site. The content and structure data are collected by a crawler. Contribution: Combining usage and content data and applying clustering techniques, we create user interest vectors. We analyze the relationships between web pages based on the common user interest, defined by the previously created user interest vectors. Finally we compare the structure of the web site with the user perceived semantic structure. The comparison of both structure analyses helps us to generate recommendations for web site enhancements. Related Work: A similar approach is described by Zhu et al in [15]. The Authors analyze user paths to find semantic relations between web pages with the aim to improve search by constructing a conceptual link hierarchy. Mobasher et al. [8] combine user and content data in a similar way in order to create content profiles. These profiles are used in a framework for web site personalization. Mobasher and Dai analyze user behavior in context of the Semantic Web in [5], using the advantages of ontologies and taxonomies. User Interest is also the focus of Oberle et al. in [9]. They enhance web usage data with formal semantics from existing ontologies. The main goal of this work is to resolve cryptic URLs by semantic information provided by a Semantic Web. In our approach we do not use explicit semantic information, because Semantic Web extensions are not available for the web sites we analyze. How semantic information from a Semantic Web can be provided and applied is covered by Berendt et al in [1]. Like Cooley describes in [4], we also combine Web Content, Structure and Usage. Cooley uses their combination for a better data preprocessing and product page classification. We have instead chosen to use standard multivariate analysis for identification of user and content cluster. In [12] we have outlined a technique for smoothing the keyword space in order to reduce dimensionality and improve clustering results. A comparison of perceived user’s interest and author’s intentions manifested in the web site content and structure can be regarded as a web metric. A systematic survey of web related metrics can be found at Dhyani et al. [6] and Calero et al.[3]. Usability and information accessibility aspects of our approach can be regarded in the context of Vanderdonckt et al.[14] presenting a guideline-based automatic HTML check on usability of web sites. Overview: Our approach is described in sections 2 through 4. In the sections 2.1 and 2.2 we describe different datasets, their preprocessing and the combination of user and content data. The identification process of user interest groups is described in 3.1 and 3.2. By comparing Web Site Structure with the user perceived semantic structure of a web site, we identify discrepancies of the web site in section 4. The application and evaluation of our approach is presented in section 5 by analyzing real world data of a corporate web site.
2
Data Preparation
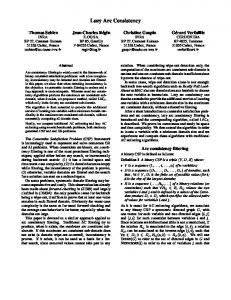
For our approach we analyze usage as well as content data. We consider usage data to be user actions on a web site which are collected by a tracking mechanism. We extract content data from web pages with the help of a crawler. Figure 1 depicts the major steps of our algorithm. The data preparation steps 1 and 2 are described in 2.1. Section 2.2 describes step 3, where usage and content data are combined. Further the combined data is used for the identification of the user interest groups in 3.1. To identify topics we calculate the key word vector sums of each cluster in 3.2. Step 5, in which probabilities of a web page belonging to one topic is calculated, is explained in 3.2. Afterwards in 4.1 the distances between the web page are calculated, in order to compare them in the last step 4.2 with the distances in the link graph. As a result we can identify inconsistencies between web pages organized by the web designer and web pages grouped by users with the same interest.
Content Data
User Data
2 Clean
Adjacency Matrix
1 Clean
Cont−KW Matrix
User Matrix
3 Multiply
User−KW Matrix 4
Cluster and calculate KW−Vectorsums per Cluster
User Interest Vectors (Topic) 5
Probability Content ID given Topic
Topic Map 6
Distance
Distance Map 7
Distance
Inconsistency Check Fig. 1. Our Approach
2.1
User Data Extraction and Cleaning
A tracking mechanism on the analyzed web sites collects each click, session information as well as additional user details. In an ETL (Extraction-TransformLoad) process user sessions are created. The problem of session identification occurring with logfiles is overcome by the tracking mechanism, which allows easy construction of sessions. The resulting session information was afterwards manually cleaned by the following steps: Exclude Crawler: We identify foreign potential crawler activity thus ignoring bots and crawlers searching the web site since we are solely interested in user interaction. Exclude Navigational Pages: Furthermore we identify special navigation and support pages which do not contribute to the semantics of a user session. Home, Sitemap, Search are unique pages occurring often in a clickstream, giving hints about navigational behavior but providing no information about the content focus of a user session. Using i sessions and j web pages (identified by Content IDs) we can now create the user session matrix Ui,j . Content Data Extraction and Cleaning The visited pages of a web site are crawled and their content extracted. Exclude Single Occurring Keywords: Keywords that occur only on one web page can not contribute to web page similarity and can therefore be excluded. This helps to reduce dimensionality. Stopwords and Stemming: To further reduce noise in the data set additional processing is necessary, in particular applying a stopword list which removes given names, months, fill words and other non-essential text elements. Afterwards we reduce words to their stems with Porter’s stemming [10] method. Ignore Navigation Bars: Due to the fact that the web pages are supplied by a special content management system (CMS), the crawler can send a modified request to the CMS to deliver the web page without navigation. This allows us to concentrate on the content of a web page and not on the structural and navigational elements. With help of the CMS we achieve a focused content selection which others approaches like [11] concentrate on in detail. From these distilled pages we collect textual information, HTML markup and meta information. HTML-Tags, Metainformation: In [12] we have evaluated meta-information and found that they are not consistently maintained throughout web sites. Also, HTML markup cannot be relied upon to reflect the semantic structure of web pages. In general HTML tends to carry design information, but does not emphasize importance of information within a page.
Number of Keywords per Web Page: From the web page text we have extracted all words. In order to increase effectivity, one usually only considers the most common occurring key words. In general the resulting key word vector for each web page is proportional to text length. In our experiments in section 5 we decided to use all words of a web page since by limiting their number one loses infrequent but important words. Since we analyze single corporate web sites, which concentrate on one area of interest, it is reasonable to have a detailed content description to distinguish between only slightly different topics. Navigational Pages: In order to have compatible data sets, we exclude navigation pages, which we also eliminated from the above explained user data Ui,j . From this cleaned database with j web pages (Content IDs) and k unique keywords we create the content matrix Cj,k . 2.2
Combine User and Content Information
One objective of this approach is to identify what users are interested in. In order to achieve this, it is not sufficient to know which pages a user has visited, but the content of all pages in a user session. Therefore we combine user data Ui,j with content data Cj,k , by multiplying both matrices obtaining a user-keywordmatrix CFi,k = Ui,j × Cj,k . This matrix shows the content of a user session, represented by keywords.
3 3.1
Reveal User Interest Identify User Interest Groups
In order to find user session groups with similar interest, we cluster sessions by keywords. Number of Clusters: In order to estimate the n number of groups, we perform a principal component analysis on the scaled matrix CFi,j and inspect the data visually. Select Start Partition for Clustering: In order to create reliable cluster partitions with k-Means, we have to define an initial partitioning of the data. We do so by clustering CFi,k hierarchically. We have evaluated the results of hierarchical clustering using Single-, Complete- and Average-Linkage methods. For all data sets the Complete-Linkage method has shown the best experimental results. We extract n groups defined by the hierarchical clustering and calculate the within group distance dist(partitionn ). The data point with the minimum distance within partitionn is chosen as one of n starting points of the initial partitioning for the k-Means algorithm.
Identifying User Interest Groups by k-Means Clustering: The previously determined partitioning initializes a standard k-Means clustering assigning each user session to a cluster. We identify user groups with regard to the subject of the pages they visited, clustering users with the same interest. To find out in which topics the users in each group are interested in, we regard the keyword vectors in each cluster. 3.2
Identifying Interest of User Groups
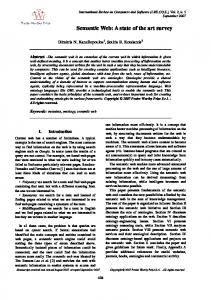
We create an interest vector for each user group by summing up the keyword vectors of all user sessions within one cluster. The result is a user interest matrix U Ik,n for all n clusters. Afterwards we subtract the mean value over all cluster of each keyword from the keyword value in each cluster. Figure 2 shows two topic vectors. The keywords are spaced along the horizontal axis, while the vertical axis represents the relative importance (or unimportance) of individual keywords to this user interest vector. One sees, that the user perceived topics are nicely separable. user_kw_cluster12.fig
−5
matwork_norm[, i]
5 −10
−10
−5
0
matwork_norm[, i]
10
0
15
5
user_kw_cluster5.fig
0
200
400
600
800
1000
1200
0
200
400
Index User Interest Vector
600
800
1000
1200
Index User Interest Vector
Fig. 2. User Interest Vectors
4 4.1
Comparison between User Perceived Semantic Distance and Web Site Link Distance Measure Distance of Keyword Coincidence
Having the keyword based topic vectors for each user group U Ik,n available, we combine them with the content matrix Cj,k × U Ik,n from 2.1. The resulting matrix CIj,n explains how strong each content ID (web page) is related to each User Interest Group U Ik,n . The degree of similarity between content perceived by the user can now be seen as the distances between content IDs based on the CIj,n matrix. The shorter the distance, the greater the similarity of content IDs in the eyes of the users.
4.2
Identify Inconsistencies
Adjacency Matrix: We compare the above calculated distance matrix CI dist with the distances in an adjacency matrix of the web graph of the regarded web site. For this adjacency matrix we use the shortest click distance between two web pages. This distance matrix is calculated by the Dijkstra Algorithm, which calculates shortest paths in a graph. Discrepancies: Comparing both distance matrices, discrepancy between perceived distance and link distance in the web graph indicates an inconsistency in the web sites design. If two pages have the similar distance regarding user perception as well as link distance, then users and web authors have the same understanding of the content of the two pages and their relation to each other. If the distances are different, then either users do not use the pages in the same context or they need more clicks than their content focus would permit. In the eyes of the user, the two pages belong together but are not linked, or the other way around.
5
Case Study
We applied the above presented approach to two corporate web sites. Each deals with different topics and is different concerning size, subject and number of user accesses. With this case study we evaluate our approach employing it on both web sites. We begin with the data preparation of content and usage data and the reduction of dimensionality during this process. See figure 1 for details of the whole process. 5.1
Data Collection and Preparation
In all projects dealing with real world data the inspection and preparation of data is essential for reasonable results. User Data: Raw usage data consists of 13302 user accesses in 5439 sessions. Table 1. Data Cleaning Steps for User Data Cleaning Step Data Sets Dimensions (SessionID x Keyword) Raw Data 13398 5349 x 283 Exclude Crawler 13228 5343 x 280 Adapt to Content Data 13012 5291 x 267
Content Data: 278 web pages are crawled first. Table 2 explains the cleaning steps and the thereby following dimensionality reductions. We have evaluated the possibility to reduce the keyword vector space even more by excluding keywords occurring only on two or three pages.
Table 2. Data Cleaning Steps for Content Data Cleaning Step Data Sets Dimensions (ContentID x Keyword) Raw Data 2001 278 x 501 ContentIDs wrong language 1940 270 x 471 Exclude Home, Sitemap, Search 1904 264 x 468 Exclude Crawler 1879 261 x 466 Delete Single Keywords 1650 261 x 237 Delete Company Name 1435 261 x 236
5.2
Identification of User Interest Groups
In step 3 in figure 1 we combine user and content data by multiplying both matrices obtaining a user-keyword-matrix CFi,k = Ui,j ∗ Cj,k with i = 4568 user sessions, j = 247 content IDs and k = 1258 keywords. We perform a principal component analysis on the matrix CFi,k to determine the n number of clusters. This number varies from 9 to 30 cluster depending on the size of the matrix and the subjects the web site is dealing with. The Kaiser criteria can help to determine the number of principal components necessary to explain half of the total sample variance, like in figure 3. We choose different number of clusters varying around this criteria and could not see major changes in the resulting cluster numbers. Standard k-Means clustering provided the grouping
0.3 0.2
1 2 3 4 5 6 7 8 9 10
12
14
16
18
20
Height
0.0
20
0.1
30
Variances
40
0.4
50
0.5
Complete Linkage
Fig. 3. Principal Component Analysis and Hierarchichal Clustering
of CFi,k into n cluster. We calculate the keyword vector sums per each cluster, building the total keyword vector for each cluster. The result is a user group interest matrix U I k,n Part of an user interest vector is given here: treasur — solu — finan — servi — detai. We proceed as described above in 4.1 with the calculating the user perceived interest. The crawler has gathered all links, which we use for building the adjacency matrix.
We now want to provide a deeper insight into the application of the results. We have calculated the distance matrix dist(CIj,n ) as described in 4.1. 5.3
Identify Inconsistencies
We scale both distance matrices, the user dist(CIj,n ) and adjacency matrix DistLink to variance 1 and mean 0 in order to make them comparable. Then we calculate their difference DistU serInterest − DistLink . We get a matrix with as many columns and rows as there are web pages, comparing all web page (content IDs) with each other. We are interested in the differences between user perception and author intention, which are identifyable as peak values when subtracting the user matrix from the adjacency matrix, clearly visible in Fig. 4. The set of peaks, identifying pairs of web pages, now forms the candidates put forward for manual scrutiny by the web site author, who can update the web site structure if he or she deems it necessary.
Fig. 4. Sample Consistency Check
6
Conclusion
We have presented a way to show weaknesses in the current structure of a web site in terms of how user perceive the content of that site. We have evaluated our approach on two different web sites, different in subject, size and organization. The recommendation provided by this approach has still to be evaluated manually, but since we face huge web sites, it helps to focus on problems the users have. Solving them promises a positive effect on web site acceptance. The ultimate goal will be measurable by a continued positive response over time.
This work is part of the idea to make information driven web pages evaluable. Our current research will extend this approach with the goal to create metrics, that should give clues about the degree of success of a user session. A metric of this kind would make the success of the whole web site more tangible. For evaluation of a successful user session we will use the referrer information of users coming from search engines. The referrer provides us with these search strings. Compared with the user interest vector a session can be made more evaluable.
References 1. B. Berendt, A. Hotho, G. Stumme; Towards Semantic Web Mining, The Semantic Web - ISWC 2002, 2002, p. 264 2. S. Chakrabarti; Mining the Web - Discovering Knowledge from Hypertext Data. Morgan Kaufmann, 2002 3. C. Calero, J. Ruiz, M. Piattini; A Web Metrics Survey Using WQM Web Engineering, 4th Int. Conf. ICWE 2004, Proc. p.147-160 4. R. Cooley; The Use of Web Structure and Content to Identify Subjectively Interesting Web Usage Patterns ACM Transaction on Internet Technology, 2003, Vol.3 Nr.2 p. 93–116 5. H. Dai, B. Mobasher; Using ontologies to discover domain-level web usage profiles,PKDD 2001 6. D. Dhyani, NG. Keong, S.S. Bhowmick; A Survey of Web Metrics, ACM Computing Surveys, 2002, vol. 34, nr. 4, p. 469-503 7. X. He, H. Zha, C. Ding, and H. Simon; Web document clustering using hyperlink structures Computational Statistics and Data Analysis, 41:19-45, 2002 8. B. Mobasher, H. Dai, T. Luo, Y. Sun, and J. Zhu; Integrating Web Usage and Content Mining for More Effective Personalization. Proc. of the Int’l Conf. on ECommerce and Web Technologies (ECWeb2000)(2000) 9. D. Oberle, B. Berendt, A. Hotho, J. Gonzalez; Conceptual User Tracking, Proc. of the Atlantic Web Intelligence Conference,2002, p. 155 - 164 10. M. F. Porter; An algorithm for suffix stripping. Program, 14:130–137, (1980) 11. R. Song and H. Liu and J. Wen and W. Ma; Learning important models for web page blocks based on layout and content analysis SIGKDD Explor. Newsl. vol.6, nr. 2, 2004, p.14–23 12. C. Stolz, V. Gedov, K. Yu, R. Neuneier, M. Skubacz; Measuring Semantic Relations of Web Sites by Clustering of Local Context, ICWE2004, M¨ unchen (2004) In Proc. Int. Conf. on Web Engineering 2004, Springer, p. 182–186 13. A.Sun and E.-P. Lim; Web Unit Mining: Finding and Classifying Subgraphs of Web Pages. In Proceedings 12th Int. Conf. on Information and Knowledge Management, p. 108–115. ACM Press, 2003. 14. J. Vadnerdonckt, A. Beirekdar, M. Noirhomme-Fraiture; Automated Evaluation of Web Usability and Accessibility by Guideline Review, In Proc. Int. Conf. Web Engineering 2004, Springer, p. 17-30 15. J. Zhu, J. Hong, J.G.Hughes; PageCluster: Mining Conceptual Link Hierarchies from Web Log Files for Adaptive Web Site Navigation, ACM Journal Transaction on Internet Technology,2004, Vol.4,Nr.2, p. 185-208