the work of Zeng et al. [19] we have built classifiers using C4.5, RIPPER, and Naïve. Bayes and three feature sets. The first feature set (denoted as [19]) contains ...
Improving the Accuracy of Classifiers for the Prediction of Translation Initiation Sites in Genomic Sequences George Tzanis, Christos Berberidis, Anastasia Alexandridou, and Ioannis Vlahavas Department of Informatics, Aristotle University of Thessaloniki, Thessaloniki 54124, Greece {gtzanis, berber, aalexan, vlahavas}@csd.auth.gr http://mlkd.csd.auth.gr
Abstract. The prediction of the Translation Initiation Site (TIS) in a genomic sequence is an important issue in biological research. Although several methods have been proposed to deal with this problem, there is a great potential for the improvement of the accuracy of these methods. Due to various reasons, including noise in the data as well as biological reasons, TIS prediction is still an open problem and definitely not a trivial task. In this paper we follow a three-step approach in order to increase TIS prediction accuracy. In the first step, we use a feature generation algorithm we developed. In the second step, all the candidate features, including some new ones generated by our algorithm, are ranked according to their impact to the accuracy of the prediction. Finally, in the third step, a classification model is built using a number of the top ranked features. We experiment with various feature sets, feature selection methods and classification algorithms, compare with alternative methods, draw important conclusions and propose improved models with respect to prediction accuracy.
1 Introduction The rapid progress of computer science in the last decades has been closely followed by a similar progress in molecular biology. Undoubtedly, the use of computational tools has given a boost in the collection and analysis of biological data, creating one of the hottest areas of research, namely bioinformatics. Molecular biology deals with the study of the structure and function of biological macromolecules. During the last decade, the field of data mining and knowledge discovery provided the biologists with a new set of tools for high performance processing of large volumes of data. As a multidisciplinary field, data mining uses techniques from various other areas, such as artificial intelligence, machine learning, statistics, database technology, etc. Genomic sequences represent a large portion of the biological data that require the use of computational tools in order to be analyzed. Despite the rapid developments of the ongoing research in this field, there is still limited knowledge about the role that each part of these molecules plays and how this relates to other parts. The large size of the sequences and the numerous possible features are the main reasons behind the urgent need for representation, algorithmic and mathematical methods that allow for the efficient analysis of such data and the delivery of accurate and reliable knowledge
to the domain expert. Depending on the problem tackled, pattern discovery and classification are two of the most common tasks usually performed on these symbolic sequences, that consist of an alphabet of nucleotides or amino acids. Translation, along with transcription and replication, are the major operations that relate to biological sequences. The recognition of Translation Initiation Sites (TISs) is essential for genome annotation and for better understanding of the process of translation. It has been recognized as one of the most critical problems in molecular biology that requires the generation of classification models, in order to accurately and reliably distinguish the valid TISs from a set of false ones. However, the traditional machine learning methods are not directly applicable to these data. The necessity to adapt these methods to this kind of problems has been the motivation behind our research. Although many approaches have been proposed to deal with this problem, there is a great potential for the improvement of their accuracy. In this paper we apply data mining to tackle the problem of the prediction of TISs in DNA sequences. We use a large number of features and different classifiers in order to build more accurate models. Some of the features are directly extracted from the raw sequences, concerning the nucleotides present at each position of the sequence, but most of them are generated. Along with the features already discussed in other papers, we generate and propose the use of some new ones. We show that a combination of these features improves the accuracy of the prediction models. In order to select the best features, various ranking algorithms are utilized to evaluate the contribution of each feature to the accuracy of prediction. After a number of the best features is selected, we use various algorithms to build classification models. We present the results of our experiments, we compare them with other methods and finally, we draw interesting conclusions. For our experiments we used a real world dataset that contains processed DNA sequences collected from vertebrate organisms. This paper is outlined as follows: In the next section we briefly present the relative work in the area of TIS prediction. In section three we describe the problem and provide the background knowledge. In section four we present the dataset and the approach selected. Section five contains the results of our experiments and finally, in section six we present our conclusions as well as some directions for future research.
2 Related Work Since 1982 the prediction of TISs has been extensively studied using biological approaches, data mining techniques and statistical models. Stormo et al. [17] used the perceptron algorithm to distinguish the TISs. Meanwhile, in 1978 Kozak and Shatkin [9] had proposed the ribosome scanning model, which was later updated by Kozak [7]. According to this model, translation initiates at the first start codon that has an appropriate context. Later, in 1987 Kozak developed the first weight matrix for the identification of TISs in cDNA sequences [6]. The following consensus pattern was derived from this matrix: GCC[AG]CCatgG. The bold residues are the highly conserved positions. Pedersen and Nielsen [13] made use of artificial neural networks (ANNs) to predict which AUG codons are TISs achieving an overall accuracy of 88% in Arabidopsis
thaliana dataset and 85% in vertebrate dataset. Zien et al. [20] studied the same vertebrate dataset, but instead of ANNs employed support vector machines using various kernel functions. Hatzigeorgiou [3] proposed an ANN system named “DIANA-TIS” consisting of two modules: the consensus ANN, sensitive to the conserved motif and the coding ANN, sensitive to the coding or non-coding context around the initiation codon. The method was applied in human cDNA data and 94% of the TISs were correctly predicted. Salamov et al. [16] developed the program ATGpr, using a linear discriminant approach for the recognition of TISs by estimating the probability of each ATG codon being the TIS. Nishikawa et al. [12] presented an improved program, ATGpr_sim, which employs a new prediction algorithm based on both statistical and similarity information. This new algorithm exploits the similarity to known protein sequences achieving better performance in terms of sensitivity and specificity. Zeng et al. [19] used feature generation and correlation based feature selection along with machine learning algorithms. In their study, used a large number of k-gram nucleotide patterns. Using a ribosome scanning model and the selected features they achieved an overall accuracy of 94% on the vertebrate dataset of Pedersen and Nielsen. In [11] the three-step approach followed in [19] (feature selection, feature generation and feature integration) is also presented. They discuss various methods for feature selection and describe the use of different classification algorithms. Later, in [10] the same three-step method was used, but k-gram amino acid patterns were generated, instead of k-gram nucleotide patterns. A number of the top ranked features were selected by an entropy based algorithm and a classification model was built for recognition of TISs applying support vector machines or ensembles of decision trees.
3 Background Knowledge and Problem Description The main structural and functional molecules of an organism’s cell are proteins. Another important family of molecules are nucleic acids. The most common nucleic acids are deoxyribonucleic acid (DNA) and ribonucleic acid (RNA). DNA is the genetic material of almost every living organism. RNA has many functions inside a cell and plays an important role in protein synthesis. Both proteins and nucleic acids are linear polymers of smaller molecules (monomers). The term sequence is used to refer to the order of monomers that compose the polymer. A sequence can be represented as a string of different symbols, one for each monomer. There are twenty protein monomers called amino acids and five nucleic acid monomers called nucleotides. Every nucleotide is characterized by the nitrogenous base it contains: adenine (A), cytosine (C), guanine (G), thymine (T), or uracil (U). DNA may contain a combination of A, C, G, and T. In RNA U appears instead of T. A sequence of nucleotides has two ends called the 5′ and the 3′ end. Moreover, it is directed from the 5′ to the 3′ end ( 5′ → 3′ ). Proteins and nucleic acids are called macromolecules, due to their length. Proteins are synthesized by the following process. DNA is transcribed into a messenger RNA (mRNA) molecule (transcription). Then mRNA is used as template for the synthesis of a protein molecule (translation). In our setup, we focus on the process of translation, which is further explained below.
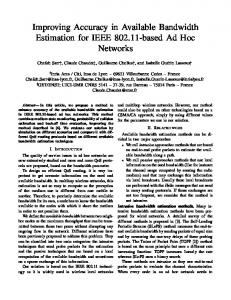
An organelle called ribosome is the “factory” where translation takes place. The mRNA sequence is scanned by the ribosome, which reads triplets of nucleotides named codons. Thus, a protein of n amino acids is coded by a sequence of 3n nucleotides. Some amino acids are coded by more than one codon. There are three different ways to read a given sequence in a given direction. Each of these ways of reading is referred to as reading frame. The first reading frame starts at position 1, the second at position 2 and the third at position 3 of the sequence. The reading frame that is translated into a protein is named Open Reading Frame (ORF). Translation, usually, initiates at the AUG codon nearest to the 5′ end of the mRNA sequence. However, there are some escape mechanisms that allow the initiation of translation at following, but still near the 5′ end AUG codons. These mechanisms of translation initiation make more difficult the recognition of the TIS on a given genomic sequence. Also, GUG and UUG sometimes are used as start codons, but this rarely happens in eukaryotes [8]. Moreover, there are three stop codons encoding the termination of translation (UAG, UAA and UGA). After the initiation of translation, the ribosome “reads” the mRNA codon by codon. For each codon “read” a transfer RNA (tRNA) molecule brings the proper amino acid. The amino acid is added to the protein chain, which, by this way, is elongated until a stop codon is reached. A codon that is contained in the same reading frame with respect to another codon is referred to as “in-frame codon”. The coding region of an ORF is bounded by the initiation codon and the first in-frame stop codon. The direction of translation is 5′ → 3′ . We name upstream the region of a nucleotide sequence from a reference point towards the 5′ end. Respectively, the region of a nucleotide sequence from a reference point towards the 3′ end is referred to as downstream. In TIS prediction problems the reference point is an AUG codon. The above are illustrated in Fig. 1. direction of translation coding region 5′ end
AUG upstream mRNA
nucleotide
ribosome
in-frame codon
3′ end
... UGA downstream
AUG initiation codon in-frame stop codon UGA
Fig. 1. Translation initiation - The ribosome scans the mRNA until it reads an AUG codon. If the AUG codon has appropriate context, then probably the translation initiates at that site
4 Materials and Methods In this section we describe the dataset and the three step approach we followed in order to improve the classification accuracy.
4.1 Dataset
The original dataset we use consists of 3312 genomic sequences collected from various vertebrate organisms. These sequences were extracted from GenBank, the US NIH genetic sequence database [2] and only those sequences with an annotated TIS are included. The dataset is publicly available in [5]. The DNA sequences have been processed in order to remove the interlacing non-coding regions (introns) and their alphabet consists of the letters A, C, G and T. Thus, a candidate initiation codon is referred to as ATG codon instead of AUG codon. These sequences contain 13503 ATG codons in total, whereof 3312 of them are TISs. 4.2 Feature Generation
In order to build the classification models, we generate a large number of frequency counting features. Among them is a set of k-gram nucleotide patterns, i.e. nucleotide sequences of length k. For example, A, C, G and T are the four 1-grams for a DNA sequence. AA, AC, AG, AT are four of the sixteen possible 2-grams. Each k-gram nucleotide pattern is an individual feature. Also, the in-frame 3n-grams are generated (n is a positive integer). For instance, the feature IN_GCC counts the in-frame GCC codons. Apart from k-grams, we also generate a new set of features of the form IN_POS_k_X, where 1 ≤ k ≤ 3 and X is any nucleotide. By POS_k we mean the position k at an in-frame codon. For example, in the sequence of Fig. 2 the value of IN_POS_2_C is 4. Moreover, we generate a number of new features to count the differences of the frequencies between the nucleotides. For example, we consider the feature A/G-T/C_DIF, which counts the difference of thymines and cytosines from the adenines and guanines (A + G – T – C). 1
5′
2
3
1
2
3
1
2
3
1
2
3
G C C A C C A T G G C A T C G
3′
Fig. 2. The positions of the nucleotides inside the in-frame codons
We also consider the same features twice; first, for upstream and second, for downstream nucleotides. For example, for feature F we calculate UP_F, which counts the frequency of F upstream of the ATG and DOWN_F, which counts the frequency of F downstream of the ATG. A set of new features we use is based on the difference between upstream and downstream occurrences. These features are denoted as UP_DOWN_F_DIF. For example, UP_DOWN_A/G_DIF counts the difference between upstream and downstream frequencies of adenines and guanines. The following binary features are also included: DOWN_IN_STOP and A/G_POS_-3. The former indicates the existence of a downstream stop codon (TAA, TAG or TGA) inside the same reading frame of the ATG. The latter indicates the presence of an adenine or a guanine at position –3, according to Kozak’s consensus pattern. The position of the A of the ATG codon is considered to be the position +1 and the numbering increases for the next nucleotides. The nucleotide preceding the A of the ATG codon is at position –1, and the numbering decreases for upstream nucleo-
tides (Fig. 3). Finally, each position of the window is also considered as an individual feature (i.e. POS_+3). -6 -5 -4 -3 -2 -1 +1 +2 +3 +4 +5 +6 +7 +8 +9
5′
G C C A C C A T G G C A T C G
3′
Fig. 3. The positions of the nucleotides relative to an ATG codon
We have developed an iterative algorithm to generate all the above described features. At each iteration a sequence is read from the given dataset. Then, the sequence is scanned and when an ATG codon is found, a window centered at this codon is created. The window covers N nucleotides upstream and N nucleotides downstream of the ATG. N is given by the user. After the window is created, it is scanned once for each feature in order to calculate its value. The calculated value for a certain feature may be a frequency count, a binary value or a nominal value for the features concerning the nucleotide presence at each position of the window. The positions that do not correspond to any nucleotide, because the segment of the sequence is shorter than the end of the window, are denoted as unknown by the symbol “?”. When the values of all the features have been calculated, they are stored in an output file as a new record. This file is the input for the feature selection algorithms. 4.3 Feature Selection
Zeng et al. in [19] used k-gram nucleotide patterns for 1 ≤ k ≤ 5. Their study illustrated that the use of 4-grams or 5-grams does not improve the classification accuracy. We used k-grams for 1 ≤ k ≤ 6 (also in-frame 3-grams and 6-grams were used) and observed that k-grams for k > 3 could not improve the classification accuracy. Therefore, we focused on the k-gram nucleotide patterns for k ≤ 3. We experimented with various window lengths and we present detailed results for a window of 189 nucleotides. We used three evaluation measures, information gain measure, gain ratio measure and chi-squared statistic in order to rank the candidate features. A number of features exposing a good ranking in all tests were selected. Table 1 shows the feature set proposed in [19], the new features we propose and the best ones finally selected. Table 1. The basic features considered in our study
Features in [19] POS_-3 UP_ IN_ATG DOWN_ IN_CTG DOWN_ IN_TAA DOWN_ IN_TAG DOWN_ IN_TGA DOWN_ IN_GAC DOWN_ IN_GAG DOWN_ IN_GCC
New Features DOWN_IN_POS_2_T DOWN_IN_POS_3_C DOWN_ IN_POS_1_G UP_DOWN_A/G_DIF UP_DOWN_C/T_DIF
Best Features POS_-3 UP_ATG UP_ IN_ATG DOWN_IN_STOP DOWN_IN_POS_2_T DOWN_IN_POS_3_C DOWN_ IN_POS_1_G UP_DOWN_A/G_DIF UP_DOWN_C/T_DIF
4.4 Classification
We use three different classification algorithms to test the improvement in accuracy achieved by the use of the new features. The first is C4.5 [15], a decision tree construction algorithm. The second is a propositional rule learner, called Repeated Incremental Pruning to Produce Error Reduction or RIPPER in short [1]. The last algorithm is a Naïve Bayes classifier [4]. We run each algorithm applying 10-fold cross validation, which is generally considered to be one of the most reliable accuracy estimation methods. Moreover, each experiment is repeated ten times and the average results are used for the comparisons. The results of cross validation are evaluated according to some standard performance measures (Table 2). Sensitivity or TP Rate measures the proportion of the correctly classified TISs over the total number of TISs. Specificity or TN Rate measures the proportion of the correctly classified non-TISs over the total number of non-TISs. Precision measures the proportion of the correctly classified TISs over the total number of the instances classified as TISs. Finally, accuracy measures the proportion of the correctly classified instances over the total number of instances. Zeng et al. [19] use another performance measure, named adjusted accuracy. This measure is useful when the dataset is skewed, namely when one class has significantly more instances than the other. This is also the case with our dataset, since the number of non-TISs is significantly larger than the number of TISs and so we included it in our experiments. Table 2. Measures of cross validation performance (TP: True Positives, TN: True Negatives, FP: False Positives, FN: False Negatives)
Sensitivity (TP Rate)
TP TP + FN Accuracy
Specificity (TN Rate)
TN TN + FP
Precision
Adjusted Accuracy TP TP + FP
TP + TN TP + FP + TN + FN Sensitivity + Specificity 2
5 Experiments and Discussion For the conduction of our experiments we used the Weka library of machine learning algorithms [18]. In order to compare our new features with the features proposed in the work of Zeng et al. [19] we have built classifiers using C4.5, RIPPER, and Naïve Bayes and three feature sets. The first feature set (denoted as [19]) contains the nine features proposed in [19]. The second (denoted as [19] + New) contains the features proposed in [19] along with the new features we propose and the third (denoted as Best) contains the best features selected, namely a combination of the features contained in the second feature set with some already studied features (see Table 1). We discovered that the new features improve the classification accuracy of the three classifiers. When the second of the aforementioned feature sets is used with the C4.5 clas-
sifier the accuracy increases from 88.63% to 91.44% (3.17% improvement). With the RIPPER classifier the accuracy increases from 88.31% to 92.11% (4.30% improvement) and finally with the Naïve Bayes classifier the accuracy increases from 85.21% to 87.08% (2.19% improvement). Better results are reported when the third feature set is used, where the improvement in accuracy ranges from 6.23% to 6.70%. The results of our experiments are listed in Table 3, while the graphs in Fig. 4 display the accuracy and the adjusted accuracy achieved by each of the three classifiers. Table 3. Classification performance of the three classifiers using 10-fold cross validation for the features presented in Table 1
Features
Algorithm
C4.5 RIPPER Naïve Bayes C4.5 [19] RIPPER + New Naïve Bayes C4.5 Best RIPPER Naïve Bayes C4.5 [19] RIPPER + DIST Naïve Bayes [19] C4.5 RIPPER + New + DIST Naïve Bayes C4.5 Best RIPPER + DIST Naïve Bayes C4.5 [19] RIPPER + ORDER Naïve Bayes [19] C4.5 RIPPER + New + ORDER Naïve Bayes C4.5 Best RIPPER + ORDER Naïve Bayes [19]
Sensitivity Specificity Precision
93.78 % 92.52 % 85.77 % 94.95 % 94.83 % 85.75 % 97.09 % 96.66 % 90.58 % 96.33 % 95.83 % 87.49 % 96.73 % 96.15 % 85.73 % 98.07 % 97.62 % 89.41 % 95.08 % 94.89 % 85.40 % 95.71 % 95.34 % 85.56 % 97.04 % 96.56 % 87.59 %
72.79 % 75.36 % 83.49 % 80.64 % 83.74 % 91.17 % 85.65 % 86.77 % 90.32 % 88.48 % 88.95 % 87.52 % 89.11 % 90.23 % 91.54 % 93.07 % 93.08 % 90.65 % 76.29 % 76.56 % 87.77 % 81.12 % 83.55 % 91.20 % 85.63 % 86.89 % 90.23 %
91.38 % 92.03 % 94.11 % 93.78 % 94.72 % 96.76 % 95.42 % 95.74 % 96.64 % 96.26 % 96.39 % 95.57 % 96.47 % 96.80 % 96.89 % 97.75 % 97.75 % 96.71 % 92.50 % 92.57 % 95.55 % 93.98 % 94.69 % 96.76 % 95.41 % 95.77 % 96.50 %
Adjusted Accuracy Accuracy 83.29 % 88.63 % 83.94 % 88.31 % 84.63 % 85.21 % 87.80 % 91.44 % 89.29 % 92.11 % 88.46 % 87.08 % 91.37 % 94.28 % 91.71 % 94.23 % 90.45 % 90.52 % 92.40 % 94.40 % 92.39 % 94.14 % 87.50 % 87.50 % 92.92 % 94.86 % 93.19 % 94.70 % 88.63 % 87.15 % 95.57 % 96.84 % 95.35 % 96.51 % 90.03 % 89.72 % 85.69 % 90.47 % 85.72 % 90.39 % 86.59 % 85.98 % 88.42 % 92.14 % 89.44 % 92.45 % 88.38 % 86.94 % 91.34 % 94.24 % 91.72 % 94.19 % 88.91 % 88.24 %
In order to further improve the accuracy of classifiers we include the distance feature (DIST) used in [19], which counts the distance of the current ATG codon from the beginning of the sequence. This feature improves sensibly the accuracy in all cases. However, in many occasions the sequence length is not precisely known. It is possible for a sequence to lack some nucleotides from its start. Generally, the errorfree sequences are rare. Thus, the use of feature DIST is not appropriate for every
dataset. Aiming to treat this problem we use a new feature that counts the order of the ATG codon inside the sequence (ORDER). Although this feature is also affected by the aforementioned problem, it is less sensitive in such situations. For instance, if a part from the 5′ end of a sequence that does not contain any ATGs is missing, then the feature DIST will not measure the actual distance of an ATG from the beginning of the sequence. On the other hand, the feature ORDER will refer to the actual order. Under these conditions, the scientist who wishes to deal with TIS classification should focus more on the features related to the context of the ATG codon than the use of distance or order features. Basic + DIST
Accuracy (%)
97 94 91 88 [19]
[19]+New
Best
Basic + ORDER Adj. Accuracy (%)
Basic
C4.5
95 92 89 86 83 [19]
97 94 91 88 [19]+New
Best
Adj. Accuracy (%)
Accuracy (%)
RIPPER
[19]
[19]
89 86 83 Best
Adj. Accuracy (%)
Accuracy (%)
92
Features
[19]+New
Best
Features
Naïve Bayes
[19]+New
Best
95 92 89 86 83
Features
[19]
[19]+New Features
Features
92 89 86 83 [19]
[19]+New
Best
Features
Fig. 4. Comparison of the accuracy and adjusted accuracy achieved by the three classifiers using 10-fold cross validation for the features presented in Table 1. The experiments were repeated, once including the feature DIST (Basic + DIST), once including the feature ORDER (Basic + ORDER) and once including none of the above two features (Basic)
As shown in the graphs of Fig. 4, the feature DIST improves sensibly the prediction accuracy. The feature ORDER also improves the prediction accuracy, but less notably. However, this is not the case when the Naïve Bayes classifier is used. In this case the use of the DIST or ORDER feature decreases the classification accuracy,
when the best features are used. Moreover, all the metrics indicate an improvement in performance. In particular, the increase in sensitivity and specificity together denotes that both TISs and non-TISs are classified more accurately. However, some exceptions are observed. For example, sensitivity decreases when using the second feature set ([19] + New) along with Naïve Bayes classifier. Also, in the same case specificity increases more than sensitivity is reduced. Since our dataset is skewed, as already discussed, the accuracy of prediction decreases as opposed to the adjusted accuracy that increases. More detailed results of our experiments can be found in the following URL: http://mlkd.csd.auth.gr/TIS/index.html.
6 Conclusions and Future Work The prediction of a TIS in a genomic sequence is very interesting topic in molecular biology. It is not a trivial task and the reasons for this are manifold. First of all, the knowledge about the process of translation is limited. It is known that in more than 90% of the mRNA of eukaryotic organisms the translation initiates at the first AUG codon. However, there are some mechanisms that prevent the initiation of translation at the first AUG codon. Moreover, the available sequences are not always complete and contain errors. For example, due to errors in the dataset used in our study more than 40% of the sequences contain an ATG codon downstream of the true TIS. The same observation was made by Peri and Pandey [14]. They also noticed that most initiation codons contain three or more mismatches from Kozak’s consensus pattern. Finally, the translation is affected not only by the primary structure of mRNA (the order of nucleotides in the sequence), but by the secondary structure as well (the structure that forms mRNA after folding). This is a point to wonder if any significant improvement in accuracy of classifiers can be achieved by just considering the primary structure of the genomic sequences. In this paper, we considered the utilization of a set of new features in order to achieve better accuracy for the prediction of Translation Initiation Sites in genomic sequences. For this purpose we developed a feature generation algorithm, which uses a window of variable length in order to calculate the values of each feature. We applied our algorithm on a real-world dataset that contains processed DNA sequences from vertebrates. We used various algorithms for the evaluation and selection of the features. After extensive experimentation we discovered that the use of these features improves the accuracy of a number of different classifiers. In some cases the accuracy reaches 97%, which, under the issues discussed is considered more than satisfactory. We conclude by providing some directions for future work. There is a great variety of features that can be generated and describe a genomic sequence. Only a portion of them has been so far studied. Our future plans involve the experimentation with novel features, especially those that indicate periodic occurrences of nucleotides. The study of features that incorporate information about the secondary structure of mRNA is also another concern. Additionally, we aim to use more datasets in order to verify the results and study the impact of the features we proposed in other kind of organisms. Finally, experiments with a larger range of window sizes are also under consideration.
References 1. Cohen, W.: Fast Effective Rule Induction. In Proceedings of the 12th International Conference on Machine Learning. Morgan Kaufmann, Lake Tahoe, California, USA (1995) 80-89 2. GenBank Overview. http://www.ncbi.nlm.nih.gov/Genbank/index.html 3. Hatzigeorgiou, A.: Translation Initiation Start Prediction in Human cDNAs with High Accuracy. Bioinformatics (2002) 18(2) 343-350 4. John, G.H., Langley, P.: Estimating Continuous Distributions in Bayesian Classifiers. In Proceedings of the 11th Conference on Uncertainty in Artificial Intelligence. Morgan Kaufmann, San Mateo, California, USA (1995) 338-345 5. Kent Ridge Bio-medical Data Set Repository. http://sdmc.i2r.a-star.edu.sg/rp/ 6. Kozak, M.: An Analysis of 5'-Noncoding Sequences from 699 Vertebrate Messenger RNAs. Nucleic Acids Research (1987) 15(20) 8125-8148 7. Kozak, M.: The Scanning Model for Translation: An Update. The Journal of Cell Biology (1989) 108(2) 229-241 8. Kozak, M: Initiation of Translation in Prokaryotes and Eukaryotes. Gene (1999) 234(2) 187208 9. Kozak, M., Shatkin. A.J.: Migration of 40 S Ribosomal Subunits on Messenger RNA in the Presence of Edeine. Journal of Biological Chemistry (1978) 253(18) 6568-6577 10. Liu, H., Han, H., Li, J., Wong, L.: Using Amino Acid Patterns to Accurately Predict Translation Initiation Sites. In Silico Biology (2004) 4(3) 255-269 11. Liu, H., Wong, L.: Data Mining Tools for Biological Sequences. Journal of Bioinformatics and Computational Biology, (2003) 1(1) 139-168 12. Nishikawa, T., Ota, T., Isogai, T.: Prediction whether a Human cDNA Sequence Contains Initiation Codon by Combining Statistical Information and Similarity with Protein Sequences. Bioinformatics (2000) 16(11) 960-967 13. Pedersen, A.G., Nielsen, H.: Neural Network Prediction of Translation Initiation Sites in Eukaryotes: Perspectives for EST and Genome analysis. In Proceedings of the 5th International Conference on Intelligent Systems for Molecular Biology, AAAI Press, Menlo Park, California, USA (1997) 226-233 14. Peri, S., Pandey, A.: A Reassessment of the Translation Initiation Codon in Vertebrates. Trends in Genetics (2001) 17(12) 685-687 15. Quinlan, J.R.: C4.5: Programs for Machine Learning, Morgan Kaufmann, San Mateo, California, USA (1993). 16. Salamov, A.A., Nishikawa, T., Swindells, M.B.: Assessing Protein Coding Region Integrity in cDNA Sequencing Projects. Bioinformatics (1998) 14(5) 384-390 17. Stormo, G.D., Schneider, T.D., Gold, L., Ehrenfeucht, A.: Use of the 'Perceptron' Algorithm to Distinguish Translational Initiation Sites in E. coli. Nucleic Acids Research (1982) 10 (9) 2997-3011 18. Witten, I.H., Frank, E.: Data Mining: Practical Machine Learning Tools with Java Implementations. Morgan Kaufmann, San Francisco (2000) 19. Zeng F., Yap H., Wong, L.: Using Feature Generation and Feature Selection for Accurate Prediction of Translation Initiation Sites. In Proceedings of the 13th International Conference on Genome Informatics, Tokyo, Japan (2002) 192-200 20. Zien, A., Rätsch, G., Mika, S., Schölkopf, B., Lengauer, T., Müller, K.R.: Engineering Support Vector Machine Kernels that Recognize Translation Initiation Sites. Bioinformatics (2000) 16(9) 799-807