Improving the Applicability of Bayesian Networks through Production Rules Raissa da Silva∗1 , Mirko Perkusich†1 , Renata Saraiva‡1 , Arthur Freire§1 , Hyggo Almeida¶1 , and Angelo Perkusichk1 1
Embedded and Pervasive Computing Laboratory, Federal University of Campina Grande, Brazil
1. Introduction Abstract BNs are probabilistic graph models and are used to represent knowledge about an uncertain domain [1]. BNs have been applied to develop expert systems for many contexts such as software process management [12] and effort estimation of web development projects [8]. There are two challenges to build a BN: building the directed acyclic graph (DAG) and defining the NPTs. In this paper, we focus on the second challenge. A BN’s NPT can be automatically learnt from data [6] or by domain expert elicitation [4]. In practice, it is rare to have an adequate database [4] and it becomes necessary to elicit data from domain experts. However, manually defining the NPTs through domain experts can become unfeasible depending on the number of nodes and states, because the complexity grows exponentially. To reduce the effort of defining NPTs through domain experts, Fenton et al. [4] proposed the concept of ranked nodes. It consists of eliciting data from the expert through a truth table composed of ordinal elements using four types of weighted functions. Given the collected data, the calibration of the NPT (i.e., type of function, weights and variance) is defined. The authors applied the approach in two cases: safety assessment and software defect prediction, saving 84% and 93%, respectively, of effort compared to a manual approach. On the other hand, to use this solution it is necessary to understand the concept of ranked nodes, because given the data collected from the expert, it is necessary to manually calibrate the NPTs. Therefore, it is unpracticable for domain experts with no ranked nodes-specific knowledge. Perkusich et al. [11] presented an approach based on the concept of ranked nodes. They focused on encapsulating Bayesian networks-specific knowledge from the practitioner and reducing the effort to collect data from the expert. On the other hand, it is limited to only one of the four functions presented by Fenton et al. [4]. Therefore, it has
One of the key challenges in constructing a Bayesian network BN is defining the node probability tables (NPT). For large-scale BN, learning NPT through domain experts knowledge elicitation is unfeasible. Previous works proposed solutions to this problem using the concept of ranked nodes; however, they have limited modeling capabilities or rely on BN experts to apply them, reducing their applicability. In this paper, we present an expert system based on production rules to define NPTs with the purpose of enabling the definition of NPTs by experts with no ranked nodes-specific knowledge. To create the rules, we elicited data from an expert in ranked nodes. To validate our approach, we executed an experiment with a BN already published in the literature to verify if, with our approach, a practitioner can achieve the same or better configuration for the NPTs. We used the Brier score to assess the NPTs accuracy and evaluated the results with the Wilcoxon test. All the Wilcoxon tests executed rejected the null hypotheses that stated that the Brier scores for the original NPTs method were the same as the new NPTs. By using our solution, a practitioner can accurately define NPTs without understanding the concept of ranked nodes. Bayesian network, Expert systems, Production rules, Knowledge acquisition
∗
[email protected] †
[email protected] ‡
[email protected] §
[email protected] ¶
[email protected] k
[email protected]
1 DOI reference number: 10.18293/SEKE2016-225
limited modeling capabilities. Our goal is to combine the strengths of the solutions presented in Fenton et al. [4] and Perkusich et al. [11]. With this purpose, we automatized the approach presented in Fenton et al. [4] by using production rules. To create the rules, we elicited data from a BN expert to, for a set of combination of evidences of the parent nodes, define the best configuration of the NPT. To validate our approach, we executed an experiment and used a Bayesian network already published in the literature as the object of study. We randomly selected five nodes from the given Bayesian network as the objects of study and used them to verify if, with our approach, a practitioner can achieve the same or better configuration for the NPTs. For each node, we randomly selected twelve combinations of states to elicit data from one practitioner, calculated the Brier score and evaluated the results with the Wilcoxon test. All the Wilcoxon tests executed rejected the null hypotheses that stated that the Brier score for the old method was the same as the new. Therefore, we conclude that we considerably improved the accuracy of the model presented in Perkusich et al. [10]. This paper is organized as follows. Section 2 presents background on Bayesian networks and ranked nodes. Section 3 presents the methodology used to build and evaluate our solution. Section 4 presents the limitations of the solution and threats to validity. Section 5 presents our conclusions and future work.
2. Background Bayesian networks are probabilistic graph models and are used to represent knowledge about an uncertain domain [1]. A Bayesian network, B, is a directed acyclic graph that represents a joint probability distribution over a set of random variables V [5]. The network is defined by the pair B = {G, Θ}. G is the directed acyclic graph in which the nodes X1 , . . . , Xn represent random variables and the arcs represent the direct dependencies between these variables. Θ represents the set of the probability functions. This set contains the parameter θxi |πi = PB (xi |πi ) for each xi in Xi conditioned by πi , the set of the parameters of Xi in G. Equation 1 presents the joint distribution defined by B over V.
PB (X1 , . . . , Xn ) =
n Y i=1
PB (xi |πi ) =
n Y
θXi |πi
(1)
i=1
There are two challenges to build Bayesian networks: building the directed acyclic graph (DAG) and defining the NPTs [9]. In this paper, we focus only on defining the NPTs. For this purpose, there are two techniques: through (i) databases and (ii) domain experts [11]. Defining probability functions from databases can be automated by a pro-
cess called batch learning [6]. However, for many practical problems one rarely finds an adequate database. On the other hand, manually defining probability functions through domain experts can become unfeasible depending on the number of nodes and states. As shown in the work of Fenton et al. [4], inconsistencies could occur if domain experts try to elicit exhaustively the probability function for a node with a large number (e.g., 125) of states. There are several methods to reduce this complexity and to encode expertise in large scale probability functions. Fenton et al. [4] proposes an approach for Bayesian networks composed of ranked nodes, which are the only types of nodes used in Perkusich et al. [10]. Ranked nodes have an ordinal scale (e.g., [Low, Medium, High]) and are based on the doubly truncated Normal distribution (TNormal) limited in the [0, 1] region. This distribution is based on four parameters: µ, mean (i.e., central tendency); σ 2 , variance (i.e., confidence in the results); a, lower bound (i.e., 0); and, b, upper bound (i.e., 1). This distribution enables us to model a variety of shapes (i.e., relationships) such as a uniform distribution, achieved when σ 2 = ∞, and highly skewed distributions, achieved when σ 2 = 0. In the approach presented in Fenton et al. [4], µ is defined by a weighted function of the parent nodes. There are four weighted functions: weighted mean (WMEAN), weighted minimum (WMIN), weighted maximum (WMAX) and mixture of WMIN and WMAX (MIXMINMAX). According to the authors, these functions are enough to represent the types of relationship necessary for defining the probability function. To define which function should be used, the model developer must perform “what if” analysis with the expert by defining questions and collecting answers to define a truth table. The model developer must analyze the answers and define the most appropriate function. The variance is defined empirically and it should reflect the expert’s confidence in the results [4]. We show an example of questions and answers in Table 1, in which the node C has two parents, A and B. In this example, since C tends to be equal to the smallest value of its parent nodes, the most appropriate function is WMIN.
Table 1. Example of truth table to define the weighted function for µ. A Very high Very low Very low Very high
B Very high Very low Very high Very low
C Very high Very low Very low Low
Perkusich et al. [10] presented a simplified approach to define the probability functions based on the one presented
by Fenton et al. [4]. Instead of “what if” analysis, it orders the relationships between the child and parents nodes given their relative magnitude. With this purpose, it is uses a questionnaire to elicit knowledge from experts. For each child node in the model, there is a question in the questionnaire. The questions are based on a template. The collected data is analyzed using statistical methods and used as input to an algorithm, which is presented in Perkusich et al. [10], that defines the weights for the function of µ. The advantage of this approach is its simplicity to elicit knowledge from several experts and encapsulation of ranked node and Bayesian networks-specific knowledge. The disadvantage is its modeling limitation due to only using one type of function (WMEAN) and fixed variance of 5.0E −4 . Furthermore, given results of a case study presented in Perkusich et al. [12], this approach is too abstract and sensible to errors.
3. Methodology Our main goal is to increase the applicability of using BN by encapsulating the complexity of calibrating the NPTs from the domain experts. With this purpose, we present an expert system based on production rules to, given a set of input values, automatically calibrate a NPT. Our solution is based on the concept of ranked nodes. Therefore, with our solution, domain experts can calibrate the NPTs without the need to understand how ranked nodes work. We evaluated our solution with an experiment using a BN already published in the literature. In Section 3.1, we define the problem in details. In Section 3.2, we present details about our solution. In Section 3.3, we present the process and results of our empirical evaluation.
3.1. Problem definition More specifically, our goal is to combine the modeling capabilities of the approach presented in Fenton et al. [4] and the ranked nodes-specific knowledge encapsulation of the approach presented in Perkusich et al. [11]. To elicit knowledge from experts, as in Fenton et al. [4], we use “what if” analysis (i.e., truth table results). Given the information collected, we automate the calibration of the probability function. To calibrate the probability function of a ranked node it is necessary to define three parameters: f , V = (v1 , ..., vk ) and σ 2 , where f is the type of function, V is a vector containing parent node’s weights and k is the number of parent nodes. In AgenaRisk1 , these variables have the following range: f ∈ {W M EAN, W M IN, W M AX, M IXM IN M AX}, w ∈ {1, ..., 5}, σ 2 ∈ {5.0E −4 , ..., ∞} and k ∈ {1, ..., ∞}. Given that a probability function’s parameters are defined, we can assess the calculations’ (i.e., predictions) ac1 www.agenarisk.com
curacy with the Brier score [2]. For a single prediction, which is our case, it is simply the square of the difference between the predicted probability P (q) and the actual s 2 outcome (o) [3], for each state: B = n=1 (on − qn ) , where B is the Brier score and s is the number of possible outcomes (i.e., number of states of the given node). Given that we want the best possible calibration, the problem is to, given data collected from the experts, find a combination of parameters f and V = (v1 , ..., vn ) that minimizes B.
3.2. Solution Our solution is an expert (i.e., production) system to emulate the knowledge of a specialist on ranked nodes. With this purpose we used production rules. A production rule consists of two parts: a sensory precondition (i.e., IF statement) and an action (i.e., THEN). If an input to the system matches a precondition, an action is triggered. With production rules it is possible to represent an expert knowledge. For instance, the given rule represents our knowledge regarding traffic: ”if the traffic light is red then stop”. To define the rules, we relied on the knowledge of an expert with five years of experience using ranked nodes. We implemented the solution in Expert Sinta2 . In Fenton et al. [4], the authors present the usage of a truth table composed of a combination of states of the parent nodes to collect data from domain experts. Therefore, the first step of our solution was to define which values the truth table should have. With the truth table (i.e, combinations) defined, we could define the preconditions of the system. To elicit the weights for WMAX and WMEAN, Laitila [7] recommends that the expert specifies to which point (i.e., state) the mode of the child node rise when sa = (0)ni=1 changes into sb = (0, ..., 0, sk = 1, 0, ...0); and, for WMIN, the mode of the child node drops when sa = (1)ni=1 changes into sb = (1, ..., 1, sk = 0, 1, ...1). Therefore, for each configuration (i.e., number of parent nodes), we considered 2 ∗ n cases, in which n is the number of parent nodes. The combinations used to calibrate a child node with three parents (A, B and C) considering that all nodes are composed of the states s = (V erylow, Low, M edium, High, V eryHigh) is shown in Table 2. For n = 2, we added the combinations (V eryLow, M edium and (M edium, V eryLow). Then, the expert defined, for each possible combination in the truth table, the best calibration for the NPT (i.e., the action): function type and weights. We defined σ 2 = 5.0E −4 , because, according to the expert, changing the functions and weights is enough. In fact, in Perkusich et al. [10], the authors defined σ 2 = 5.0E −4 and had success. For instance, if for the combination (V eryHigh, V eryLow) the expected value is Low; for (V eryLow, V eryHigh), is Low; for (V eryLow, M edium), is V erylow; and for 2 http://www.lia.ufc.br/
bezerra/exsinta/
Table 2. Truth table for a child node with three parent nodes. A Very high Very high Very low Very low Very low Very high
B Very high Very low Very high Very low Very high Very low
C Very low Very high Very high Very high Very low Very low
(V eryHigh, V eryLow), is V erylow, then the best calibration is: WMIN function, with weights 3 and 5. To verify the calibrations, we used AgenaRisk and the Brier score. To consolidate a rule, the mean Brier score for all combinations was lower than 0.1. The files with the rules defined by the expert are available in a website3 . We only defined rules for child nodes with two and three parents, because whenever a node has more than three parents, divorcing should be used to simplify the BN [3].
3.3. Empirical evaluation To evaluate our solution, we executed an experiment by using a sample of nodes of the BN presented in Perkusich et al. [10] as the object of study. The given BN was chosen due to availability and it models the key factors of Scrum-based software projects with the goal of assisting on the continuous improvement of the team and processes. The BN is composed of twenty child nodes. In other words, there are twenty NPTs to be calibrated. The NPTs were calibrated using the approach presented in Perkusich et al. [11] by collecting data from forty practitioners. The evaluation consists of applying our solution to calibrate a sample of NPTs from the object of study and compare the accuracy of the new NPTs and the old ones. For this purpose, we elicited knowledge from one expert (i.e., subject), whom has five years of experience working on Scrum projects as a Scrum Master and was already familiarized with the BN presented in Perkusich et al. [10]. First, we elicited knowledge regarding the expected value of the NPT for a set of combinations of the states of the parent nodes to use as input to our system, I. Afterwards, we elicited knowledge for a different set, E, in which E ∩ I = ∅, and compared it with the system’s calculated values. In this case, since we compare data generated by our solution with the subject’s, there is no conflict on having the same subject to calibrate and evaluate the NPTs. We focused on the following research question and informal null hypothesis: 3 https://seke2016.wordpress.com/expertsinta-files/
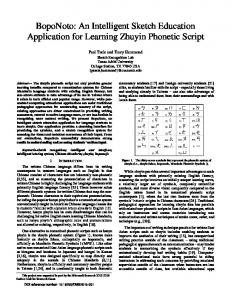
RQ1: Comparing with the old model, does using the new calibration maintain or improve the model’s accuracy given the expert’s expectation? H0 : Accuracy decreases. Due to space limitation, we only present data used to calibrate two nodes. The data collected for all nodes is presented in a website4 . In Figure 1, we present a summarized view of the BN, in which the boxes represent a set of nodes in the original BN. Process quality
Work validation quality
Product increment quality
Product owner work quality
Clients feedback
Sprint Review quality
Acceptance criteria check
Clients feedback outside of the Sprint Review
Sprint goal check
Figure 1. Summarized view of the BN used as object of study. In Table 3, we present the data collected to elicit the table for the node Work validation quality. For this node, by using the rules defined in our system, the calculated calibration was: f = W M EAN and V = (2, 1). In Table 4, we present the data collected to elicit the table for the node Sprint Review quality. For this node, the calculated calibration was: f = W M IN and V = (3, 3, 3). For the experiment, we randomly selected five child nodes, with two or three parents, of the BN presented in Perkusich et al. [10] as the objects of study. The response variable are the old and new models’ accuracy, which we are assessed by the Brier scores. For each node, we randomly defined twelve combinations of parent nodes’ states and used them to, through a truth table, elicit data from the expert regarding the expected central tendency of the given node. For each combination, we calculate the Brier score using the calibration presented in Perkusich et al. [10] and using our calibration. We used the average Brier score to compare the models’ accuracy. Given that the data did not follow a Normal distribution, we used the Wilcoxon test. By analyzing the results of the Wilcoxon tests, one fore each node, we assessed RQ1. The objects of the study were the nodes: Work validation quality, Product backlog quality, Software engineering techniques quality, Sprint Review quality and Product Backlog is properly ordered. Due to space limitation, in Table 5, we only show the elicited data and calculated Brier scores for the node Work validation quality. For the old (i.e., Perkusich et al.’s [10]) model, the average Brier score 4 https://seke2016.wordpress.com/2016/03/17/seke-2016/
Table 3. Data elicited for the node Work validation quality. Sprint Review quality Clients feedback outside of the Sprint Review Work validation quality Very low Very high Low Very high Very low High Very low Medium Low Medium Very low Low
Table 4. Data elicited for the node Sprint Review quality. Stakeholder feedback Sprint goal check Acceptance criteria check Sprint Review quality Very low Very high Very low Low Very high Very low Very low Low Very low Very low Very high Low Very low Very high Very high High Very high Very low Very high Low Very high Very high Very low Medium
is 0.59 with σ = 0.61. For the new (i.e., our) model, the average Brier score is 0.24 with σ = 0.35. By applying the Wilcoxon test with α = 0.5, we had p − value = 0.0042. Therefore, we reject the null hypothesis that states that the median of the Brier score for the NPTs defined with our approach are worse than the original. For the node Product backlog quality, we had p − value = 0.0085. For Software engineering techniques quality, p − value = 0.041. For Sprint Review quality, p − value = 0.033. For Product Backlog is properly ordered, p − value = 0.0017. Therefore, for all nodes, we conclude that the new model is more accurate. A threat to validity is that we might not have evaluated enough nodes to assess RQ1.
clusion threats to validity are related to the sample sizes used for the objects of study. The original BN was composed of twenty child nodes and we only evaluated five. Furthermore, to compare the accuracies, we only evaluated twelve combination of states. The internal threats to validity are related to the subject selection process. On the other hand, we minimized this threat by choosing an expert familiarized with the BN, which minimized the threat of eliciting inconsistent knowledge. The external threats to validity concern the ability to generalize experiment results outside the experiment setting. Since we only one BN and one subject, we cannot generalize our results. However, given that ranked nodes are used and the data collected from the domain expert is consistent, there is no reason to believe that our system would not output accurate data.
4. Limitations 5. Conclusion The limitations of this study are related to the production rules definition and threats to validity regarding the experiment. Regarding the production rules definition, we only relied on the experience of one expert to define them. To minimize this limitation, we selected an expert experienced with ranked nodes and we used the Brier score to minimize the chances of an incorrect rule definition. Furthermore, the proposed system only handles child nodes with two or three parents. However, in practice, this should not limit its application, because whenever a node has more than three parents, divorcing should be used to simplify the BN [3]. Additionally, the solutions were defined for ranked nodes composed of a 5-point Likert scale. Finally, the definition of the rules are based on values of AgenaRisk. On the other hand, currently, it is the only tool that implements ranked nodes. Regarding the limitations of the experiment, it has conclusion, internal, and external threats to validity. The con-
In this paper, we presented an expert system to, given knowledge elicited from the domain expert, automate the definition of NPTs of BN. Our solution is based on ranked nodes and decreases the complexity of defining NPTs. Furthermore, it increases the applicability of using BN, because it encapsulates from the domain expert the complexity regarding calibrating the NPTs. We improved the method of defining the probability functions of the model presented in Perkusich et al. [10] by automating the approach presented in Fenton et al. [4] using production rules. We used the method to elicit data from one expert and calibrate the model. To evaluate our solution, we executed an experiment with five randomly selected nodes, with two or three parents, from a BN presented in the literature [10] as the objects of the study, in which we compared the accuracy of NPTs defined with our approach with the originals. For
Table 5. Data collected and calculated Brier scores for the node Work validation quality. Clients feedback outside of Sprint Review quality Work validation quality Old Brier score New Brier score the Sprint Review High Very low Low 0.5 0.0085 High Low Low 1.8 0.97 Low High High 1.8 0.97 Medium Low Low 0.5 0.18 Low Medium Medium 0.5 0.18 Very high Medium High 0.0041 0.18 Medium Very high High 0.0041 0.18 Low Very high High 0.5 0.0077 Very low High Medium 0.5 0.0077 Very high Low Medium 0.5 0.0077 High Medium Medium 0.5 0.18 Very low Very low Very low 0.0021 0.0013
each node, we randomly selected twelve combinations of states to elicit data from the expert, calculated the Brier score and evaluated the results with the Wilcoxon test. All the Wilcoxon tests executed rejected the null hypotheses that stated that the Brier score for the old method was worse than the new. Therefore, we concluded that, with our solution, a domain expert can calibrate NPTs with the same accuracy as with Fenton et al. [4], because the expert system was built following their approach, and without ranked nodes-specific knowledge. For future works, we intend to investigate the risks on using ordinal scales to elicit expert knowledge and use fuzzy logic to model the elicited data from experts. Furthermore, we plan on developing a tool that supports ranked nodes and use genetic algorithms to calibrate the probability functions.
References [1] I. Ben-Gal. Bayesian Networks. John Wiley and Sons, 2007. [2] G. W. Brier. Verification of forecasts expressed in terms of probability. Monthly Weather Review, 78(1):1 – 3, 1950. [3] N. Fenton and M. Neil. Risk Assessment and Decision Analysis with Bayesian Networks. CRC Press, 5 edition, 11 2012. [4] N. E. Fenton, M. Neil, and J. G. Caballero. Using ranked nodes to model qualitative judgments in bayesian networks. IEEE Trans. on Knowl. and Data Eng., 19(10):1420–1432, Oct. 2007. [5] N. Friedman, D. Geiger, and M. Goldszmidt. Bayesian network classifiers. Machine Learning, 29(2-3):131– 163, 1997.
[6] D. Heckerman. Learning in graphical models. chapter A Tutorial on Learning with Bayesian Networks, pages 301–354. MIT Press, Cambridge, MA, USA, 1999. [7] P. Laitila. Improving the Use of Ranked Nodes in the Elicitation of Conditional Probabilities for Bayesian Networks. Master’s thesis, Aalto University, Espoo, Finland, 2013. [8] E. Mendes. Using knowledge elicitation to improve web effort estimation: Lessons from six industrial case studies. In Software Engineering (ICSE), 2012 34th International Conference on, pages 1112–1121, June 2012. [9] M. Neil, N. Fenton, and L. Nielson. Building large-scale bayesian networks. Knowl. Eng. Rev., 15(3):257–284, Sept. 2000. [10] M. Perkusich, H. O. de Almeida, and A. Perkusich. A model to detect problems on scrum-based software development projects. In Proceedings of the 28th Annual ACM Symposium on Applied Computing, SAC ’13, pages 1037–1042, New York, NY, USA, 2013. ACM. [11] M. Perkusich, A. Perkusich, and H. Almeida. Using survey and weighted functions to generate node probability tables for Bayesian networks. In Proceedings of BRICS-CCI 2013, 2013. [12] M. Perkusich, G. Soares, H. Almeida, and A. Perkusich. A procedure to detect problems of processes in software development projects using bayesian networks. Expert Systems with Applications, 42(1):437 – 450, 2015.