Improving the Dielectric Properties of Polymers by Incorporating Nano-particles. C Zou*, J C Fothergill*, M Fu* J K Nelson**. *University of Leicester, UK ...
Improving the Dielectric Properties of Polymers by Incorporating Nano-particles
C Zou*, J C Fothergill*, M Fu* J K Nelson** *
University of Leicester, UK
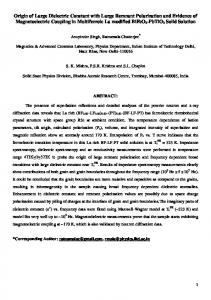
ABSTRACT The paper presents a brief review of the promise of nanotechnology applied to polymeric insulation materials and discusses the electrical properties found. For a variety of nanocomposites, the dielectric behaviour has shown that the interface between the embedded particles and host matrix holds the key to the understanding of the bulk phenomena being observed. Dielectric spectroscopy verified the motion of carriers through the interaction zones that surround the particles. The obvious improvements in endurance and breakdown strength of nanocomposites may be due to a reduction of charge accumulation. PEA space charge tests confirm this charge dissipation. By examining the onset field of space charge accumulation, it may be possible to determine whether a system is likely to be useful. THE PROMISE OF NANOTECHNOLOGY Research into nanotechnology has grown exponentially over the last decade. The rate of publication has increased with a year-on-year rise of more than 40%, Figure 1.
1000 n exp{0.3464.t } 100
Rensselaer Polytechnic Institute, US
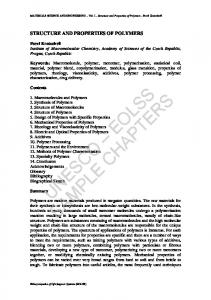
50% volume/volume) fillers with dimensions in the tens or hundreds of microns. The dielectric properties of composites are, at least partly, defined by processes on the surfaces of the particles [1] and the specific area of the fillers in nanocomposites is much greater than that of microcomposites. A nanocomposite comprising 10% v/v of 10 nm diameter spherical particles has a specific area of 6 107 m2/m3 whereas a microcomposite comprising 50% v/v of 100 m diameter spherical particles has a specific area 2000 times less than this. For this example, there are also 2 1011 times as many nanoparticles in a given volume than microparticles. The average distance between particles in typical concentrations is approximately equal to the particle diameter*, so that most of the polymer matrix in a nanocomposite is very close to a particle. Since the dielectric properties of the particlepolymer interface are likely to extend over several atomic diameters – perhaps around 1 nm – this “interaction zone” would be expected to have a significant effect. For example, Figure 2 shows that, for a 10% v/v nanocomposite, with a 10 nm particle, a 1 nm thick interaction zone occupies approximately 7% of the volume whereas a 5 nm zone would occupy about 70% of the volume. Anisotropic fillers with high aspect ratios can selfassemble into “superstructures” even at low concentrations giving the possibility of a wide range of dielectric, chemical, physical and thermal properties. Such “nanodielectrics” may be able to transform conventional polymer dielectrics into far more sophisticated materials. 100
10 1990
1995
2000
% volume occupied by interface
Number of Publications, n
10000
**
2005
Year, t
Figure 1 Number of papers by calendar year containing the word “nanotechnology” in the combined Compendex® & Inspec® database This has stimulated interest in the possibility of using nanotechnology concepts in the field of dielectrics and electrical insulation [1,2]. There has been particular interest in nanocomposites since these can utilise existing polymers and production procedures [3]. Such nanocomposites comprise filler particles with dimensions of no more than a few tens of nanometres distributed in a polymer matrix. Conventional composites use high concentrations (of the order of
0.5 nm 1 nm 5 nm
80 60 40 20 0 1
10
100
Nanoparticle diameter, nm
Figure 2 The % of the volume occupied by the interaction zone in a 10% v/v nanocomposite *
This is strictly true for a 6.54% (= /48) v/v concentration of spherical particles.
DEVELOPMENT OF NANO-DIELECTRICS Dielectric Spectroscopy Analysis The first reported experimental work on nanocomposite dielectrics for electric insulation was that of Nelson et al [4] working at the University of Leicester. These nanocomposites using an epoxy resin matrix containing inert oxide (e.g. SiO2) nanoparticles with dimension 20 – 30 nm. Large differences were reported in the dielectric spectrum and also in the ability to store space charge. For example, in [5], results were reported on the real and imaginary components of relative permittivity as a function of frequency for 10% (by weight) TiO2-filled micro- and nano-composites at 393 K. Figure 3 shows the relative permittivity Bode plots and loss tangent ( "/ ') calculated from this data.
100 10 1 0.1 0.01 1E-3
1E-1
1E+1
1E+3
1E+5
(a)
(b) Figure 3 Real and imaginary relative permittivity of micro- and nano- composite materials at 393 K. Figure (a) highlights the classic Maxwell-Wagner behaviour found in the microcomposite whilst figure (b) shows the LFD behaviour found in the nanocomposite
Wagner interfacial polarisation around the microparticles. The nanocomposite shows a quite different behaviour below 0.1 Hz. The real and imaginary parts of the relative permittivity are now parallel, indicative of what Jonscher [6] termed a “lowfrequency dispersion (LFD)” or what Dissado and Hill [7] refer to as “quasi-DC (QDC)” behaviour. The flattening out of the tan- response at lower frequencies is also symptomatic of QDC behaviour. This behaviour is typically observed when charge carriers have some limited freedom of movement and, under the influence of the electric field, follow tortuous paths that do not allow transport right through the material. It seems likely that the carriers are moving through partially interconnected interaction zones that surround the particles. Lewis has considered the dielectric effects on the material surrounding nanoparticles [1] and, in particular, the production of a Stern layer on the surface of the particles surrounded by a diffuse Gouy-Chapman layer. In epoxies, however, this Stern layer may be due to the effect of water. It is well known that relatively low concentrations of water in resins can lower mechanical adhesive fracture energies [8] and it seems reasonable that water would form in monolayers around oxide particles in a resin. Since there would be many dangling bonds at the surface of the oxide, it is likely to attract hydrogen ions (H+, protons) that could then move in the presence of a field. Indeed, this is effect utilized in electro-osmotic pumps [9]. It is difficult to calculate the thickness of this layer in a dielectric since this has only been considered for liquid electrolytes and for solid crystals containing defects. If assume one defects in every 10 nm (i.e. about the length of a chain of an epoxy molecule), the interaction zone would then be approximately 3 nm [5,10]. From calculations such as those leading to Figure 2, we could estimate for particles of 20 – 30 nm this would still be at a sub-percolation level. (An estimate would be that the effective volumetric concentration of {particle + interface} in the matrix would be ~20%, whereas the percolation level for spheres is closer to 29%.) The distances between nanoparticles would be random and may well form a fractal-like circuit of the type proposed by Dissado and Hill to explain the QDC dielectric response [7]. We can therefore conclude that the movement of charge in this material is enhanced by the presence of the nanoparticles due to their high specific surface area and this would be expected to greatly change the dielectric behaviour of such materials. Measurements of Space Charge
Between 0.1 and 100Hz, the microcomposite and nanocomposite behave in a similar way although a detailed analysis suggests that the nanoparticles are restricting chain movement in this frequency range. At lower frequencies, the real permittivity of the microcomposite shows a marked increase with decreasing frequency which is likely to be Maxwell-
Early work showed that space charge was likely to be more mobile in these epoxy nano-composites [4,5,11]; this is certainly consistent with this interpretation of the dielectric spectroscopy results. This may be useful, since an accumulation of space charge leads to field distortion within the material. So, for a given applied
field (i.e. voltage/thickness), the maximum internal field may be considerably higher. This can then lead to premature breakdown of the insulating system. Evidence shows that this also occurs in other nanocomposites. Figure 4 is taken from Tanaka et al [3] and is based on work first reported by Zilg et al [12]. In this work ethylene/vinylacetate (EVA) and isotactic polypropylene (iso-PP) nanocomposites were prepared from organophlic layered silicates; these form “nanolayers” – i.e. layers of filler a few nanometres thick – rather than nanoparticles. Their comparison of unfilled and nanofilled materials, with different filler concentrations, showed that space charge accumulation phenomena were considerably affected by the presence of nanofillers. In particular, they found that nano-fillers decreased the space charge at medium and high electric fields, although it was increased at low fields. The DC conduction current also increased for nanocomposites.
Table 1 The breakdown strength, kV/mm, (characteristic Weibull value) of functionalized polyethylene nanocomposites as a function of temperature
Material XLPE
25 C 269
XLPE with untreated nanosilica XLPE with aminosilane treated nanosilica XLPE with HMDS treated nanosilica XLPE with vinylsilane treataed nanosilica
Temperature 60 C 70 C 80 C 184 129 79
315
261
213
84
400
266
263
135
337
225
208
129
447
422
344
221
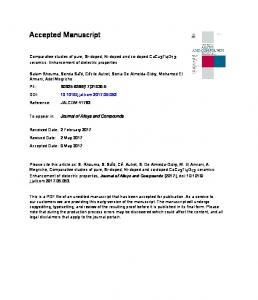
The materials were also tested for voltage endurance, Figure 5. Although some effect of the interface is seen on the breakdown voltage, the correlation is much less marked in the case of the voltage endurance behaviour. Here, the characteristics show an enormous improvement in the behaviour due to the inclusion of nanoparticles, but only a marginal change due to type of coupling at the interface.
900
Figure 4 Comparison of Space Charge Values for an applied field of 40 kV/mm for EVA and PP, with and without 6% w/w of nanofillers, cited from [3] Electrical Breakdown and Voltage Endurance in Nano-dielectrics Many authors have since reported on the electrical breakdown characteristics of nanocomposites. Although the breakdown strength and reliability have not always been found to improve, there have been some spectacular successes. Work with the group at Rensselaer Polytechnic Institute, US, [13] has shown that, if appropriate surface treatments are used, it is possible to improve the time-to-failure of crosslinked polyethylene (XLPE) filled with silica nanoparticles. The host matrix used in this study was a cable grade polyethylene (Borealis LS4212) into which was introduced 5% (by weight) fumed SiO2 nanoparticulates having a mean diameter of 23 nm. Multiple recessed specimens were tested for dielectric strength using ramp DC voltages. The nano-filled systems were found to have higher breakdown strength and there was also an effect related to the nature of the particle surface.
kV/mm
XLPE only XLPE + 5% untreated nanosilica XLPE + 5% HMDS treated nanosilica XLPE + 5% Aminosilane treated nanosilica XLPE + 5% Vinylsilane treated nanosilica
800
700
600
500
400 10
2
10
3
10
4
log (time, min)
Figure endurance of functionalized Figure 5 1 The Thevoltage voltage endurance of functionalized nanocomposites in comparison with the base nanocomposites in comparison with the base polyethylene polyethylene
Similar behaviour has been found by other workers, see for example Cao et al [14] for results on polyimides nanocomposites. Further information on the role of the interface may be found in Roy et al [15]. Again this behaviour seems to be related to space charge accumulation. SPACE CHARGE ONSET FIELD In order to explore the field required to cause space charge to accumulate, the following experiment has been carried out. The voltage across a film-shaped specimen, 0.4 – 0.7 mm thick, was gradually increased. Without space charge accumulation, such a specimen
Electrode charge (a.u.)
5
10
15
20
0
25
30
field (kV/mm)
10
15
20
30
40
Figure 6 Electrode charge as a function of field for XLPE + micro Si (figure a and c), and for XLPE + HMDS treated nano Si (figure b and d), for rapid (a and b) and slow (c and d) increase in applied voltage
Table 2 Space charge threshold field values for a range of XLPE samples at room temperature *The aminosilane treated material did not reach its threshold before flashover occurred Samples
Electrode charge (a.u.)
5
20 field (kV/mm)
(b) onset field of XLPE + HMDS treated nano Si
0
10
The dashed lines show the linear relationship expected by equation 1. However, there is a deviation from linearity for the anode field at approximately 13 kV/mm and for the cathode field at approximately 15kV/mm in figure 6 (a). The results for all the specimens tested using both test protocols are shown in Table 2.
(a) onset field of XLPE + micro Si
0
(d) onset field of XLPE + HMDS treated nano Si
Electrode charge (a.u.)
would behave like a capacitor and the charge on the electrodes, q, would be proportional to the applied voltage, v, since, for a perfect capacitor: (1) q v C where C is the capacitance of the specimen. However, if space charge accumulates within the specimen, then the electrode charge deviates from equation 1. In the case of homocharge accumulation, the charge on the electrode will decrease, whereas, in the case of heterocharge accumulation, the electrode charge will increase. By using a pulsed-electroacoustic (PEA) space charge measurement system, the electrode charge was measured as the voltage. The voltage was increased in 1 kV steps. Two test protocols were used. In one, as soon as one step was tested, the next step test was carried out immediately. Results for this are shown in Figure 6 (a) and (b). In the second protocol, each step was maintained for three hours and the space charge results shown in Figure 6 (c) and (d).
25
30
35
field (kV/mm)
Field at anode (kV/mm)
Field at cathode (kV/mm)
Protocol 1
Protocol 2
Protocol 1
Protocol 2
XLPE (base)
13
10
13
9
XLPE + micro Si
13
12
15
10
XLPE + untreated nano Si XLPE + Amino treated nano Si* XLPE + HMDS treated nano Si XLPE + Vinyl treated nano Si
13
12
14
12
>12
>12
>12
>12
26
22
23
16
25
20
26
16
Electrode charge (a.u.)
(c) onset field of XLPE + micro Si
0
5
10
15
field (kV/mm)
20
25
It can be seen that treated nanocomposites display considerably higher fields before the space charge initiation. By comparing the results from the two test protocols for micro composites, homocharge initially accumulated near the cathode when the external voltage was applied. However, after longer times, heterocharge has replaced homocharge to exist near cathode. For nanocomposites, only homocharge is induced near cathode. This also is observed by Nelson and Hu [16]. It can be explained as the nanoparticles cause scattering in the composite so energetic electrons are slowed and will get trapped in front of the cathode,
thus generating the charge that is recorded. This contrasts with microcomposites where the large distance between particles do not contribute too much scattering and thus allow impact ionisation. The residual positive ion charge is seen in PEA studies for the composite. Evidence for the scattering comes from the red shift in the EL spectrum, which clearly indicates a reduction of energy [17]. XLPE / voltage off
4 10m
charge density (C/m3)
3
30m 2h
2 Anode
Cathode
1 0 -1
increasing time -2 0
0.1
0.2
0.3
0.4
0.5
0.6
position (mm)
XLPE + untreated nano Si / voltage off
2 5m 30m 2h
1.5
charge density(C/m3)
1 Cathode
0.5 0 -0.5 -1 -1.5
increasing time
Anode
REFERENCES
-2 -2.5 0
0.1
0.2
0.3
0.4
occurred at low frequency. In the case of nanocomposites, at low frequency, it is more likely to be “quasi-DC” behaviour, which occurs when charge carriers have some limited freedom of movement. The large interaction zone, in which charge move, in nanocomposites brings a significant change in electrical properties. From this point of view, nanoparticles are definitely a good choice for fillers because they present a large surface area on which activity can take place, this can reduce the consumption of fillers [18]. It is shown that some electrical properties, such as electrical breakdown and endurance, can be improved by incorporating nanoparticles. The results also indicate that the introduction of surface modified fillers can have profound effects on the electrical properties of certain nanocomposites. For example, by suitable surface modification, the onset field of space charge accumulation in XLPE can be greatly increased. This suggests that the treated surface of nano-fillers has changed the interface between the nano-fillers and base matrix. It seems likely that whether a system is useful may be determined by examining the space charge behaviour. These findings open the possibilities of tailoring the electrical properties of composites by using surface modification techniques for nanoparticles. Nanocomposites are the subject of intensive research. From commercial and technical viewpoints, nanocomposites have a bright promise. Small changes to processing and manufacturing can have a great improvement on the properties of composites and benefit our society.
0.5
1.
position (mm)
Figure 7 the profiles of space charge accumulation within XLPE and XLPE with untreated nano Si, arrow direction notes the increasing time Figure 7 shows the profiles of space charge accumulation within XLPE and XLPE with untreated nano Si. In order to clearly indicate the presence of homocharge, the measurement was carried out with the removal of external voltage. The amount of homocharge accumulated at the electrodes within nanocomposites is increasing with the time. However, homocharge within XLPE reaches the saturation level very quickly. Since homocharge can modify the interfacial field, it can explain the improved endurance behaviour of nanomaterial which is shown in Figure 5. CONCLUSIONS Very marked differences in dielectric spectroscopy are seen in composites depending on whether the filler has micro- or nano-metric dimensions. For the microcomposites, a classical Maxwell-Wagner interfacial polarization around the micro-fillers has
2.
3.
4.
5.
6. 7.
Lewis, T. J., “Nanometric Dielectrics”, IEEE Trans. DEI, 1, 812-825, 1994 Fréchette, M. F., Trudeau, M., Alamdari, H.D., and Boily, S., “Introductory Remarks on NanoDielectrics,” IEEE Conference on Electrical Insulation and Dielectric Phenomena, Kitchener, Ontario, Canada, Oct. 14-17, 2001 Tanaka, T.; Montanari, G.C.; Mulhaupt, R , “Polymer nanocomposites as dielectrics and electrical insulation-perspectives for processing technologies, material characterization and future applications.”, IEEE Trans. DEI, 11(5), 763- 784, Oct. 2004 Nelson, J.K., Fothergill, J.C.; Dissado, L.A.; Peasgood, W., “Towards an understanding of nanometric dielectrics”, Conference on Electrical Insulation and Dielectric Phenomena (CEIDP), Annual Report, p 295-298, (2002) Nelson, J.K. Fothergill, J.C., “Internal charge behaviour of nanocomposites” Nanotechnology, volume 15, issue 5, p 586 – 595, (2004) Jonscher A.K, “Dielectric relaxation in solids”, Chelsea Dielectric Press 1983, ISBN:0950871109 Dissado L.A. and Hill, R.M., “Anomalous low frequency dispersion. A near DC conductivity in
8.
9. 10.
11.
12.
13.
14.
15.
16. 17. 18.
disordered low dimensional materials”, J. Chem. Soc. Faraday Trans. 2, 80, pp 291-319, 1984 Kinloch, A.J.; Little, M.S.G.; Watts, J.F., “The role of the interphase in the environmental failure of adhesive joints”, Acta mater. 48, 4543-4553, 2000 Probstein, R.F., Physicochemical Hydrodynamics (second ed.), Wiley, New York (1994) Tschöpe A., “Grain size-dependent electrical conductivity of polycrystalline cerium oxide II: Space charge model”, Solid state Ionics, Vol. 139, pp 267-80, 2001 Fothergill, J.C.; Nelson, J.K.; Fu, M., “Dielectric properties of epoxy nanocomposites containing TiO2, Al2O3 and ZnO fillers”, Annual Report Conference on Electrical Insulation and Dielectric Phenomena, CEIDP, p 406-409, 2004 Zilg, C., Kaempfer, D., Muelhaupt, R., and Montanari, G.C., “Electrical properties of polymer nanocomposites based upon organophilic layered silicates”, Proc.IEEE-CEIDP2003, No.65, 546-550, (2003) Roy, M; Nelson, J.K.; Schadler, L.S.; Zou, C.; Fothergill, J.C., “The Influence of Physical and Chemical Linkage on the Properties of Nanocomposites”, Annual Report - Conference on Electrical Insulation and Dielectric Phenomena, CEIDP, p 183-186, 2005 Cao, Y.; Irwin, P.C.; Younsi, K, “The future of nanodielectrics in the electrical power industry”, IEEE Trans. DEI, 11(5), 797- 807, Oct. 2004 Roy, M.,Nelson, J.K.; MacCrone, R.K.; Schadler, L.S.; Reed, C.W.; Keefe, R., “Polymer nanocomposite dielectrics-the role of the interface” IEEE Trans. DEI, 12(4), p 629-43, Aug. 2005 Nelson, J K, Hu, Y., ICPADM 2006, (to be published) Nelson, J K, IEEE International Symposium on Electrical Insulation, 2006, Toronto Ma Dongling, Treese A hugener, Siegel W Richard, Christerson Eva Anna, Carina, Onneby Martensson and Linda S Schadler, “Influence of nanocomposites surface modification on the electrical behaviour of polyethylene nanocomposites”, Nanotechnology, 724-731, 16 (2005)