Improving the effectiveness of SQL learning practice: a data-driven approach Luca Cagliero, Luigi De Russis, Laura Farinetti Politecnico di Torino Torino, Italy {luca.cagliero,
[email protected]}@polito.it
Abstract—Most engineering courses include fundamental practice activities to be performed by students in computer labs. During lab sessions, students work on solving exercises with the help of teaching assistants, who often have a hard time for guaranteeing a timely, optimized, and “democratic” support to everybody. This paper presents a learning environment to improve the experience of the lab sessions participants, both the students and the teaching assistants. In particular, the environment was designed, implemented, and experimented in the context of a database course. The application designed to support the learning environment stores all the events occurring during a SQL practice lab, i.e., task progression, query submissions, error feedback, assistance requests and interventions, and it provides information useful both for use on-the-fly and for later analysis. Thanks to the analysis of these data, the application dynamically provides teaching assistants with a graphical interface highlighting where assistance is most needed, by considering different factors such as the progression rate, the percentage of correct solutions, and the difficulties in solving the current exercise. Furthermore, the stored data allow teachers later on to analyze and to interpret the behavior of the students during the lab, and to have insights on their main mistakes and misconceptions. After describing the environment, the interfaces, and the approaches used to identify the students’ teams that need timely assistance, the paper presents the results of different analyses performed using the collected data, to help the teacher better understand students’ educational needs.
I. INTRODUCTION Engineering curricula strongly rely on lab activities, where student can test, practice, and improve their learning achievements. Computer labs, specifically, require students to solve programming tasks working alone or in a team, with the support of teaching assistants in a controlled environment. Large universities, with a high number of enrolled students and a low teacher per student rate, often have to face a big challenge to ensure everybody a valuable computer lab experience. In our university, B.S. computer science courses have an average number of 240 enrolled students, and each lab session has about 80 participants. Computer labs have 40-60 computers, and in general only 2 or 3 teaching assistants are available to help students during their tasks. In these conditions, students’ experience is far from optimal, and this is reflected by the progressive decrease of lab participation during the course semester: the number of students that take part to the
Teodoro Montanaro Istituto Superiore Mario Boella Torino, Italy
[email protected]
last computer lab session is generally less than half of the number of students that participated in the first one. In such a context, students who have trouble in solving their tasks are often stuck waiting to get the teacher assistants’ attention. On the other hand, teachers are often overwhelmed by many assistance requests and sometimes cannot guarantee adequate timely help to everybody. Besides, students’ attitude can play an important role [1]: shy students tend not to ask for help even if they are in trouble, while others keep calling for assistance without even trying to solve problems autonomously. The research presented in the paper aims at providing teaching assistants with an environment to support their task during computer science lab sessions. Specifically, we designed, implemented, and experimented a tool for SQL practices in lab that: • anonymously records students’ activities on all lab workstations; • records students’ requests for assistance, and teachers’ assistance events; • interprets activities and assistance requests in order to understand the performance level of the students, and specifically to extract the “difficulty level” they experience at any time; • provides assistants with a dynamic comprehensive overview of the difficulty levels of every workstation with a simple “color status” interface, by suggesting where assistance is most needed; • provides assistants with a detailed graphical view for each of the workstations, to highlight the reason why assistance is needed (e.g., many wrong tentative solutions, inactivity periods, …) The idea behind this research is to provide teaching assistants with an optimized, prioritized, and “democratic” way for giving assistance to students, through an informed environment where they can easily spot who is more in trouble according to objective parameters (and not simply by raised hands). This research, furthermore, has a second objective: the recorded session data can be analyzed afterwards to extract useful information about students’ behavior during SQL lab sessions, and about the most common mistakes and misunderstandings. Such an analysis provides an important feedback that teachers can exploit in future classroom lectures. The remainder of the paper is organized as follows. Section II provides a discussion on the related works. Section III describes the designed environment, with a focus on the SQL lab experiment and on the teaching assistant interface, while
Section IV reports the analysis of the collected data, focusing both on students’ experience and behavior during the lab, and on educational aspects related to the database course topics. Finally, Sections V draws the conclusions and highlights challenges and future perspectives of this work. II. RELATED WORK Supporting students in learning the SQL language is an established learning problem. For example, Mitrovic [2] proposed a tutoring system for guided SQL learning. The architecture of the proposed system is focused on a constraintbased model, which supports students in learning from errors by providing them with targeted hints. The SQLator Webbased interactive tool for learning SQL has been proposed in [3]. SQLator integrates an advanced function, based on a heuristic algorithm, to allow users to evaluate the correctness of their query formulation. In [4] the authors investigated the use of iconic metaphors in a higher level query language similar to SQL. The goal was to help users to learn and comprehend the relational data model. More recently, the focus has moved to the proposal of new learning analytics environments able to collect significant usergenerated data [5]. Learner-generated data can be used by professionals for the discovery of significant information. For example, the knowledge extracted from data acquired during SQL learning practices can help teachers and students to manage and monitor the teaching-learning process [6]. The learning environment proposed in this paper focuses on improving the interaction between students and teaching assistants during assisted SQL practices in lab. Unlike [5] and [6], the proposed environment relies on online monitoring and evaluation of the progress status of the SQL-based practice. It fosters effective student-teacher interactions based on the generation of specific alarms and on the graphical reporting of sequences of key activities performed by the students. Parallel efforts have been devoted to quantitatively evaluating the difficulties in learning the SQL language [7] [8] and to categorizing the most common semantic mistakes in writing SQL queries [9] [10]. Unlike the above-mentioned work, the focus of this research is neither on categorizing common mistakes nor on evaluating the complexity of SQL queries, but to support both students and teachers during SQL practice in lab. To analyze students’ interaction with the proposed learning environment, we categorized SQL query errors based on the categorization given in [9]. III. EDUCATIONAL CONTEXT AND EXPERIMENT SETTING The educational context for which the environment was designed, implemented, and experimented is the course on databases of the second year of the B.S. curriculum in Engineering and Management. This course has about 650 enrolled students, one of its main focuses is on the SQL language, and the lab activities involve SQL query exercises. The environment was then designed to support students in practicing SQL queries with the Oracle DBMS [11]. It was tested in this specific course, but a database course is present in all the curricula in Engineering, and therefore is it highly reusable, with a potential number of 4,000 students every year. During the 90-minutes weekly lab sessions, students are divided in 6 groups. The computer lab has 43 workstations
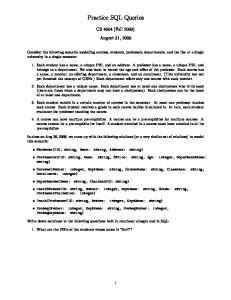
with one or two working students (sometimes even three), and three teaching assistants provide students’ support. The lab session involved in this experiment was the second one, so that most students were already familiar with the type of practice to be completed. The task was to perform 13 SQL query exercises of medium complexity. Past years’ experience showed that practically nobody was able to complete all the exercises, and most of the teams finish 6 or 7 of them. In these cases, students are strongly encouraged to finish the task later in autonomy. A. Learning environment rationale and description The developed learning environment, whose architecture will be detailed in subsection II.B, has been designed to support and record the students’ activities while solving the 13 proposed SQL exercises. Students’ interface (see Figure 1) proposes one exercise at a time, with the problem statement, the associated database schema and the table representing the correct results. The students enter their tentative query and the Oracle DBMS executes it, providing the feedback that is shown to the learners. Besides the Oracle message (useful for understanding query errors), when the query is syntactically correct the environment compares the expected result with the executed result.
Fig. 1. Students’ interface.
In addition, the interface allows teams to send a help request to the teaching assistants. The request will be displayed as an orange bell close to the requesting workstation icon (see subsection II.C) on the assistant interface. The environment stores a number of event-related data in its database during each lab session, and precisely for every workstation: • the text of every query submission, with the relative timestamp and the associated exercise identifier; • the associated feedback message (i.e., correct query, Oracle message in case of syntactical error, application error in case of result error); • the progressive number of the current exercise attempt (e.g., attempt 3 for exercise number 5); • the requests for assistance, with the relative timestamp;
•
the timestamps relative to the start and the end of every assistance intervention. Thanks to these data, it is possible to extract useful information for interpreting the status of the students’ teams, and specifically for understanding how confident and performant they are, and whether they need extra support. Each workstation is dynamically assigned a color status (green, yellow, or red) that reflects the positive/negative performance according to a number of factors computed from the collected data: 1) The current exercise number, compared to the modal value of the current exercise numbers of all the workstations; this factor takes into account the relative progress of the students, and identifies the teams that are far slower than the average, i.e., that are potentially in trouble. 2) The percentage of correctly solved exercises: the students’ interface, in fact, allows students to skip an exercise and to proceed to the next one; this factor takes into account the unsuccessful attempts and it is related to the perceived complexity of the exercises. A low percentage of correctly solved exercises definitely identifies teams that need extra support. 3) The time devoted to the current exercise; this factor is useful for timely identifying teams that have problems in solving a specific exercise. 4) The number of unsuccessful query submissions for the current exercise; like the previous one, this factor identifies problems related to a specific exercise, independently of the performance in the previous ones. The color status depends on the values of these factors, combined in three components that are independently evaluated as “Good (G)”, “Average (A)” and “Bad (B)” and then weighted to produce a single value mapped to one of the three colors. The three components are: A. Current exercise status. It depends on factors 3) and 4) and specifically is: • GA (Good) if ((t < 5 min) AND (NA < 4) OR (NA < 1)), i.e., the current exercise status is considered good if the team has been working on it for less than 5 minutes and the unsuccessful query submissions (NA=number of attempts) are less than 4, or if there are not query submissions yet (inactivity); • AA (Average) if ((5 min 8 min) AND (NA >= 1), i.e. the current exercise status is considered average if the team has been working on it more than 8 minutes, and the unsuccessful query submissions are at least 1; Timing has been chosen by considering the average time required for solving the proposed exercises, thanks to the experience of previous years’ lab sessions. The results discussed in Section IV will be used for an optimized timing choice in future
experiments, according to actual students’ average behavior for each exercise. B. Past exercises status. It depends on factor 2) and specifically is: • GB (Good) if (SE > 85%), where SE = percentage of correctly solved exercises, i.e., the past exercise status is considered good if the team has correctly solved more than 85% of the proposed exercises; • AB (Average) if (70% = 0.55, Yellow if 0.45 < CT < 0.55, and Red if CT