Color profile: Disabled Composite Default screen
2727
Improving the precision of the daily egg production method using generalized additive models D.L. Borchers, S.T. Buckland, I.G. Priede, and S. Ahmadi
Abstract: Generalized additive models (GAMs) are used to model spatial variation in egg density and increase the precision of biomass estimates from the daily egg production method. Application of GAMs to survey data from the western mackerel (Scomber scombrus) and horse mackerel (Trachurus trachurus) stocks result in a substantial reduction in coefficients of variation of egg abundance. In developing GAM methods for the daily egg production method, we generalize Pennington’s method, in which presence–absence is modelled separately from nonzero observations, and use a new form of the bootstrap that accommodates clustered count data without requiring explicit modelling of the form of clustering. In addition to increasing estimation precision, the use of GAMs has several advantages over stratified sample survey methods. To a large degree they allow the data to determine the form of functional dependence of the response on explanatory variables; they accommodate a wide variety of forms of stochastic variation of the response; they provide maps of the predicted density within the survey area; they provide an objective means of interpolating into unsampled areas; and estimation does not assume random sampling with respect to location. Résumé : Des modèles additifs généralisés (GAM) servent à modéliser la variation spatiale de la densité des oeufs et à accroître la précision des estimations de la biomasse à partir de la méthode de production quotidienne des oeufs. L’application de GAM à des données fournies par des relevés des stocks occidentaux de maquereau (Scomber scombrus) et de chinchard (Trachurus trachurus) entraîne une diminution substantielle des coefficients de variation de l’abondance d’oeufs. En développant des GAM pour la méthode de production quotidienne des oeufs, nous généralisons la méthode de Pennington dans laquelle la présence (ou l’absence) est modélisée séparément des observations non nulles, et nous utilisons une nouvelle forme de bootstrap qui permet d’intégrer les données de dénombrement en grappes sans qu’il soit nécessaire de modéliser explicitement la forme de la répartition en grappes. En plus d’accroître la précision des estimations, l’utilisation des GAM comporte plusieurs avantages par rapport aux méthodes d’échantillonnage stratifié. Les GAM permettent aux données de déterminer dans une large mesure la forme de dépendance fonctionnelle de la réponse à l’égard des variables explicatives; ils s’adaptent à une grande variété de formes de variation aléatoire de la réponse; ils permettent d’obtenir des cartes de la densité prédite pour la région étudiée; ils constituent un moyen objectif d’interpoler pour des régions non échantillonnées; enfin, l’estimation ne présuppose pas que l’échantillonnage est aléatoire en ce qui concerne l’emplacement. [Traduit par la Rédaction]
Introduction Atlantic mackerel (Scomber scombrus) and horse mackerel (Trachurus trachurus) are widely distributed over the European continental shelf region of the Northeast Atlantic Ocean and support the largest fisheries in these waters. A large proportion of these fish spawn along the continental shelf west of the British Isles and France and for management purposes are known as the “western” stocks of these two species. Both species are pelagic spawners that release planktonic free-floating Received February 6, 1996. Accepted February 27, 1997. J13288 D.L. Borchers1 and S.T. Buckland. Research Unit for Wildlife Population Assessment, University of St. Andrews, Fife, KY15 9SS, Scotland, U.K. I.G. Priede. Department of Biology, Tillydrone Avenue, University of Aberdeen, Aberdeen, AB9 2TN, Scotland, U.K. S. Ahmadi. Biomathematics and Statistics Scotland, Mccaulay Land Use Research Institute, Craigiebuckler, Aberdeen, AB9 2QJ, Scotland, U.K. 1
Author to whom all correspondence should be addressed. e-mail:
[email protected]
Can. J. Fish. Aquat. Sci. 54: 2727–2742 (1997)
F97-134.CHP Fri Feb 20 08:52:32 1998
eggs into the surface layers of the ocean. The size of the spawning stocks can therefore be estimated from plankton surveys of egg production. There are two primary methods available (Gunderson 1993; Hunter and Lo 1993), namely the annual egg production method (AEPM) and the daily egg production method (DEPM). With the AEPM, estimated egg production is integrated over the whole annual spawning season using data from a series of surveys. The AEPM has been applied triennially to the western mackerel since 1977 (Lockwood et al. 1981; Lockwood 1988) and to the horse mackerel since 1989 (Anonymous 1991). The DEPM was originally developed for anchovies (Lasker 1985). Ideally it combines a plankton survey at a given time, to estimate daily egg production, with a simultaneous survey of adult fish, to estimate spawning fraction and batch fecundity in the population (Hunter and Lo 1993; Gunderson 1993). The DEPM was first applied to western mackerel in 1989 (Watson et al. 1992). In this paper we consider only the DEPM, which has been applied with some success to estimation of the abundance of the western mackerel and horse mackerel from the 1989 and 1992 fish and egg surveys of these stocks. Imprecision in estimating egg abundance was found to be the primary source of imprecision in the biomass estimate for the western mackerel © 1997 NRC Canada
Color profile: Disabled Composite Default screen
2728
stock in 1989, accounting for over 60% of the variance. As a result the surveys were partially redesigned to improve the precision of the egg abundance estimate from the 1992 survey (Anonymous 1993). Despite these changes, the egg abundance estimate remained the major source of imprecision in the 1992 survey both for mackerel and for horse mackerel. Imprecision in the egg abundance estimate contributed 60% of the variance in the mackerel abundance estimate and 70% of the variance in the horse mackerel abundance estimate in the case of the 1992 survey (Anonymous 1994). More precise estimation of egg abundance was therefore clearly the most effective way of increasing the overall precision of the fish biomass estimates. In this paper we concentrate on using generalized additive models (GAMs; Hastie and Tibshirani 1990) to improve the precision of the egg abundance estimate. In principle, GAMs could also be applied to improve estimation of the adult parameters used in the DEPM, but we do not do this here. It is common for fish stocks to show substantial spatial variation in abundance. If such variation is not modelled when estimating biomass, it becomes “unexplained” variance. To the extent that it is possible to model the spatial variation parsimoniously, it is possible to reduce the unexplained variance and improve the precision of biomass estimates. A variety of methods has been used in the past to model spatial variation of marine species. Foote and Stefánsson (1993) give a useful review of methods applied to date. Their paper concentrates on acoustic surveys, but the types of methods they review have general applicability. Of course, modelling need not be confined to the spatial dimensions alone. Abundance may vary in response to oceanographic or environmental variables as well, and similar gains in estimation precision are possible. Both mackerel and horse mackerel range widely in their migrations over the continental shelf, but at spawning time, adults of the western stocks move to the shelf-edge region. It is biologically reasonable to assume that some of the variance in spawning distribution can be explained in terms of environmental cues that might influence fish behaviour. The potential gains from modelling the spatial variation in egg abundance for these two stocks have long been recognised, and both the survey design and the estimation methods used to date are partly model based rather than purely design based. The survey is highly stratified; the lowest level of stratification is at halfdegree resolution. Sample points are located systematically within half-degree strata, with increased survey effort in strata where high egg densities are expected. Rather than treating the egg numbers in the survey region as fixed, with all the variance in observed values arising from the sampling design (as in a purely design-based approach), observed egg numbers have been modelled in the past as lognormal random variables with means that may vary between half-degree strata (Pope and Woolner, 1984). The intense (half-degree) stratification of the survey area allows relatively small-scale trends in abundance to be modelled without making strong assumptions about the form of the trend, but this is at the expense of some precision since a large number of parameters must be estimated (one mean per half-degree stratum). This stratified approach is robust insofar as it is sufficiently flexible to accommodate a wide variety of forms underlying trend in egg abundance without bias. The primary innovation of this paper is in the application of smooth functions (via GAMs) that are sufficiently flexible to capture the trends in egg density without strong assumptions
Can. J. Fish. Aquat. Sci. Vol. 54, 1997
about the form of the trends, while using substantially fewer parameters than the stratum-based approach. To a large degree, GAMs allow the data to determine the shape and degree of flexibility of the modelled trends, and like the stratified approach used previously, they are able to accommodate a wide variety of forms of underlying trend in egg abundance. We use GAMs to model trends in abundance as functions of position as well as oceanographic/ or environmental variables. As far as we are aware there are only three applications of GAMs for estimating the abundance of a fish stock to date. Swartzman and Huang (1992) had some success in improving the precision of the estimates of abundance for a number of groundfish species in the Bering Sea using GAMs on trawl survey data from a number of years. Swartzman et al. (1994, 1995) applied GAMs to acoustic survey data of walleye pollock (Theragra chalcogramma) in the Bering Sea, again using data from a number of annual surveys. A primary aim of these studies seems to have been drawing inferences about the environmental factors driving the observed trends in density. In contrast, our overriding aim is the estimation of fish biomass in the survey region at the time of the survey, and we achieve this by using the DEPM with survey data from a short period in a single year. We model the realized distribution of eggs at the time of the survey, rather than its long-term distribution. The mechanisms giving rise to this realized distribution are not of primary interest. For example, it may be that the realized distribution was partly determined by spatial correlation in spawning rather than by spawning in response to environmental variables, but if the realized distribution can be adequately modelled in terms of environmental variables, this satisfies our requirements. We are concerned with obtaining a good empirical model for the distribution of eggs at the time of the survey, not with the long-term factors determining egg distribution nor with the long-term correlation structure of the egg distribution. Were the longer term correlation structure of the egg population a major concern, co-kriging might be an appropriate alternate method.
Methods GAMs provide a particularly powerful means for modelling variation in egg density as a function of explanatory variables. They accommodate continuous functional forms of almost any shape, and to a large degree they allow the data to determine the most suitable shape to use. They also accommodate a wide variety of forms of stochastic variation of the response. (GAMs include generalized linear models as a special case.) The DEPM Before describing these GAM methods in more detail we outline the DEPM, albeit in only the most general terms. The essentials of the method are summarized in the following equation: Bˆ =
Pˆ 0 FˆSˆRˆ
where Bˆ is the estimated spawning stock biomass, Pˆ0 is the estimated daily egg production, Fˆ is the estimated batch fecundity per unit female body weight (number of eggs per gram of female fish), Sˆ is the estimated fraction of female fish that spawn per day at the time of the survey, and Rˆ is the estimated fraction of fish that are female. Each of these quantities and their associated variances are estimated independently: P0 from egg survey data and the adult fish parameters (F, S, R) from a fish trawl survey (which is ideally simultaneous with the © 1997 NRC Canada
F97-134.CHP Fri Feb 20 08:52:36 1998
Color profile: Disabled Composite Default screen
2729
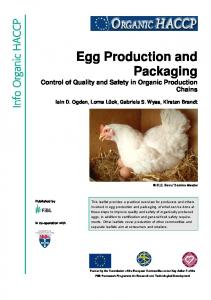
Borchers et al. Fig. 1. Location of egg samples in the survey area. The high-density sampling in the south are samples taken by Spain with a CalVET vertical tow sampler. The broken line is the 200-m depth contour.
egg survey). The DEPM survey was carried out using ships from Scotland, Ireland, England, France, The Netherlands, and Spain. Plankton samples were taken using Gulf III type high-speed samplers (Gehringer 1952; Bridger 1958) which were towed at 5 knots (1 knot = 1.853 km/h) in a double oblique pattern down to a maximum depth of 200 m and back up to the surface. Spanish vessels working in the south of the survey area used a CalVET type vertical tow net (Lasker 1985). The volume filtered by both types of samplers was monitored using flow meters. The volume filtered by CalVET net on each tow was smaller than for the Gulf III sampler, and the number of tows carried out by the Spanish vessels was greater. Eggs were sorted to species and staged; results were converted to number of stage-I eggs per square metre of sea surface. For the western mackerel and horse mackerel stocks, P0 is estimated from the observed stage-I eggs only, ignoring natural mortality. While this yields a negatively biased estimate of the daily egg production because eggs are subject to natural mortality while they are in stage-I, it is the convention for assessment of these stocks. We adhere to this convention for comparability of our results with those obtained by conventional methods. (Priede and Watson (1993) give some rationale for the conventions.) From each trawl, 30 adult female fish were sampled for examination of the ovaries. The fish destined to spawn on a given day (24-h period) were recognised from the presence of migratory nucleus stage oocytes in histological sections of the ovaries (Priede and Watson
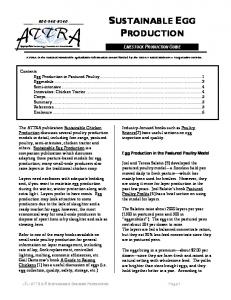
Fig. 2. Location of pelagic trawl hauls for fish samples in the survey area.
1993). The daily spawning fraction (S) was estimated by the proportion of females with ovaries in this state. Batch fecundity was estimated by counting the number of hydrated oocytes in ovaries that were found to be in a state of imminent ovulation, using the methods described by Watson et al. (1992). The delta method (Seber 1982) is conventionally used to estimate the coefficient of variation (CV) of spawning stock biomass: CV2 [Bˆ] = CV2 [Pˆ0] + CV2 [Fˆ] + CV2 [Sˆ] + CV2 [Rˆ] The sampling methods used for the 1992 survey of western mackerel and horse mackerel are described in Anonymous (1993). The distribution of sampling effort for the egg survey is shown in Fig. 1, while that for the fish survey is shown in Fig. 2. Estimating F, S, and R GAMs could be used to estimate the adult fish parameters F, S, and R. However, in the case of the western mackerel and horse mackerel stocks, estimation of P0 contributes most to the variance of the biomass estimate so that the precision of the biomass estimate is most effectively improved by estimating P0 more precisely. Therefore, our efforts in modelling spatial variation have been directed at estimation of P0 in the first instance, and we have not attempted to use GAMs to estimate F, S, or R. Three latitudinal strata have historically been used in estimating the adult parameters (Figs. 3 and 4). While the exact location of the boundaries between the strata was decided upon on a partly ad hoc basis, the chosen strata are not unreasonable, in that © 1997 NRC Canada
F97-134.CHP Fri Feb 20 08:52:58 1998
Color profile: Disabled Composite Default screen
2730 Fig. 3. Observed mackerel egg densities (eggs/m2) averaged within each half-degree block in the survey area. Unshaded half-degree blocks were not sampled. The horizontal lines at 51 and 55°N are divisions between the three latitudinal strata.
historical survey data indicate north–south variation in some adult parameters and in egg density. However, the strata are sufficiently broad that there remains substantial spatial (and possibly other) variation within strata. For comparability of the biomass estimates with previous estimates for these stocks, we have retained the stratified approach to estimating F and S; we have assumed R to be 0.5 with zero variance, as has been done in the past; and we present results for each of the latitudinal strata. These methods are described in Anonymous (1993). They are incidental to the main results of this paper, and we do not expand on them here. Estimating P0 To date the methods adopted for estimating egg density of the western mackerel and horse mackerel stocks have modelled egg density as step functions of latitude and longitude only (Anonymous 1993, 1994). This was achieved by stratification, using the same latitudinal strata as are used for estimation of the adult parameters, but with half-degree latitudinal by half-degree longitudinal secondary strata within these. A lognormal distribution was assumed for egg abundance within half-degree strata, and a common CV was assumed within latitudinal strata (Pope and Woolner 1984). Within the context of stratified estimation, two methods were adopted in the past for estimating egg abundance. The method of Pope and Woolner (1984) was used in the analysis of the 1989 survey data (Anonymous 1991). It combines a nonparametric estimator of mean
Can. J. Fish. Aquat. Sci. Vol. 54, 1997 Fig. 4. Observed horse mackerel egg densities (eggs/m2) averaged within each half-degree block in the survey area. Unshaded half-degree blocks yielded zeros or were not sampled. The horizontal lines at 48 and 51.5°N are divisions between the three latitudinal strata.
egg abundance with a variance estimator that is based on the assumption of lognormally distributed egg densities, with constant CV over all half-degree strata within a stratum. To apply the method when zero eggs are obtained, a small amount is added to observed egg densities for variance estimation. This introduces a degree of arbitrariness into the variance estimate, because the size of the amount added is arbitrary and can affect the resulting estimates substantially. As a result a method developed by Pennington (1983) was adopted in 1993 in place of that of Pope and Woolner (1984). The distinguishing feature of the method is that it treats zero observations differently from nonzeros. Pennington (1983) adapted the ideas of Aitchison (1955) to the fish survey context. Its application was investigated for the AEPM for western mackerel by Pope and Woolner (1984). The method circumvents the problem created by zero egg samples by separating estimation into two components: estimation of the probability of obtaining a zero and estimation of the mean number of eggs, given that a nonzero observation was obtained. This method assumes that the probability of obtaining a zero observation is constant within each stratum; presence–absence is assumed to have binomial variance. Estimating P0 using generalized additive models Rather than stratifying the survey area and using either of the above methods, we use GAMs to model the spatial and other trends in egg abundance. GAMs have the following general form. © 1997 NRC Canada
F97-134.CHP Fri Feb 20 08:53:48 1998
Color profile: Disabled Composite Default screen
2731
Borchers et al. Fig. 5. Schematic representation of the GAM estimation procedure for mackerel. Unshaded boxes correspond to the point estimation procedure; shaded boxes correspond to the bootstrap procedure.
E[y] = f(βo + Σi si (xi)) Here xi represents the ith explanatory variable and y is the response of interest (egg numbers in this case), which has some specified statistical distribution whose expectation (E(y)) is a function (f(•)) of the explanatory variables. The function f(•) is the inverse of the “link function.” The candidate link functions for this analysis are those available for generalized linear models. βo is a parameter to be estimated, and the functions si (•) are smoothing functions for the explanatory variables. Here we use smoothing splines for si (•), although
other smooths might be equally applicable. The flexibility of the smoothing splines is summarized in their associated df; the fewer df, the less flexible the function. For example, generalized linear models (GLMs) have si (xi) = βi xi, with df = 1. (See Hastie and Tibshirani (1990) for more details.) A log link, which implies that explanatory variables (or their smooths) have a multiplicative effect on egg density, was found to be adequate for the data modelled here. With this link function, f(•) = exp(•). Inference with GAMs is conducted in the same way as it would be with GLMs, although the theoretical basis for inference with the © 1997 NRC Canada
F97-134.CHP Fri Feb 20 08:54:15 1998
Color profile: Disabled Composite Default screen
2732
Can. J. Fish. Aquat. Sci. Vol. 54, 1997
Fig. 6. Shapes of the smooths, s(•), for the smoothed variables used in the mackerel GAM. Zero on the vertical axes corresponds to no effect of the explanatory variable. The broken lines correspond to 95% confidence limits for the smooth. Ticks on the x axis indicate the locations of observations.
former is less well developed than that for the latter. Model selection is more complicated than with GLMs, largely because, in addition to selecting which variables to include in the model, one must simultaneously decide how smooth to make the smoothing splines. To reduce the model selection problem to manageable proportions, we considered only smooths with df equal to 1 (which correspond to GLMs with a linear term for each covariate) or df approximately equal to 4, and we considered only linear interactions. For a given link function and error distribution, model selection was performed in the following steps. (1) Decide which covariates to include. Set df = 1 for the smoothing splines for all covariates (without interactions) and decide on which covariates should be included by backward stepwise selection. (2) Decide whether smooth is necessary. For the covariates selected above, do backward stepwise selection in which the comparison at each step is between the fit with a covariate with a smoothing spline with df = 4 and one with df = 1. (3) Decide on interactions. Include all first-order linear interactions in the model selected in the two steps above and do backward stepwise selection on the interactions. A variety of error distributions and link functions was considered. The choice of the most appropriate link function and error distribution was made on the basis of residual plots. A log-link function was found to be adequate in all cases, but different error distributions were required for different data sets, as described below. The covariates available for inclusion in the model (with their abbreviations in brackets) are latitude (Lat), longitude (Lon), bottom depth in metres (Bdp), sampling depth in metres (Sdp), sea-surface temperature in degrees Centigrade (Tmp), temperature at 20 m depth
in degrees Centigrade (T20), salinity (Sal), date of sampling (Dat), time of sampling (Tim), Country or vessel which took the sample (Cou), distance from the 200-m contour in metres (D200), and gradient (Gra). (This is an approximation to the true gradient of the ocean floor in the direction of the 200-m contour at each sampled point.) Once a model has been selected and its parameters estimated, it provides a surface spanning the survey area, with peaks at points of high egg density and troughs at points of low density. The expected egg density at any point in space is obtained by evaluating the fitted surface at that point. An estimate of total egg abundance in the survey area is obtained by integrating the surface over the whole survey area. Analytic estimation of the variance of the abundance estimates obtained from the GAMs is not feasible, and we have used bootstrap methods to estimate variances and obtain confidence intervals. Details of the estimation and bootstrap procedures are given below. Different types of model were required for the mackerel and horse mackerel data. This is not surprising when one considers the differences in the observed distribution of eggs for the two species (Figs. 3 and 4). At the time of the survey, mackerel eggs are found throughout the survey region, whereas horse mackerel eggs are concentrated in the south and are entirely absent in samples from vast areas of the centre and north. This is because the survey occurred relatively early in the horse mackerel spawning season, and spawning fish had not yet moved into the central and northern regions in large numbers. We found models that attempted simultaneously to fit the large areas of zeros and the nonzero observations to be inadequate; they resulted in relatively poor fits to both zeros and nonzeros. However, modelling the presence–absence of horse mackerel eggs separately from the density of eggs where eggs were present resulted in satisfactory fits. Therefore, the type of model used for mackerel is qualitatively © 1997 NRC Canada
F97-134.CHP Fri Feb 20 08:54:35 1998
Color profile: Disabled Composite Default screen
Borchers et al. different from that used for horse mackerel. While both involve GAMs, each has interesting features not present in the other. The mackerel model involves only one GAM and is the simpler of the two. An interesting component of the estimation procedure, which is not present in the case of horse mackerel, is the method by which extra-Poisson variation is incorporated into the bootstrap variance estimation procedure. Overdispersion is common in biological count data as a consequence of clustering in space, and variance estimates are biased if the overdispersion is ignored. The bootstrap method implemented for mackerel is an elegant method for incorporating the overdispersion in variance estimation without making strong assumptions about the precise form of the clustering. A central feature of the horse mackerel analysis that does not occur in the case of mackerel is the separation of estimation into a component for the presence of eggs on the one hand and one for egg density given presence on the other. The widespread occurrence of zeros in this particular data set is not atypical of multispecies fish and plankton survey data. The compromises involved in simultaneously sampling species with different habits frequently leads to designs that are not optimal for one or more surveyed species. In these circumstances, large regions of zero observations may be unavoidable. Pennington’s (1983) method was designed with this in mind. The model used here for horse mackerel represents a generalization of Pennington’s (1983) method in that it allows both the probability of presence and the density given presence to vary as functions of spatial and oceanographic or environmental variables.
2733 Fig. 7. Fitted mackerel egg densities (eggs/m2) averaged within each half-degree block in the survey area.
Estimation procedure and results: mackerel The procedure for estimating mackerel egg abundance involves model selection and estimation for a single GAM, followed by integration of the resulting egg density surface over the whole survey region. This gives an egg abundance estimate that is combined with estimates of adult fish parameters to yield an estimate of spawning stock biomass. Variance is estimated by resampling parametrically from the fitted model 700 times and repeating the estimation procedure (without reselecting the model) on each of the resampled data sets. This procedure is described diagrammatically in Fig. 5. The model selected A GAM with log-link, overdispersed Poisson error structure (i.e., variance proportional to mean) and an offset parameter equal to the natural logarithm of the effective surface area sampled was found to be an adequate model for the egg count data. The “effective surface area” is the volume of water passing through the net divided by the sampling depth, and the offset allows the model to adjust for the different effective surface areas sampled when modelling the count data. (Those unfamiliar with overdispersion and the use of offsets in this context can find a brief discussion of the concepts in McCullach and Nelder (1989).) The eggs were substantially overdispersed compared with a Poisson distribution; the dispersion parameter was estimated to be 9.8. This is consistent with a situation in which eggs occur in clusters rather than randomly dispersed over the sea. The overdispersed “Poisson” error structure model assumes the variance to be proportional to the mean. This provided a better model for the distribution of the observed counts than the error model used with the method of Pope and Woolner (1984), which assumes the SE to be proportional to the mean (i.e., constant CV). Smoothing splines of four covariates and three first-order
interactions were chosen by the model selection algorithm described above. The four smoothed main effects were those for Lat, Lon, BDp, and D200, while the three significant firstorder interactions were those between Lat and each of Lon, BDp, and D200. The modelled egg densities show a strongly nonlinear dependence on the explanatory variables (Fig. 6). Unlike GAMs, linear models and GLMs are likely to have difficulty adequately modelling such nonlinear dependence. In interpreting the plots of Fig. 6, one should note that it is the conditional effect of the variable that is being shown, given that the other variables are included in the model. For example, the peak in the latitude smooth at low latitude does not correspond to the area of highest density because the ocean is deep in this area, and from the bottom depth smooth, one sees that a deep bottom is associated with low egg densities in the model. A comparison of the observed egg densities (Fig. 3) and the densities predicted by the model (Fig. 7) indicates that the model has captured the spatial variation in mackerel egg density fairly well. Although no formal tests of randomness have been performed on the residuals, plots of the residuals in space do not indicate substantial spatial correlation. (Independence of residuals is assumed in the bootstrap procedure, which would yield negatively biased estimates of variance were there substantial unmodelled correlation.) © 1997 NRC Canada
F97-134.CHP Fri Feb 20 08:55:00 1998
Color profile: Disabled Composite Default screen
2734
Can. J. Fish. Aquat. Sci. Vol. 54, 1997
Fig. 8. Diagrammatic representation of the resampling algorithm used to generate overdispersed Poisson variates for the mackerel bootstrap procedure. (a) Step I. Construction of the empirical cumulative distribution function (CDF). Each observed response (y) is transformed into an “observed” CDF value using the Poisson distribution with mean equal to the GAM fitted value at that point. (Overdispersion results in clustering of the “observed” CDF values towards 0 and 1, as indicated on the vertical axis.) The transformation is shown for two observations only. (b) Step II. Construction of a new sample from the empirical CDF. By resampling from the observed CDF values, new CDF values are generated for each of the sampled points. Each of these is then back-transformed using the Poisson distribution with mean equal to the GAM fitted value at that point to yield resampled ys. The back transformation is shown, for the same two observations as in Fig. 8a, for a case in which resampling resulted in exchanging the two associated CDF values.
The bootstrap procedure A parametric bootstrap was performed to estimate the variance of the abundance estimate. Each iteration of the bootstrap consisted of generating a pseudosample (described more fully below), refitting the selected model to this sample, and integrating under the newly fitted density surface to obtain an egg abundance estimate. Seven hundred bootstrap estimates were generated in this way. The variance of these estimates provided the variance estimate for the mackerel abundance estimate. Generating a pseudorandom sample requires the generation of overdispersed Poisson random variables at each sample
point, with mean equal to the modelled abundance at that point. We describe below the method used to do this, which was originally proposed in a different context by Bravington (1994). Consider first the simple case in which errors are independently and identically distributed. In this case a parametric bootstrap could readily be implemented by resampling from the residuals. The errors in the case of the mackerel model were not identically distributed, because the variance was modelled as being proportional to the mean, and the mean varied in space. In either case the predicted value ˆyi from our model, corresponding to observation yi, together with the © 1997 NRC Canada
F97-134.CHP Fri Feb 20 08:55:12 1998
Color profile: Disabled Composite Default screen
2735
Borchers et al. Table 1. Estimates by stratum of egg abundance (Pˆ 0), fecundity (Fˆ ), spawning fraction (Sˆ), and spawning stock biomass (Bˆ) of western mackerel.
Stratum
GAM Stratified Pˆ0 Pˆ0 Fˆ (×1012) (×1012) (eggs/g)
Northern
1.20 (0.18) [14.9] Middle 7.42 (0.34) [4.6] Southern 10.30 (0.50) [4.9] Total 18.92 (0.64) [3.4]
1.20 (0.56) [46.2] 9.19 (1.54) [16.7] 13.17 (1.69) [12.9] 23.56 (2.35) [10.0]
28.7 (2.7) [9.5] 47.4 (2.2) [4.6] 49.8 (4.4) [8.7]
Sˆ 0.467 (0.085) [18.1] 0.573 (0.055) [9.7] 0.480 (0.040) [8.4]
GAM Stratified Bˆ Bˆ (g, ×1011) (g, ×1011) 1.79 (0.45) [25.3] 5.46 (0.64) [11.7] 8.62 (1.12) [13.0] 15.87 (1.37) [8.6]
1.80 (0.91) [50.5] 6.86 (1.36) [19.9] 11.03 (1.95) [17.7] 19.69 (2.55) [12.9]
Note: Half of the fish are assumed to be female. Egg abundance and spawning stock biomass are shown for both the GAM estimation method and the previously used stratified method. Standard errors are shown in parentheses; %CVs are shown in square brackets.
assumed Poisson distribution, determines the estimated cumulative distribution function (CDF) of the observation, Yi. Evaluating the CDF at Yi = yi, gives ui, the associated CDF value. Now in the absence of overdispersion the uis would be approximately uniformly distributed on (0, 1). (The approximation arises because we estimated E[yi] by ˆyi.) We resampled the uis, by randomly sampling them with replacement and then back-transformed to generate the bootstrap sample of observations. Now, in the presence of overdispersion, the uis are not approximately uniform but, instead, are more likely to be close to zero or one. The above procedure preserves this overdispersion in the bootstrap resamples. Figure 8 illustrates the procedure for only two realizations of the fitted model for simplicity: one (the broken line) for a location of low egg density and the other (the dotted–broken line) for a location of high egg density. Overdispersion is shown by the clustering of the ui values of the sampled numbers towards 0 and 1. The following slight modification to the bootstrap procedure is required when the response yi is discrete. Instead of using ui = Fˆ(yi) (where Fˆ(yi) is the estimated CDF at yi), we choose ui at random from the interval ((Fˆ (yi – 1), Fˆ(yi)). Bravington (1994) discusses the modification in more detail. The estimates The GAM estimation method is very successful in improving the precision of the egg abundance estimate as well as that of the spawning stock biomass estimate (Table 1). Using a GAM in place of the stratified approach (reported in Anonymous 1993) reduces the CV of the egg abundance from 10 to under 4% and of the biomass estimate from 13 to 9%. The variance of the egg abundance estimate is reduced to the extent that it now contributes around 17% of the variance of the biomass estimate instead of almost 60% previously (Table 2). The biomass estimate is some 20% lower than that obtained using Pennington’s method. While this difference is quite large, it must be viewed in the context of a CV of some 13% from the stratified estimate. The difference is well within that which
Table 2. The percentage of variance in total estimated biomass contributed by each of the components of the mackerel biomass estimate when egg abundance is estimated using GAMs. Stratum
Egg nos.
Fecundity
Spawning fraction
Biomass
Northern Middle Southern Total
3.8 3.4 9.5 16.6
1.5 3.4 29.9 34.8
5.6 15.1 27.9 48.5
10.8 21.9 67.2 100.0
might be expected from random variation and does not in itself indicate that either estimate is biased. Part of the reason for the difference in point estimates is that different error structures are assumed in the two methods. The estimate from the stratified approach assumes a constant CV, but plots of residuals against fitted values indicates that this model for the error structure is inadequate and an overdispersed Poisson model is preferable.
Estimation procedure and results: horse mackerel Horse mackerel proved more difficult to model than mackerel, for two reasons. The first has already been mentioned. For a large part of the survey area, no horse mackerel eggs were observed (Fig. 4), and it was necessary to separate estimation into two parts. The probability of obtaining a zero observation was estimated first, followed by estimation of the mean number of eggs, given the presence of eggs. The second difficulty was that no single model adequately fitted the nonzero egg data from all the countries. The fact that Spain used vertical tows to sample eggs while all other countries used diagonal tows is thought to be at least partly responsible for the difficulty. Diagonal tows average out some of the small-scale spatial variation in stage-I egg density. Thus, counts from vertical tows are more dispersed than those from diagonal tows, and the assumption of a common dispersion parameter proved poor for horse mackerel eggs. This phenomenon was accommodated by modelling the nonzero data from Spain separately from the nonzero data from other countries. That is, three separate GAMs were used to model the horse mackerel egg densities, as follows. (The estimation procedure is illustrated diagrammatically in Fig. 9.) (i) Presence–absence Data were from all vessels, using a logit link with binomial distribution. Smooths of Lat and Tmp were selected, while Lon, Gra, and BDp were selected as linear terms. No interactions were selected. (ii) Spanish egg numbers, given presence Data were from Spain only, using log link, gamma distribution, and offset of ln(effective surface area sampled). Smooths of Lat, BDp, and Gra were selected, while Lon and Tim were selected as linear terms. No interactions were selected. (iii) Other countries’ egg numbers, given presence Data were from other countries only, using log link, gamma distribution, offset of ln(effective surface area sampled). Smooths of Lon and Tim were selected, while Lat, BDp, and Dat were selected as linear terms. No interactions were selected. Selection of the above models was performed using the © 1997 NRC Canada
F97-134.CHP Fri Feb 20 08:55:15 1998
Color profile: Disabled Composite Default screen
2736
Can. J. Fish. Aquat. Sci. Vol. 54, 1997
Fig. 9. Schematic representation of the GAM estimation procedure for horse mackerel. Unshaded boxes correspond to the point estimation procedure; shaded boxes correspond to the bootstrap procedure. Only one model for nonzero egg counts is shown to keep the representation simple. In practice there were two Model 2s: one for the Spanish nonzero data and one for the other nonzero data.
same algorithm as was used for mackerel. The SEs of the counts for the two nonzero count models were found to be approximately proportional to the mean (rather than proportional to the square root of the mean as was the case with the
mackerel data), and a gamma error model was used in preference to the Poisson model. The first of the above models yields a fitted surface whose height at any point corresponds to the estimated probability © 1997 NRC Canada
F97-134.CHP Fri Feb 20 08:55:47 1998
Color profile: Disabled Composite Default screen
Borchers et al.
2737
Fig. 10. Observed presence–absence for horse mackerel by half-degree block. The value shown for each block is the proportion of nonzero samples in the block.
Fig. 11. Fitted presence–absence probabilities for horse mackerel by half-degree block. The value shown for each block is the average of the fitted presence probability surface in the block.
that at least one egg would have been sampled at that point at the time of the survey. A comparison of the observed presence– absence data (Fig. 10) and the modelled probability of presence (Fig. 11) indicates that the GAM has been largely successful in modelling the spatial variation in probability of presence. The second and third models yield fitted surfaces of nonzero egg abundance for those points sampled by Spain and by other countries, respectively. Again, the GAM has been largely successful in modelling the spatial variation in egg density. The conditional effects of the smoothed covariates for each of the three models (Figs. 12–14) indicated nonlinearities that linear or generalized linear models would have had difficulty fitting adequately. Note that although the Tim is not cyclic, models that incorporated a cyclic transformation of Tim using the cosine function yielded marginally worse fits than the model presented here. The differences between these models has very little effect on the abundance estimates, and in view of this, we have chosen to use untransformed Tim in the model. The marginal effects of the covariates entering the models linearly are summarized in the t statistics for the associated coefficients presented in Table 3. This table together with the estimated smooths (Figs. 12–14) indicates that spatial
covariates and ocean depth are important explanatory variables for all three models; Lat, Lon, and BDp enter all three models either as smooths or as linear effects with high significance (indicated by the t statistics). The predicted egg densities are given by the product of the GAM surface corresponding to predicted probability of presence in the sample and the appropriate GAM surface for predicted egg abundance given presence (Fig. 15). There is a small area in which the surfaces for nonzero eggs of Spain and the other countries overlap. In this area only the fitted surface from the other countries was used for abundance estimation. Abundance is estimated by integrating over this surface within the survey area. The bootstrap procedure A parametric bootstrap with two “levels” (one generating presence–absence data, the other generating numbers given presence) was used to estimate the variance of the abundance estimate. Unlike the situation with mackerel, generating pseudosamples of egg numbers with the required distribution can be done using standard parametric bootstrap methods. A presence–absence random variable was generated from a Bernoulli distribution with mean equal to the estimated probability © 1997 NRC Canada
F97-134.CHP Fri Feb 20 08:56:35 1998
Color profile: Disabled Composite Default screen
2738
Can. J. Fish. Aquat. Sci. Vol. 54, 1997
Fig. 12. Shapes of the smooths, s(•), for the smoothed variables used in the horse mackerel presence–absence GAM. Zero on the vertical axes corresponds to no effect of the explanatory variable. The broken lines correspond to 95% confidence limits for the smooth. Ticks on the x axis indicate the locations of observations.
Fig. 13. Shapes of the smooths, s(•), for the smoothed variables used in the horse mackerel GAM for Spanish nonzero observations. Zero on the vertical axes corresponds to no effect of the explanatory variable. The broken lines correspond to 95% confidence limits for the smooth. (Note that these lines do not cross; the confidence interval is just narrow in the region of BDp = 200 m.) Ticks on the x axis indicate the locations of observations.
of presence at each sampled point; gamma random variables with means equal to the estimated mean at each sample point and CV equal to that estimated from the original data were generated using an algorithm developed by Ahrens and Dieter (1974). The bootstrap variance estimation procedure iterated through the following procedure 700 times (Fig. 9). The variance estimate is obtained from the resulting 700 abundance estimates. (l) Generate independent binomial (presence–absence) variates for each sample point, using the original fitted
presence–absence model. Wherever absence is generated, set the corresponding egg numbers to zero. (2) Where presence was generated, independently generate egg numbers for each point. If the point is one originally sampled by Spain only, generate an egg number from the original fitted gamma distribution for Spain. If the point is one originally sampled by another country, generate an egg number from the original fitted gamma distribution for other countries. (3) Refit the presence–absence model to the presence–absence © 1997 NRC Canada
F97-134.CHP Fri Feb 20 08:57:01 1998
Color profile: Disabled Composite Default screen
2739
Borchers et al.
Fig. 14. Shapes of the smooth, s(•), for the smoothed variables used in the horse mackerel GAM for other countries’ nonzero observations. Zero on the vertical axes corresponds to no effect of the explanatory variable. The broken lines correspond to 95% confidence limits for the smooth. Ticks on the x axis indicate the locations of observations.
data generated in (1). Refit the model for Spain to the nonzero Spanish numbers generated in (2). Refit the model for other countries to the nonzero numbers for other countries generated in (2). (4) Re-estimate abundance using the models fitted in (3).
Table 3. The t statistics associated with the estimated coefficients of covariates that enter the model linearly for each of the horse mackerel models.
The estimates Using a GAM in place of the stratified approach reduces the CV of the egg abundance estimate from 18 to 9% and of the biomass estimate from 22 to 18% (Table 4). The biomass estimate is some 6% higher than that obtained by using a stratified approach with Pennington’s method, but this is well within what could be expected as a result of sampling variation and does not indicate that either estimate is biased. The variance of the egg abundance estimate has been reduced to the extent that it now contributes 33% to the variance of the biomass estimate, compared with almost 70% previously (Table 5).
Covariate
Discussion and conclusions The conventional approach to estimating egg abundance for these two species has been to adopt a high degree of stratification and to assume lognormal errors, which implies a constant CV. The intense stratification provides flexibility without having to assume a specific model for spatial trend, but this is at the expense of having to estimate a large number of parameters. Variance and interval estimation with this approach is model based, assuming as it does, lognormality of deviations from the stratum means.The adequacy of the lognormal error model is not routinely assessed, and while lognormality is plausible a priori, it is not necessarily the most appropriate model. When error models for mackerel were assessed for adequacy in this study, for example, a model with variance proportional to mean was found to be more appropriate than one with a constant CV. Any unease there may be with model-based inference compared with design-based inference (as defined by Thompson 1992, pp. 94–97, for example) usually centres around the adequacy of the assumed model; inappropriate models lead to inappropriate inferences. Good model-based inference requires models that are adequately flexible in both their systematic component (trend) and their stochastic component (error distribution), as well as adequate diagnostic and modelselection tools. The conventional method is flexible in its trend
Presence–absence model Lon BDp Gra
df
t
710 10.7 710 –9.7 710 3.3
Spanish nonzero model Covariate Lon Tim
df
Other nonzero model t
162 12.0 162 2.7
Covariate Lat BDp Dat
df
t
124 –9.6 124 –3.9 124 5.7
Note: Positive statistics correspond to conditional effects in which modelled egg density increases as the covariate value increases; negative statistics correspond to conditional effects in which modelled egg density decreases as the covariate value increases.
component without assuming a model for trend, but it is inflexible in its stochastic component, the adequacy of which is not routinely assessed. Powerful tools for assessing the adequacy of both systematic and stochastic components of models and for model selection are provided by GLM theory and software. GLMs provide a framework for reducing the number of parameters to be estimated and improving precision by modelling trend smoothly rather than via strata. However, GLMs may be inadequately flexible to capture very nonlinear trends like those seen in the examples above. GAMs, on the other hand, accommodate trends of arbitrary nonlinearity and allow the data to determine to a large degree the nature of the trend. While the theory of inference for GAMs is not as well developed as that for GLMs, some asymptotic results developed for GLMs model selection hold approximately for GAMs (Hastie and Tibshirani 1990), so that the model selection tools and diagnostics used for GLMs can be used with some confidence with GAMs. Asymptotic results are not available for interval estimation, but variance and interval estimation can be performed using bootstrap methods, as we have done above. Thus, although the theoretical properties of GAM-based estimates have not yet been investigated as thoroughly as those for GLMs or stratified estimators, the flexibility of GAMs and their associated diagnostic and model selection tools provides a powerful framework for good model-based inference in the presence of very nonlinear trends. Our modelling indicates that precision can be improved substantially by using GAMs to model the spatial distribution © 1997 NRC Canada
F97-134.CHP Fri Feb 20 08:57:12 1998
Color profile: Disabled Composite Default screen
2740
Can. J. Fish. Aquat. Sci. Vol. 54, 1997
Fig. 15. Modelled egg densities for horse mackerel by half-degree block. The value shown for each block is the average of the fitted surface in the block.
Table 5. The percentage of variance in total estimated biomass contributed by each of the components of the horse mackerel biomass estimate when egg abundance is estimated using GAMs. Stratum
Egg nos.
Fecundity
Spawning fraction
Biomass
Northern Middle Southern Total
0.7 2.0 30.4 33.1
0.3 0.8 1.4 2.5
6.3 18.5 39.7 64.4
7.2 21.3 71.5 100.0
Table 6. Percent coefficients of variation of the egg abundance estimates and percent contribution to variance of the biomass estimate due to estimating egg abundance. % Variation due to egg abundance estimate
% CV Estimate
Species
Egg abundance Mackerel Horse mackerel Biomass Mackerel Horse mackerel
Table 4. Estimates by stratum of egg abundance (Pˆ 0), fecundity (Fˆ ), spawning fraction (Sˆ), and spawning stock biomass (Bˆ) of western horse mackerel.
Stratum
GAM Stratified Pˆ0 Pˆ 0 Fˆ (×1012) (×1012) (eggs/g)
Northern
0.98 (0.11) [11.0] Middle 9.46 (0.54) [5.7] Southern 5.10 (1.23) [24.0] Total 15.54 (1.34) [8.6]
0.93 (0.33) [35.9] 9.41 (2.36) [25.1] 4.45 (1.13) [25.3] 14.79 (2.64) [17.8]
Sˆ
212 0.033 (14.1) (0.011) [6.8] [32.5] 204 0.104 (7.5) (0.018) [3.7] [17.5] 210 0.058 (10.9) (0.016) [5.2] [27.5]
GAM Stratified Bˆ Bˆ (g, ×1011) (g, ×1011) 2.80 (0.98) [35.0] 8.96 (1.68) [18.8] 8.35 (3.08) [36.9] 20.18 (3.64) [18.1]
2.65 (1.29) [48.9] 8.91 (2.75) [30.8] 7.29 (2.75) [37.7] 18.85 (4.09) [21.7]
Note: Half of the fish are assumed to be female. Egg abundance and spawning stock biomass are shown for both the GAM estimation method and the previously used stratified method. Standard errors are shown in parentheses; %CVs are shown in square brackets.
Previous GAM Previous GAM method method method method 10
3
18 13
9 9
60
17
22
18
70
33
of eggs. The %CV of egg abundance estimates has been roughly halved for both species by modelling the spatial variation in egg abundance in the survey area (Table 6). This resulted in a reduction of some 30% in the CV of the mackerel spawning stock biomass estimate and a reduction of some 20% in the CV of the horse mackerel spawning stock biomass estimate. While the fact that the GAM-method point estimate for mackerel is some 20% lower than the stratified method estimate does not in itself indicate bias, the issue of possible bias in GAM point estimates has not been thoroughly investigated in the literature and is an area that would benefit from further theoretical work. The increase in precision has implications for the cost effectiveness of such surveys; if the precision attained previously is considered to have been adequate, sampling costs could be substantially reduced by sampling the survey area more sparsely and estimating egg abundances using GAMs. Further gains might accrue by applying GAMs to the other components of estimation that vary spatially, namely the adult parameters F, S, and R, In summary the advantages of using GAMs are as follows. (1) The method is very flexible. It does not assume linear relationships between the predictors and the modelled variable, and there is a choice of link functions and of assumed error distribution. It incorporates a sound statistical framework for model and variable selection. (2) Substantial improvements in precision can be achieved using GAMs, giving the potential for considerable cost reductions for a given degree of precision if sampling intensity is reduced accordingly. (3) Interpolation (and to a very limited extent, extrapolation) can be carried out simply and reliably, thus avoiding the issue of how to fill-in when some grid squares were not sampled. © 1997 NRC Canada
F97-134.CHP Fri Feb 20 08:57:37 1998
Color profile: Disabled Composite Default screen
2741
Borchers et al.
(4) Being model based rather than design based, the method does not require a random survey design. Instead, it requires sufficient coverage of the explanatory variables to allow reliable estimation of the egg density surface. Positional covariates (latitude and longitude here) and variables tied to these covariates (bottom depth for example) will often be important explanatory variables. Their range is to a large degree known a priori, so that adequate coverage in these dimensions could often be obtained with certainty by design (but see below). Some variation from the intended design is not problematic, provided there is cover at some level from throughout and slightly beyond the area in which egg densities are high. The method can also be applied in conjunction with adaptive survey designs, and this may lead to further increases in precision. One adaptive design for which there is much to be said is a design in which the range of sampling is limited by the presence of zero hauls. In the case of the 1992 western mackerel and horse mackerel surveys, the survey region was determined in advance of the survey on the basis of the distribution of eggs observed on previous surveys (Anonymous 1991). In the event, the distribution of eggs in 1992 stretched substantially further west than in any previous survey, and it is likely that a substantial proportion of the eggs present at the time of the survey were not surveyed because they fell to the west of the survey region (Anonymous 1994). Evidence for this is contained in the high densities of eggs observed against the western boundary of the survey region, particularly in the case of mackerel (Figs. 3 and 4). Unbiased estimation of egg abundance depends critically on sampling the whole region in which eggs are present in substantial numbers at the time of the survey. In cases in which the range of the eggs is not well known in advance, an adaptive design in which the boundaries of the spawning area are determined during the survey is essential. It seems advisable even when scientists believe they know the range of the egg distribution (which was the case in the examples given here). A second type of adaptive design, which has not received attention in this context, is one that results in an increase in sampling effort in regions of higher observed egg density. Use of this type of design may yield further increases in estimation precision because the increased sample size may allow the egg density surface to be estimated with greater precision in the regions of high sampling effort and high density. This is an area that merits further research. (5) The method provides a map of abundance with respect to spatial and other explanatory variables and can provide statistically sound measures of the uncertainty associated with the map. There is a variety of such measures that might be considered, and while we have not presented any here, interval estimates and (or) variance estimates can readily be obtained from the bootstrap procedure with little additional programming effort. Abundance maps may be of use in understanding the underlying processes determining abundance. Our primary aim in this analysis, however, has been the estimation of egg abundance and spawning stock biomass, rather than making inferences
relating to the variables that drive the spatial distribution of eggs. (6) The method has the potential to allow change over time as well as variation over space to be modelled. This could yield substantial improvements if applied to the AEPM. The method does require more sophisticated software and greater statistical expertise than is required to apply the methods used to date. Bootstrapping of GAMs, to quantify precision of estimates, is also much more computer intensive than the methods used in the stratified approach. Nevertheless, the impact on costs of these disadvantages is small relative to the increase in precision of the biomass estimate and the potential cost savings if survey effort is reduced. GAMs are a relatively new statistical tool, and their utility for inference with the DEPM and for surveys of marine resources in general remains to be thoroughly tested. The theoretical properties of GAM estimators are less well understood than those of stratified estimators, and while the results of this study are very encouraging, investigation of these properties seems advisable before GAM methods are routinely used for marine resource assessment. Because of the need to physically sample the fish stock, methods of estimating egg production are expensive. A fleet of six research vessels was used in the DEPM survey in this study. To minimize costs, surveys were carried out only once every 3 years and virtual population analysis was used in intervening years to estimate biomass of the western mackerel and horse mackerel stocks, as a basis for making management recommendations (Priede and Watson 1993). In the management of anchovy (Engraulis capensis) off South Africa, the DEPM was used to calibrate the hydroacoustic survey (Shelton et al. 1993). The DEPM is generally regarded as too expensive for routine annual application. Acoustic surveys, however, are not satisfactory for Atlantic mackerel because there is no swim bladder and, therefore, the acoustic target strength is low. The egg production methods provide a unique fishery-independent means of obtaining estimates of absolute spawning stock biomass, and GAMs are a promising means by which application of the DEPM can be made more cost effective.
Acknowledgements This study was realized with financial aid from the Commission of the European Communities Directorate General for Fisheries (DG XIV) project No. MA 2 436. We thank our colleagues from the various countries involved for collection of the data: A. Eltink, P. Lucio, J. Massé, L. Motos, J. Molloy, J. Nichols, C. Porteiro, and M. Walsh.
References Ahrens, J.H., and Dieter, U. 1974. Computer methods for sampling from gamma, beta, Poisson and binomial distributions. Computing, 12: 223–246. Aitchison, J. 1955. On the distribution of a positive random variable having a discrete probability mass at the origin. J. Am. Stat. Assoc. 50: 901–908. Anonymous. 1991. Report of the Mackerel/Horse Mackerel Egg Production Workshop, Ijmuiden, The Netherlands, 15–18 Jan. 1991. ICES CM 1991/H:2. Anonymous. 1993. Report of the Mackerel/Horse Mackerel Egg © 1997 NRC Canada
F97-134.CHP Fri Feb 20 08:57:39 1998
Color profile: Disabled Composite Default screen
2742 Production Workshop, Aberdeen, Scotland, 8–12 Mar. 1993. ICES CM 1993/H:4. Anonymous. 1994. Spawning biology, distribution and abundance of mackerel (Scomber scombrus) and horse mackerel (Trachurus trachurus) in the northeast Atlantic. Final report to the Directorate General for Fisheries (DG XIV) of the Commission of the European Communities, Brussels. Bravington, M. 1994. The effects of acidification on the population dynamics of brown trout in Norway. Ph.D. thesis, Imperial College, London. Bridger, J.P. 1958. On efficiency tests made with a modified Gulf III high-speed tow-net. J. Cons. Cons. Int. Explor. Mer, 23: 357–365. Foote, K.G., and Stefánsson, G. 1993. Definition of the problem of estimating fish abundance over an area from acoustic line-transect measurements of density. ICES J. Mar. Sci. 50: 369–381. Gehringer, J.W. 1952. An all metal plankton sampler (model Gulf III). Spec. Sci. Rep. U.S. Fish. Wildl. Serv. No. 88. pp. 7–12. Gunderson, D.R. 1993. Surveys of fisheries resources. John Wiley & Sons, New York. Hastie, T., and Tibshirani, R. 1990. Generalized additive models. Chapman & Hall, London. Hunter, J.R., and Lo, N.C.H. 1993. Ichthyoplankton methods for estimating fish biomass: introduction and terminology. Bull. Mar. Sci. 53: 723–727. Lasker, R. (Editor). 1985. An egg production method for estimating spawning stock biomass of pelagic fish: appplication to the northern anchovy, Engraulis mordax. NOAA Tech. Rep. No. NMFS 36. Lockwood, S.J. 1988. The mackerel, its biology, assessment and management of a fishery. Fishing News Books, Farnham, England. Lockwood, S.J., Nichols, J.H., and Dawson, W.A. 1981. The mackerel (Scomber scombrus) spawning in the Bay of Biscay, Celtic
Can. J. Fish. Aquat. Sci. Vol. 54, 1997 Sea and west of Ireland. Rapp. P.-v. Reun. Cons. Int. Explor. Mer, 178: 171–173. McCullach, P., and Nelder, J.A. 1989. Generalized linear models. 2nd ed. Chapman & Hall, London. Pennington, M. 1983. Efficient estimators of abundance for fish and plankton surveys. Biometrics, 39: 281–286. Pope, J.G., and Woolner, L. 1984. An investigation of the precision of the 1983 western mackerel egg survey. ICES CM 1984/H:70. Priede, I.G., and Watson, J.J. 1993. An evaluation of the daily egg production method for estimating biomass of Atlantic mackerel (Scomber scombrus). Bull. Mar. Sci. 53: 891–911. Seber, G.A.F. 1982. The estimation of animal abundance and related parameters. 2nd ed. Charles Griffin & Co., London. Shelton, P.A., Armstrong, M.J., and Roel, B.A. 1993. An overview of the application of the daily egg production method in the assessment and management of anchovy in the southeast Atlantic. Bull. Mar. Sci. 53: 778–794. Swartzman, G., and Huang, C. 1992. Spatial analysis of Bering Sea groundfish survey data using generalized additive models. Can. J. Fish. Aquat. Sci. 49: 1366–1378. Swartzman, G., Stuetzle, W., Kulman, K., and Powojowski, M. 1994. Relating the distribution of pollock schools in the Bering Sea to environmental factors. ICES J. Mar. Sci. 51: 481–492. Swartzman, G., Silverman, E., and Williamson, N. 1995. Relating trends in walleye pollock (Theraga chalcogramma) abundance in the Bering Sea to environmental factors. Can. J. Fish. Aquat. Sci. 52: 369–380. Thompson, S.K. 1992. Sampling. John Wiley & Sons, New York. Watson, J.J., Priede, I.G., Witthames, P.R., and Owori-Wadunde, A. 1992. Batch fecundity of Atlantic mackerel, Scomber scombrus L. J. Fish. Biol. 40: 591–598.
© 1997 NRC Canada
F97-134.CHP Fri Feb 20 08:57:41 1998