Improving the Semantic Similarity of Object-Oriented Domain Models Davor Svetinovic Lero – The Irish Software Engineering Research Centre University Of Limerick Limerick, Ireland
[email protected]
Daniel M. Berry, Michael W. Godfrey, Nancy A. Day David R. Cheriton School of Computer Science University of Waterloo Waterloo, Ontario, Canada {dberry, migod, nday}@uwaterloo.ca
Abstract The main goal of any object-oriented analysis (OOA) method is to clarify a problem by explicitly modeling both the problem and its domain. Therefore, the most important artifact that results from OOA is the domain model, which is usually realized as a class diagram that describes the core concepts in the domain and their relationships. Ideally, a mature engineering process is repeatable: analysts given the same problem and instructions to follow the same OOA process should produce semantically similar domain models. This work compares the observed semantic similarity among the different domain models produced by one process for one system by different users of the process when the process is one of: 1. creation of use cases (UCs), then sequence diagrams, then a domain model, and 2. creation of UCs, then a unified UC statechart, then a domain model. One process was used to produce 31 specifications of a large VoIP system and its accompanying information management system. The other process was used to produce 34 specifications of the same system. The data show that domain models produced using the second process were 10% more semantically similar to each other than those produced using the first process, but at a cost, by one measure, of up to 25% more time, spent in learning the process and in requirements elicitation.
1
Introduction
In 1967, Dahl and Nygaard presented the first object-oriented programming (OOP) language, Simula 67 [7]. In 1982, Booch published his paper on object-oriented design
(OOD) [3]. In 1988, Shlaer and Mellor published their book on object-oriented analysis (OOA) [25]. These three events were the major milestones in the development of the object-oriented (OO) paradigm of software development. Today, object orientation is not just one of the oldest software development paradigms, it is also one of the most widespread. From OOP languages to different OO modeling standards and frameworks, object orientation shapes the ways we think about business and software systems, how we organize our development processes, and so on. From more than 25 years of hindsight, it appears that the eventual widespread adoption of object orientation was fueled partially by the impact of Booch’s 1982 paper [3], and in particular, due to his claim of how easy it is to identify the objects of a problem, their attributes, and their operations by looking for nouns, adjectives, verbs, and adverbs in a written description of the problem. This identification forms the essence of the OOD method that Booch was advocating. In turn, these two steps form the foundation of what is today known as OOA. With almost equal hindsight, we can safely say that these tasks are not that simple and, as stated, they are not sufficient for the production of high-quality OOA models. Indeed, Hatton [15] has presented empirical evidence that calls into question the fundamental idea that the main benefit of object orientation is that an object-oriented program accurately models its domain, and therefore its validity is easy to ascertain. Earlier, Santos (now Ramos) and Carvalho [23] performed an empirical assessment of the applicability of OOA to the development of information systems (ISs) and found that with their subjects, OOA led to good models of an IS itself but did not lead to adequate models of the processes of the organization that owns the IS. More generally, Hatton [15], Kaindl [17], and Kramer [18] have indicated an urgent need for experimentation aimed at validating the effectiveness of all software engineering abstraction techniques and methods including object-oriented techniques.
This paper describes an attempt to fulfill the need identified by Hatton, Kaindl, and Kramer with respect to a OOA method to build a domain model (DM) of a computer-based system (CBS) that is to be developed. This method is called the Use Case Unification Method (UCUM) and is described in detail in [27, 26]. This DM is built in the context of an RE effort to elicit and analyze requirements, and eventually to specify in a Software Requirements Specification (SRS) document the CBS’s desired behavior and properties, i.e., the CBS’s requirements. The portion of the real world that a CBS is supposed to automate is the CBS’s domain. In use-case-driven requirements analysis methods [e.g., 20], the first task analysts perform in modeling the behavior of the CBS being built is to write UCs that describe the CBS’s intended behavior. A UC of a CBS is one particular way some user of the CBS uses the CBS to achieve stakeholders’ goals. Domain experts and analysts together typically capture UCs during and after requirements elicitation from many stakeholders, each with a different perspective. The description of a UC is typically given at the shared-interface level, showing the CBS as a monolithic black box. From these UCs, the analysts begin to model the entire CBS’s domain. In object-oriented analysis (OOA), the analysts break down and describe the entire CBS’s domain in terms of objects that are used later as the main source of objects for object-oriented design (OOD). Conceptual analysis is this whole process of discovering and specifying concepts from a domain with the goal of producing a DM. In the OOA literature [e.g., 19], this DM is known as a OOA class model or as a conceptual model. Traditionally, conceptual analysis proceeds by creating sequence diagrams from the UCs, then choosing objects, and finally assigning behavior to these objects in order to capture the combined behavior of all UCs. Recently, among others, Glinz [11]; Whittle and Schumann [29]; and Harel, Kugler, and Pnueli [14] each proposed a formal method to build a behavioral model of the entire domain prior to decomposing the DM into objects. UCUM is an informal variant of the these formal methods. UCUM was developed to deal with difficulties that our students were having when they tried to build DMs for CBSs in the courses we were teaching. In UCUM, a statechart [13] representation of the CBS’s domain as a UC statechart is constructed prior to decomposing the system into objects. In a previously published companion papers [27] and [28], we discussed the difficulties we had observed among our students, confirming that OOA is not as simple as the folklore claims it is. We presented a qualitative evaluation of UCUM’s effectiveness in attacking these difficulties. We concluded that UCUM is straightforward to learn and to apply, that it provides significant help in handling the difficulties we observed in building a DM, that it helps students
produce better than average models, but that it is not the cure to all DM building difficulties. The present paper addresses a different measure of the quality UCUM as a method. It compares the repeatability of UCUM to that of traditional OOA. Ideally, given the same problem domain and the same OOA method, identical DMs should result. However, achieving identical DMs is highly unlikely in practice: different analysts may have different abilities and experiences, and these differences often strongly influence the results of performing domain analysis. Hence, we settle for semantically similar DMs as a sign of a repeatable method for generating DMs. Therefore, the repeatability of a method is assessed by examining the semantic similarity of the DMs that result from different people using the method on the same problem in the same context or environment. The results from the data we gathered show that the DMs of one large CBS produced by students using UCUM are about 10% more semantically similar to each other than are the DMs of the same large CBS produced by students using more traditional OOA with no notion of unification of use cases. In addition to the quantitative comparison of the repeatability of two OOA methods, this paper provides also an indepth analysis of the quantitative results, which provides insights for further improvements of OOA methods. Accordingly, Section 2 discusses repeatability and explains why it is a desirable property of methods. Section 3 provides a short summary of UCUM. Section 4 describes the background and context of the two case studies, each with a set of DMs produced with the help of one of the OOA methods. Section 5 describes the actual comparison of the semantic similarity of the elements of each of the two sets of DMs that are in the two case studies. Section 6 describes the results and the lessons learned from the case studies. Section 7 discusses related work. Section 8 concludes the paper. Due to space limitations, many details of this work have been been omitted from this paper. They can be found in the first author’s Ph.D. thesis [26]1 , from which this paper is derived.
2
Repeatability and Semantic Similarity
Each of science and engineering depends on repeatable results. Science requires that a result be reproducible before it can be accepted as fact, and engineering strives to develop reliable processes for achieving consistent outcomes. Furthermore, there has recently been much discussion of the scientific underpinnings of modeling; Booch, for example, has discussed the notion of modeling-as-science that is 1 This Ph.D. thesis is officially published by University of Waterloo and it is permanently accessible online at http://etd.uwaterloo.ca/ etd/dsvetino2006.pdf.
2
worth striving for [4]. In the context of software RE, an ideal modeling process is one that produces high quality models consistently and reliably. That is, for any given problem and encompassing domain, two teams of requirements engineers who follow the process are likely to come up with semantically similar solutions that are of good quality. We use the term semantic similarity to indicate the degree of closeness that independently produced DMs of one domain may share. More formally, we use a generalized definition of semantic similarity [2]:
that serves as a high quality behavioral domain model of the CBS [11, 29, 14]. UCUM is derived from several sources. UCUM is primarily Larman’s UC-driven iterative method [19]. The principles of constructing a unified UC statechart are based on Douglass’s and Gomaa’s principles of UC statechart construction [9, 12]. The high-level steps of UCUM are: 1. Specify UCs. 2. Group UCs into domain subsystems.
Semantic similarity, variously also called semantic closeness/proximity/nearness, is a concept whereby a set of documents or terms within term lists are assigned a metric based on the likeness of their meaning/semantic content.
3. Draw UML system sequence diagrams [19] for the UCs, in order to be able to identify system’s external interface. 4. Specify the unified UC statechart to capture behavior specified in all UCs.
The metric used in this work is domain-expert opinion combined with manual clustering. Semantic similarity is not new and has been used quite extensively in practice and research. For example, the basis for the concepts of reference architectures and design patterns [e.g., 10, 6] is in the idea that all architectures matching a reference architecture and all design patterns matching a particular design are semantically similar. Repeatability for OOA as an engineering method means that given the same domain, different analysts applying the same OOA would be expected to produce semantically similar models of the same domain. Thus, semantic similarity of the results of several applications of an OOA method to one domain is a direct measure of the repeatability of the OOA method. The goal of this paper is to determine whether using UCUM to build DMs is more repeatable than is traditional OOA with no notion of unification of use cases. Given two methods, M and N , for building DMs, M is deemed more repeatable than N if the DMs of a CBS produced by analysts using M are more semantically similar to each other than are the DMs of the same CBS produced by similar analysts using N . By “similar analysts” we mean individuals of roughly the same background and experience, such as students taking the same course at one university.
3
5. Perform conceptual analysis of the unified UC statechart. The last two steps are the main steps of the method. The order of these steps is not sacred. In fact, students in the case studies described in the next section used it both sequentially and iteratively. Additionally, to specify the unified UC statechart some students built a statechart for each UC and then integrated these statecharts, while some students preferred to integrate each UC directly into the unified UC statechart. UCUM is described in detail, with an example, in the companion paper [27] and in the first author’s Ph.D. thesis [26].
4
Description of Case Studies
The motivation for the development of UCUM came from our observations of our students’ work in the requirements analysis and specification of a computer-based system (CBS) composed of 1. a telephone exchange or a Voice-over-IP (VOIP) system and 2. its information management system (IMS).
UCUM Summary
Production of the specification, in the form of a SRS document, is the term-long project carried out in the first course of a three-course sequence of software engineering courses that span the last three terms of the undergraduate software engineering program at the University of Waterloo [24]. In later courses, students design, implement, test, and enhance the CBS specified in the SRS. The project in the three-course sequence involves using various techniques for developing software for real-time
The key idea of UCUM is that building a unified UC statechart model should improve the semantic similarity of DMs. UCUM is based on the premise that an effective way to unify a complete set of UCs into a behavioral domain model for the CBS is to perform the unification in the statechart notation. That is, if each UC in the set can be described with a UC statechart, then it should be possible to merge these UC statecharts into a unified UC statechart 3
5
systems and OO techniques for developing information systems. Use cases (UCs) [e.g., 19] are used to capture requirements, and OOA is used as a bridge to later OOD. The real-time components of the CBS are specified using formal finite-state modeling in the Specification and Description Language (SDL) [5]. The information-system components of the CBS are specified using the notations of the Unified Modeling Language (UML) [22]. In addition, students are responsible for modeling user interfaces of the IMS and for the overall management of the requirements specification process. The average size of the resulting SRS document for the whole CBS is 120 pages, with actual sizes ranging anywhere from 80 to 250 pages. The research described herein required reviewing 135 SRSs out of the over 195 SRSs that were developed by over 740 students working in teams of three or four members. After observing that students often had difficulties doing UC-driven OOA, we decided to introduced UCUM as an alternative method. We hoped that the student would find it easier to do UC-driven OOA if they performed a detailed behavioral analysis of the domain by unifying the UCs into an integrated behavioral model shown as one statechart. The repeatability of UCUM and of ordinary OOA for producing DMs were evaluated by after-the-fact analyses of the DMs produced during the term-long project in each of two consecutive offerings of CS445. Each DM in either term was created as part of a large-sized SRS describing a VoIP CBS and its related IMS. Each term’s DMs formed one case study:
Analysis of Case Studies
This section discusses the analysis of the two case studies, CS O31VS and CS N34VS. Table 1 summarizes the numbers of concepts discovered and captured in all DMs and per DM of CS O31VS and CS N34VS. Notice that there are two columns about CS N34VS, one labeled “CS N34VS” and one labeled “CS N34VS w/DM45”. The data for the former column exclude the data for the DM with the most semantically unique concepts, while the data for the latter column include the data for this DM. The excluded DM has 45 concepts and contains a large number of concepts that we were unable to classify and really understand what they represent. This outlier DM is the subject of a later discussion, and it is ignored in the discussion until then, unless it is explicitly mentioned as DM45. As can be seen in Table 1, with this outlier DM45 excluded, the numbers from each DM of CS O31VS and CS N34VS end up being very similar. 5.1
Detailed Evaluation of Concepts in the DMs of the Case Studies
The main comparison of the semantic similarity of the concept sets of the DMs in CS O31VS and CS N34VS considers the 36 common concepts. These common concepts are all concepts that appeared in the DMs of both case studies and in at least two DMs within each case study. That is, the common concepts are the concepts that were discovered no matter which analysis method was used and that were recognized as valid concepts by at least two groups that used each method. Details on how these common concepts were identified can be found in the first author’s Ph.D. thesis [26]. Table 2 shows that the semantic similarity of common concepts in the DMs of CS N34VS is higher than the semantic similarity of common concepts in the DMs of CS O31VS. Specifically:
1. CS O31VS2 comprised 31 SRSs produced using traditional OOA, and 2. CS N34VS comprised 34 SRSs produced using UCUM. The analysis performed lacks the internal validity of a controlled experiment, which would, in this case, lack external validity, since very small artifacts would have to be used in order to be able to afford to do the experiment with sufficient controls and enough subjects. However, the after-thefact analysis of the SRSs produced by upwards of 30 teams for each treatment in 12-week long RE efforts for a medium sized VoIP system that approaches industrial size has more external validity than would be possible in any controlled experiment that we can imagine on the same topic.
1. The average number of concepts per DM is approximately 5.5% higher for the DMs of CS N34VS than for the DMs of CS O31VS, as is shown in the cells in Row 2 and Columns 2 and 3. 2. The average number per DM of common concepts is approximately 14.4% higher for the DMs of CS N34VS than for DMs of CS O31VS, as is shown in the cells in Row 2 and Columns 4 and 5. 3. For each of the average number of concepts per DM and the average number of common concepts per DM, the standard error of the average for one case study is approximately the same as the standard error of the average for the other case study, due to the approximately equal size of the two sets of data involved.
2 The name of a case study encodes some of the data about the case study; “CS” means “case study”, “O” means “Old OOA method with no use case unification”, “N” means “New OOA method, i.e., UCUM”, a number is the number of SRSs in the case study, and “VS” means “VoIP system”.
4
Scope
Measure
Case Studies CS N34VS CS N34VS w/DM45 527 622 622 259 312 312 134 110 140
CS O31VS Original, raw concepts Syntactically unique concepts Semantically unique concepts Maximum number of semantically unique concepts Minimum number of semantically unique concepts Average number of semantically unique concepts Median number of semantically unique concepts
In all DMs of the case study
In each DM of the case study
31
33
45
8
10
10
17
17
18
16
17
17
Table 1. CS O31VS–CS N34VS Statistics
1 Metric 1 2 3 4 5 6 7
Average Standard Deviation Standard Error Quartile (.75) Quartile (.25) Interquartile Range
2 CS O31VS
CS N34VS
3
Concepts 16.97 5.07 0.91 20.00 13.00 7.00
Concepts 17.91 6.85 1.17 18.75 14.00 4.75
4 CS O31VS Common Concepts 12.29 3.53 0.63 14.00 10.00 4.00
Table 2. CS O31VS–CS N34VS Statistics Summary
5
5 CS N34VS Common Concepts 14.06 2.60 0.45 15.75 12.00 3.75
4. The standard deviation of the average number of concepts per DM is approximately 35.1% higher for the DMs of CS N34VS than for DMs of CS O31VS, as is shown in the cells in Row 3 and Columns 2 and 3.
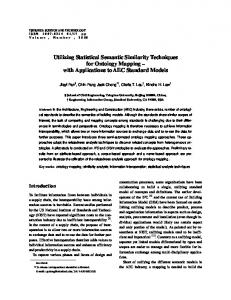
This 10% improvement in semantic similarity came at a cost. The cost of teaching UCUM and eliciting requirements for the CS N34VS term was at least about 25% higher than the cost of teaching traditional OOA and eliciting requirements for the CS O31VS term. We do not have data on students’ hours, but we do have data on hours the TAs interacted with the students. We assume that the students required more time from the TAs in the CS N34VS term than in the CS O31VS term because the students were spending more time on their project. The first author, as the head TA in both terms, was responsible for answering students’ questions found that his workload for the CS N34VS term was about 30% higher than for the CS O31VS term. This time is mostly for teaching, since each student was to go to his or her own project TA for elicitation issues. Also, in each term in CS445, we have each TA report his or her actual workload for the course. The average number of elicitation meetings in a term between a group and its TA, as analysts and customer, increased from about 6–8 per previous nonUCUM-using term to about 10 in the UCUM-using term, i.e., from about 66% to about 25% more. That is, using any variant of UCUM required at least about 25% more elicitation effort. The next step is to perform an in-depth analysis of the results of these two case studies. The focus is on the set of common concepts that appeared in the DMs of both case studies, shown in the chart in Figure 1. The chart in Figure 1 shows for each common concept3 , its relative frequency in each case study. Each actual number of groups in CS N34VS was scaled down to maximum of 31, by multiplying it by 31/34, to match the number of groups in CS O31VS. For any concept c listed in the x-axis of Figure 1, that c appears less often in the DMs of CS N34VS than in the DMs of CS O31VS suggests either that the use of unified UC statecharts and UCUM prevented c’s discovery or that the use of unified UC statecharts and UCUM filtered c out of DMs because c was outside of the domain’s boundary. The same number of cs in the DMs of both case studies indicates no change in the effect of the use of unified UC statecharts and UCUM on the discovery of c, and a larger number of cs in the DMs of CS N34VS than in the DMs of CS O31VS indicates that the use of unified UC statecharts and UCUM helped c’s discovery. In the DMs of CS N34VS there were:
5. The standard deviation of the average number of common concepts per DM is approximately 35.8% lower for the DMs of CS N34VS than for the DMs of CS O31VS, as is shown in the cells in Row 3 and Columns 4 and 5. The probable reason that the standard deviation of the average number of concepts per DM is higher for the DMs of CS N34VS is the presence in the DMs of CS N34VS of concepts from the outlier DM45. Therefore, we computed also the interquartile range, which can ignore any outlier DM with an extremely large or an extremely small number of concepts. 6. The interquartile range of the number of concepts per DM is approximately 47.4% lower for the DMs of CS N34VS than for the DMs of CS O31VS, as is shown in the cells in Row 7 and Columns 2 and 3. 7. The interquartile range of the number of common concepts per DM is approximately 6.7% lower for the DMs of CS N34VS than for the DMs of CS O31VS, as is shown in the cells in Row 7 and Columns 4 and 5. That the interquartile range of the number of common concepts per DM is lower in CS N34VS than in CS O31VS for the same set of data leads to the conclusion that the concept concentration was higher in the DMs of CS N34VS than in the DMs of CS O31VS, for both all and the common concepts. Therefore, the DMs of CS N34VS are more semantically similar to each other than are the DMs of CS O31VS. Moveover, it is possible to estimate that the semantic similarity of concepts is approximately 10% higher in the DMs of CS N34VS than in the DMs of CS O31VS, based on the previously described quantitative analysis showing that: • an average increase of 5.5% in the number of concepts per DM of CS N34VS over the number of concepts per DM of CS O31VS • an average increase of 14.4% in the number of common concepts per DM of CS N34VS over the number of common concepts per DM of CS O31VS
• 11 concepts, or 30.6%, that were captured less often than in the DMs of CS O31VS, • 23 concepts, or 63.9%, that were captured more often than in the DMs of CS O31VS, and
• an increase in the capture of common concepts per DM from 75% in the DMs of CS O31VS to 84% in the DMs of CS N34VS; and
3 The names of the concepts are disguised to prevent search-enginesavvy students who are currently taking the class from gaining an advantage over students who have taken the class in the past.
• a narrow data spread for both sets of data. 6
imetim-41 aterat-41 gerpri-27 iodbil-31 estaut-31 geraut-23 gercsr-26 gercal-26 orderr-33 mertim-40 logtes-37 temsys-39 entpay-38 gercal-25 gespri-35
# in CS N34VS
gerip -35
# in CS O31VS
Concepts
ioddis-30 essip -35 gerhar-29 olecon-38 berpho-33 germai-26 geruse-25 seruse-41 gerres-29 untpho-32 untcsr-34 gerbil-30 gercal-33 lersys-28 csrcsr-42 ordcal-34 illbil-41 onepho-40 lancal-33 untuse-33 0
1
2
3
4
5
6
7
8
9 10 11 12 13 14 15 16 17 18 19 20 21 22 23 24 25 26 27 28 29 30 Frequency
Figure 1. CS O31VS–CS N34VS Common Concepts Chart
7
• 2 concepts, or 5.5%, that were captured as often as in the DMs of CS O31VS.
havioral analysis and modeling can lead. Fortunately, only one out of 34 groups went in this direction. So, the problem was not widespread. The problem could probably have been avoided by the TA’s having pointed the group in the right direction.
Four concepts of the 11 that appear less often in the DMs of CS O31VS than in the DMs of CS N34VS represent external entities, i.e., Each is an actor from outside the boundary of the VoIP CBS. It was gratifying to see that the DMs of CS N34VS had fewer of the external actors, which should not have appeared, than the DMs of CS O31VS. Nevertheless, it was disappointing that some of external actors still appeared in the DMs of CS N34VS. Thus, building unified UC statecharts for a CBS facilitates but does not guarantee proper boundary definition and proper placement of external actors outside the CBS’s boundaries. The lower numbers of system controller4 and call manager concepts in the DMs of CS N34VS than in the DMs of CS O31VS was due to the level of conceptual decomposition and refinement at which DMs in the DMs of CS N34VS were specified; system controller and call manager are the high-level concepts responsible for the overall control of the IMS and of the call processing part of VoIP system, respectively. Because the degree of decomposition in the DMs of CS N34VS is higher than in the DMs of CS O31VS, these concepts tended to be less explicitly indicated in the DMs of CS N34VS than in the DMs of CS O31VS. Instead, they tended to be included indirectly through their components, i.e., the concepts of which they consist. The system concept represents the CBS itself, and in most cases it was captured through the use of package notation to capture all other concepts within the CBS. This concept is considered redundant because a DM, by definition, captures only concepts within the CBS’s domain. However, for some reason, some students felt a need to include this concept explicitly as part of the DM. The chart of Figure 1 shows that the typical concept appears about 10% more often in the DMs of CS N34VS than in the DMs of CS O31VS, in agreement with the estimate that the DMs of CS N34VS are 10% more similar to each other than are the DMs of CS O31VS. Finally, the outlier DM45, with 30 unclassifiable concepts, taught us about a potentially very negative impact that the use of unified UC statecharts and UCUM can have on DMs, for the specification of any concept that represents only one function of the CBS. Most of the 30 unclassifiable concepts were of this type. For example, a concept such as add admin profile is nothing but one high-level function of CBS captured as a concept. Many a modeling expert considers creating a concept for each function to be incorrect modeling and a negative extreme to which detailed be-
6
Overall Evaluation and Main Lessons
The analysis of the case studies in Section 5 shows that the semantic similarity of the DMs of CS N34VS was about 10% higher than the semantic similarity of the DMs in CS O31VS. That is, UCUM is about 10% more repeatable than is ordinary OOA, and the key difference between the methods is that UCUM has an analyst performing a detailed behavioral analysis before doing conceptual analysis. However, the cost of teaching UCUM and eliciting requirements was about 25% higher for the SRSs of CS N34VS than for the SRSs of CS O31VS. The remainder of this overall evaluation considers observations about UCUM and its products, observations that fall out of the data and our grading evaluation of the artifacts produced by the students. The two numbers, 10% and 25%, are not comparable and should not be used to make a direct cost–benefit analysis of performing a detailed behavioral analysis before conceptual analysis. For example, one possible benefit of spending the 25% more time eliciting requirements is more detailed requirements and UCs. As described in [27], the TAs and the first author agreed that the requirements and UCs specified in the SRSs of the UCUM-using terms were more detailed and consistent than those of the non-UCUM-using terms. It is necessary also to take the entire lifecycle into account. It is hard, if not impossible, to estimate the total benefits to the downstream development speed and to the reliability, robustness, and other qualities of the CBS being developed caused by the 10% improvement in semantic similarity in the DMs and by the use of UCUM. The use of UCUM and of extensive functional and behavioral modeling before proceeding with conceptual analysis led to 1. better functional analysis and discovery of more CBS requirements, 2. an increase in semantic similarity among different DMs of the same CBS, 3. several qualitative changes in the DMs: • larger number of functional concepts, i.e., processors,
4 The
• clearer boundary and interface concept definition, and
concept names in this discussion are not disguised because the discussion makes no sense without the concept names. We have determined that revealing these particular concept names gives no particular advantage to the students in the course who may have read this paper.
• a lack of inheritance, and 8
7
4. an insufficient number of data concepts. The relationship between the first two points is of particular importance. Consider the detailed behavioral modeling that was done through the use of the unified UC statecharts. This modeling is very similar to traditional structured analysis [e.g., 8, 32, 31, 30]. So, rather than contradicting each other, combining structured analysis and OOA helped improve the semantic similarity and the quality of DMs in a way summarized by Richman [21]:
Related Work and Counter Indications
The paper [27] describes related work by Glinz; Whittle and Schumann; and Harel, Kugler, and Pnueli [11, 29, 14] whose qualitative conclusions generally agree with those of our work. The present results showing the effectiveness of UCUM as an approach in which an analyst does detailed behavioral analysis before doing conceptual analysis contradicts, at least superficially, the conclusions of a case study by Kabeli and Shoval [16]. Their case study shows that doing data modeling before doing functional analysis leads to better OO models, as judged by their criteria [16], than doing functional analysis before doing data modeling. It is not surprising that early case studies produce results that appear to contradict each other. First of all, neither our nor their case study is conclusive, and neither traditional OOA nor UCUM perform explicit data analysis, while the subjects of the Kabeli and Shoval study did explicit data analysis. Second, there may be yet other parameters, entirely overlooked in each case study, that consistently account for the contradictory conclusions. Only additional, independent, experimentation in the future can resolve this issue.
A weakness of OO is that OO methods only build functional models within the objects. There is no place in the methodology to build a complete functional model. While this is not a problem for some applications (e.g., building a software toolset), for large systems, it can lead to missed requirements. Use cases address this problem, but since all use cases cannot be developed, it is still possible to miss requirements until late in the development cycle. In addition, it is probably this integration of the detailed behavioral analysis with OOA, in UCUM, that has resulted in DMs that are deeper, more detailed, and closer to the design and architecture of the domain, as observed by John Mylopoulos (in private communication) and some of the graduate students building the DMs of an existing elevator CBS who were familiar with other OOA methods [1, 26]. Mylopoulos observed that the method itself is more systematic than many scenario-based OOA methods. The DMs produced using UCUM seemed to provide a more solid basis for transitioning to design phases than those produced by the OOA methods that had been used previously. A large number of and well decomposed functional concepts, i.e., processors, a clear definition of interface concepts, and a lack of inheritance, are what we consider to be the positive effects of doing a detailed behavioral analysis first on the DMs. In our opinion, such DMs allow easier transition to OOD activities and models. Each of traditional OOA and UCUM seems unable to expose the data concepts in a domain. It seems that no analysis not focusing on data is an adequate substitute for traditional data analysis. Data analysis should be a necessary component of any analysis method and, in our opinion, of a higher priority than conceptual analysis. In summary, in our opinion, requirements analysis should not be primarily focused on conceptual analysis. Behavioral and data analysis should be of a higher priority than conceptual analysis. Note that we consider OOD completely distinct from OOA and self-sufficient, and none of the conclusions of this paper apply to OOD.
8
Conclusion
This paper compares the repeatability of two OOA methods, (1) traditional OOA and (2) UCUM, by comparing the degree of semantic similarity among the sets of DMs for the same problem produced by the two methods. The comparison is based on two after-the-fact case studies: • Traditional OOA was carried out to produce 31 SRSs of a large VoIP CBS containing an IMS. Data from these 31 SRSs and their DMs were gathered later in the case study CS O31VS. • UCUM was carried out to produced 34 SRSs of the same large VoIP CBS containing an IMS. Data from these 34 SRSs and their DMs were gathered later in case study CS N34VS. The conclusion of the two case studies was that for the CBS, the students, and the SRSs involved in the case studies, the use of UCUM yields DMs that are about 10% more semantically similar to each other than are the DMs yielded by traditional OOA. However, UCUM requires about 25% more time to learn than does traditional OOA. Additional contributions of our work are: • a discussion of the role of semantic similarity in evaluating a method’s repeatability as ar measure of the quality of the method 9
• a technique to determine in which of two sets of DMs are the DMs more semantically similar to each other, and
[16] J. Kabeli and P. Shoval. Data modeling or functional analysis: What comes next? an experimental comparison using FOOM methodology. In Procedings of the Eighth CAISE–IFIP WG 8.1 International Workshop on Evaluation of Modeling Methods in Systems Analysis and Design (EMMSAD’03), pages 48–57, 2003. [17] H. Kaindl. Is object-oriented requirements engineering of interest? Requirements Engineering, 10(1):81–84, 2005. [18] J. Kramer. Abstraction: The key to software engineering? Keynote: JSSST Japan Society for Software Science and Technology Conference, 2004. [19] C. Larman. Applying UML and Patterns: An Introduction to Object-Oriented Analysis and Design and the Unified Process. Prentice Hall, Englewood Cliffs, NJ, second edition, 2001. [20] C. Larman. Applying UML and Patterns: An Introduction to Object-Oriented Analysis and Design and the Unified Process. Prentice Hall, Englewood Cliffs, NJ, second edition, 2001. [21] D. M. Rickman. A process for combining object oriented and structured analysis and design. In Proceedings of NDIA 3rd Annual Systems Engineering & Supportability Conference, October 2000. [22] J. Rumbaugh, I. Jacobson, and G. Booch. The Unified Modeling Language Reference Manual. Addison-Wesley, Reading, MA, second edition, 2004. ´ [23] I. Santos and J. ao Alavaro Carvalho. An assessment of the applicability of object-oriented analysis to the development of information systems. In Proceedings of the IEEE International Conference on Requirements Engineering (ICRE), pages 238–244, April 1996. [24] SE463/CS445 course project. http://www.student. cs.uwaterloo.ca/˜cs445/; accessed January 30, 2008. [25] S. Shlaer and S. J. Mellor. Object-oriented systems analysis: modeling the world in data. Yourdon Press, 1988. [26] D. Svetinovic. Increasing the Semantic Similarity of ObjectOriented Domain Models by Performing Behavioral Analysis First. PhD thesis, University of Waterloo, 2006. [27] D. Svetinovic, D. M. Berry, N. A. Day, and M. W. Godfrey. Unified use case statecharts: Case studies. Requirements Engineering Journal (Springer), 12(4):245–264, 2007. [28] D. Svetinovic, D. M. Berry, and M. Godfrey. Concept identification in object-oriented domain analysis: Why some students just don’t get it. In Proceedings of the IEEE International Conference on Requirements Engineering RE’05, pages 189–198, 2005. [29] J. Whittle and J. Schumann. Generating statechart designs from scenarios. In ICSE ’00: Proceedings of the 22nd International Conference on Software Engineering, pages 314– 323, New York, NY, USA, 2000. ACM Press. [30] R. Wieringa. A survey of structured and object-oriented software specification methods and techniques. ACM Comput. Surv., 30(4):459–527, 1998. [31] E. Yourdon. Modern Structured Analysis. Prentice Hall, Englewood Cliffs, NJ, 1988. [32] E. Yourdon and L. Constantine. Structured Design: Fundamentals of a Discipline of Computer Program and Systems Design. Prentice Hall, Englewood Cliffs, NJ, 1979.
• an in-depth analysis of the quantitative results to obtain ideas for further improvements of OOA methods.
References [1] CS846 course project. http://se.uwaterloo.ca/ ˜dberry/ATRE/ElevatorSRSs/; accessed January 30, 2008. [2] Definition of “semantic similarity”. http://en. wikipedia.org/wiki/Semantic_similarity; accessed September 15, 2006. [3] G. Booch. Object-oriented design. Ada Lett., I(3):64–76, 1982. [4] G. Booch. Object-Oriented Analysis and Design with Applications. Benjamin/Cummings, Redwood City, CA, USA, second edition, 1994. [5] R. Bræk and O. Haugen. Engineering real time systems: an object-oriented methodology using SDL. Prentice Hall International, 1993. [6] F. Buschmann, R. Meunier, H. Rohnert, P. Sommerlad, and M. Stal. Pattern-Oriented Software Architecture: A System of Patterns. Addison-Wesley, Boston, Massachusetts, first edition, 1995. [7] O.-J. Dahl, B. Myhrhaug, and K. Nygaard. SIMULA 67 Common Base Language. Norwegian Computing Centre, Oslo, Norway, 1968. [8] T. DeMarco. Structured Analysis and System Specification. Yourdon Press, New York, 1978. [9] B. P. Douglass. Doing hard time: developing real-time systems with UML, objects, frameworks, and patterns. Addison-Wesley Longman Publishing Co., Inc., Boston, MA, USA, 1999. [10] E. Gamma, R. Helm, R. Johnson, and J. Vlissides. Design Patterns. John Wiley & Son Ltd, Hoboken, N.J., first edition, 1996. [11] M. Glinz. An integrated formal model of scenarios based on statecharts. In Proceedings of the 5th European Software Engineering Conference, pages 254–271, London, UK, 1995. Springer-Verlag. [12] H. Gomaa. Designing concurrent, distributed, and realtime applications with UML. In ICSE ’01: Proceedings of the 23rd International Conference on Software Engineering, pages 737–738, Washington, DC, USA, 2001. IEEE Computer Society. [13] D. Harel. Statecharts: A visual formalism for complex systems. Sci. Comput. Program., 8(3):231–274, 1987. [14] D. Harel, H. Kugler, and A. Pnueli. Synthesis revisited: Generating statechart models from scenario-based requirements. In Lecture Notes in Computer Science, volume 3393 of LCNS, pages 309–324. Springer-Verlag, January 2005. [15] L. Hatton. Does OO really match the way we think? IEEE Software, 15(3):46–54, 1998.
10