Accepted: 9 March 2018
DOI: 10.1111/conl.12453
VIEWPOINT
Improving the transparency of statistical reporting in Conservation Letters Fiona Fidler1,2
Hannah Fraser1
Michael A McCarthy1
Edward T Game3,4
1 School of BioSciences, University of Melbourne, Australia 2 School of Historical and Philosophical Studies, University of Melbourne, Australia 3 The Nature Conservancy, South Brisbane, Australia 4 University of Queensland, St. Lucia, Australia
Correspondence Edward T Game, The Nature Conservancy, South Brisbane, Australia. Email:
[email protected]
Conservation Letters’ new policy on reporting confidence intervals (CIs) with p values is one among many recent calls for change in statistical reporting practices. It sits in line with the recently developed Tools for Transparency in Ecology and Evolution (TTEE; Parker et al., 2016; TTEE_Working_Group, 2016), which are themselves based on the interdisciplinary Transparency and Openness Promotion Guidelines (Nosek et al., 2018). Complete and transparent statistical reporting is essential to building a reliable evidence base for practice, and for accumulating and synthesizing scientific knowledge. Conversely, undisclosed analysis practices such as cherry picking “significant” results and p-hacking (e.g., making decisions about sampling stopping rules, treatment of outliers, transformations, and/or analysis techniques based on whether results meet or fail to meet a statistical significance threshold) have been directly linked to the inability to replicate many important, published experimental effects (Fidler et al., 2017; Forstmeier, Wagenmakers, & Parker, 2017; Simmons, Nelson, & Simonsohn, 2011). Given Conservation Letters’ focus on publishing science of direct relevance to policy and practice, it is particularly important that the interpretation of statistical analyses and the conclusions supported by this are transparent. From April 2018, Conservation Letters will be requiring: (1) that any article reporting p values must also report 95% CIs in the text and in figures and (2) that all figures that include data used in statistical analyses (whether in the main text or Supporting Information) must show error bars on the figure. Where
possible, these error bars should show 95% CIs, but in all cases authors must be explicit about what the error bars show. The Conservation Letters’ policy encapsulates seven important messages about CIs and p values, which we explicate below.
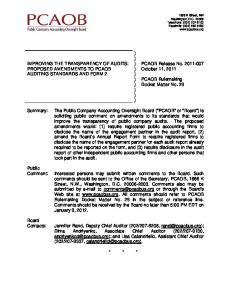
1 MESSAGE NO. 1 : REPORT AND I N T E R P R E T C I s ; I N T E RVA L L E NGT H I S A G U I D E TO PR E C I S I O N While based on the same basic information as p values, CIs make uncertainty in parameter values more explicit than do p values alone. For example, they have been shown experimentally to reduce the misinterpretation of statistical nonsignificance as “no effect” and otherwise improve interpretation (Fidler & Loftus, 2009). A CI indicates a parameter's precision, a concept akin to statistical power. A longer CI indicates less precision; a shorter interval indicates relatively high precision. CIs indicate a set of plausible values for the parameter, with longer intervals encompassing a wider range of plausible values. Figure 1 illustrates possible effect sizes with relevant 95% CIs, relative to levels that are considered important and not important for five hypothetical results. CI-A shows a highly imprecise result that while not statistically significant (interval it includes zero) is wide enough to also include values in the ecologically or theoretically important range.
This is an open access article under the terms of the Creative Commons Attribution License, which permits use, distribution and reproduction in any medium, provided the original work is properly cited. Copyright and Photocopying: © 2018 The Authors. Conservation Letters published by Wiley Periodicals, Inc. Conservation Letters. 2018;11:e12453. https://doi.org/10.1111/conl.12453
wileyonlinelibrary.com/journal/conl
1 of 4
2 of 4
FIDLER ET AL.
that variation (e.g., variation among vs. within sites). When reporting CIs, always ensure that the level of the confidence (e.g., 95%) is noted. If you are also reporting the outcomes of null hypothesis significance tests (i.e., p values), below are some further important messages.
4 M ES SAG E NO. 4 : STATE TH E SAM P LING STO P P ING RULE AS S O CIATED W ITH YOUR H YP OTH ES IS TEST FIGURE 1
Examples of possible effect sizes for five hypothetical results that require different interpretations. The 95% CIs (bars) span the point estimate (dot) and are compared with reference amounts of zero (xaxis) and a level above which effects are ecologically/theoretically important (dashed line)
CI-B shows a statistically significant result (interval excludes zero), but is still not precise enough to distinguish between ecologically or theoretically important and unimportant values (we discuss “importance” further in message No. 6). CI-C shows a more precise nonsignificant result; the interval includes zero and is sufficiently narrow to rule out other important values. CI-D is similarly precise, but at the other en