Journal of Education and Work Vol. 19, No. 4, September 2006, pp. 343–361
Improving work processes by making the invisible visible Arthur Bakker*, Celia Hoyles, Phillip Kent and Richard Noss University of London, UK Journal 10.1080/13639080600867133 CJEW_A_186641.sgm 1363-9080 Original Taylor 402006 19
[email protected] ArthurBakker 00000September and & ofArticle Francis Education (print)/1469-9435 Francis2004 Ltd and Work (online)
Increasingly, companies are taking part in process improvement programmes, which brings about a growing need for employees to interpret and act on data representations. We have carried out case studies in a range of companies to identify the existence and need of what we call ‘technomathematical literacies’ (TmL): functional mathematical knowledge mediated by tools and grounded in the context of specific work situations. Based on data gathered from a large biscuit manufacturing and packaging company, we focus our analysis here on semiotic mediation within activity systems and identify two sets of related TmL: the first concerns rendering some invisible aspects visible through the production of mathematical signs; the second concerns developing meanings for action from an interpretation of these signs. We conclude with some more general observations concerning the role that mathematical signs play in the workplace.
The need for techno-mathematical literacies at work There is a growing movement for industrial companies to modify their production practices according to methodologies collectively known as process improvement. After World War II, Japanese companies such as Toyota developed new manufacturing paradigms (e.g. Lean Manufacturing) under the guidance of American experts, particularly W. E. Deming. Since the 1980s, the Japanese methodologies have been spreading to the West in a major way, in the form of programmes such as Total Quality Management and Total Productive Maintenance (Deming, 1986; Nakajima, 1988). Two American companies, Motorola and General Electric became famous in the 1990s due to their successful development of the Six Sigma process improvement programme (e.g. Pyzdek, 2001). The core of all these programmes is a set of statistical techniques for the collection and interpretation of production data, and the promotion of a workplace culture in which decisions are based on abstractions of work processes in the form of shared, and often computationally represented, data. *Corresponding author. 23–29 Emerald Street, London WC1N 3QS, UK. Email:
[email protected] ISSN 1363-9080 (print)/ISSN 1469-9435 (online)/06/040343–19 © 2006 Taylor & Francis DOI: 10.1080/13639080600867133
344 A. Bakker et al. A key point that emerges in working with process improvement methodologies is that employees at almost all levels are faced with the need to participate in the procedures of data collection and to interpret the charts, tables and graphs that are derived from the data. This faces companies with the question of what knowledge their employees need to participate effectively, and, particularly for our concerns, just how much of the mathematical and technical knowledge which underlies the production of these artefacts it is useful for them to know. In this paper we will look closely at an example of a company attempting to address this issue with its employees.1 Whatever the answer, we take the position that it is considerably more complex than any model based on ‘skills’ or ‘competences’. For example, learning to read graphs is not a straightforward process. Roth and Bowen (2003), for instance, have shown that even professional scientists often misinterpret graphs from their own discipline if they are not sufficiently familiar with the context in which the data were collected. The idea, then, that we might engage employees either in general mathematical education or in, say, graphical interpretation, in the hope that they will somehow ‘apply’ this knowledge at work, is unrealistic. More generally, we take it for granted that knowing cannot be separated from the activity in which it takes place (see, for example, Stevenson, 2002). Thus any simplistic attempt to characterise mathematical knowledge at work as simply a set of mathematical competences or skills runs the risk of ignoring just that element of the situation that provides meaning for employees –– their often intimate familiarity with the work context, the behaviour of machines and materials, the quality of the outputs and the routines of the work process. It has been evident since the 1980s from studies of mathematical practices in workplaces, that most workers use mathematics (in its broad meaning, including statistics) to make sense of situations in ways which differ quite radically from those of the formal mathematics of school and college curricula. Based on earlier work by Hoyles, Noss and colleagues (Hoyles et al., 2002; Noss et al., 2002), we have coined the term ‘techno-mathematical literacies’ (TmL) as a way of conceptualising mathematics as it exists in modern technology-based workplace practices. We have felt the need to adopt a new term to avoid the historical legacy of the term ‘numeracy’, because it is often used to refer to basic mathematical skills, whereas the skills needs identified by Hoyles et al. (2002) clearly go beyond this basic numeracy (for a critique of the notion of numeracy itself, see Noss, 1998). Furthermore, we wanted to avoid the simple use of the term ‘mathematics’ itself, because in the workplace it bears the connotation of school mathematics. In fact, our use of the term ‘literacies’ is broadly convergent with the PISA definition of ‘mathematical literacy’ except for the explicit role of technology and workplace knowledge in TmL. Mathematical literacy is an individual’s capacity to identify and understand the role that mathematics plays in the world, to make well-founded judgements and to use and engage with mathematics in ways that meet the needs of that individual’s life as a constructive, concerned and reflective citizen. (OECD, 2003, p. 24)
What emerges from studies in workplaces is that people tend to develop mathematical techniques to carry out their work, which they generally situate by bringing to
Improving work processes
345
abstractions of the workplace their experiences, the tools they use and the features and local regularities of the context. It is evident from research in workplaces that experienced employees come to use and interpret mathematical concepts as ‘situated abstractions’, which are generalisable within the work context (see, e.g. Noss & Hoyles, 1996). Our previous research focused on a range of work contexts (including nurses, bank employees and airline pilots). The present study forms part of the Technomathematical Literacies in the Workplace project (see acknowledgements) and focuses on three industry sectors: packaging, pharmaceutical manufacturing and the retail finance industry. We have also gathered some useful data from automotive industry and food manufacturing. In each of these sectors, the companies involved were deploying some form of process improvement, at different points along the spectrum from initial steps (as in the food manufacturing case described here) to full deployment of Lean Manufacturing, Six Sigma or a mixture of the two (in the pharmaceutical and automotive sectors). The companies also varied in terms of the embedding of information technology; food production –– the subject of this paper –– rating relatively low in technology use, and, unsurprisingly, pharmaceuticals rating very high. In this paper we will demonstrate how TmL are emerging as a form of knowledge for employees as one company at the low end of both spectra seeks to modernise and improve its production processes by training process improvement teams in certain problem-solving techniques. The purpose of this paper is to illustrate sets of TmL that prove useful in making processes more efficient, and thereby elaborate a small piece of the puzzle of how TmL emerge in companies that are involved in some form of process improvement. Some remarks on the utility of activity theory and a semiotic approach In order to assist in identifying the nature of TmL in workplaces we have employed activity theory as a means to gain a holistic, macro-level view on work processes. We share the standard view of workplaces as complex arrangements of interacting activity systems, each characterised by their own object (i.e. the purpose of work), mediated by artefacts and located in a context characterised by a specific division of labour, sets of rules of discourse and inter-related workplace communities (see, e.g. Engeström, 2001). It is evident that shop-floor workers and managers can inhabit different activity systems with dissimilar goals expressed with diverse tools and following distinct rules. We will exploit the roles of different tools in achieving an object, and particularly the notion of boundary object (Star & Griesemer, 1989) that has recently been explored in the activity theory literature (Tuomi-Gröhn & Engeström, 2003). A useful analytical technique in what follows will be to consider signs, such as numerical data and graphical information, as boundary objects that mediate communication between, and within, different communities. Yet activity theory may not be quite sufficient for our purposes. The problem is that we will need to acknowledge the specificities of TmL, including recognition of what constitutes the mathematical knowledge domain. In terms of its historical
346 A. Bakker et al. development, activity theory has maintained a rather different trajectory, starting with Vygotsky’s distinction between everyday and scientific concepts, mainly focused on vertical development from everyday to scientific concepts, while later developments, due to Leont’ev, introduced the distinction of activity, action and operation, and Engeström (2001) focuses attention on horizontal development between activity systems. One of the merits of this latter approach is that it has drawn attention to such forms of development that previously have not been well described. Yet there is, in some of this work, less of a focus on the discipline-informed knowledge that we seek to characterise or a preference for general descriptions of individuals’ attitudes rather than knowledge per se (see also Beach, 1999). Thus recent developments in socio-cultural and activity-theoretical research have led to a focus on horizontal developments and forms of knowledge that appear to be learnable by participation in communities of practice; and as a backdrop, there is the associated attack from situated cognition on the very notion of disciplinary knowledge itself (Lave, 1988). Guile and Young (2003, p. 79) argue that ‘the role of scientific concepts seems to have got lost in recent developments in activity theory with their stress on activities, context and horizontal development’. Since our interest is in the learning and use of mathematics, which typically involves generalisation and abstraction, we seek to restore some balance on the question of knowledge, while simultaneously taking into account recent insights from socio-cultural and activity-theoretical approaches. A further imbalance in the evolution of activity theory, which has its origin in Soviet thinkers, relates to the question of semiotic mediation. According to Bakhurst (1996), in reflecting on activity theory, the notion of semiotic mediation has been ‘marginalized in the Soviet tradition since the Stalin era’ (p. 215). In much recent workplace research, tools, artefacts or instruments are broadly taken as mediating between subject and object of activity. But because mathematical ‘tools’ are often signs such as tables and graphs, symbolic tools that do more than merely represent or mediate, we also need a specific theory of semiotic mediation, which takes account of how particular mathematical signs are used at work and in the context of employee training. We have found it helpful to consider, therefore, some elements of Peirce’s semiotics, which has its origins in mathematics and philosophy and which can be seen as complementary to Vygotsky’s theory (see, e.g. Seeger, 2005). In Peirce’s terms (Peirce, 1976), a sign is anything that stands for something (an object) for someone. His or her response is called the interpretant –– the ‘meaning’ of the sign. Peirce distinguishes different types of interpretants: logical (‘scientific’ meanings), dynamic (actions) and emotive (emotions) interpretants. What allows people to interpret a sign is collateral knowledge, which sits ‘by the side’ and which consists of a network of knowledge forms including tacit, implicit, meta-cognitive, episodic and codified knowledge forms (Hoffmann & Roth, 2005). Our own research focus has brought us closely into contact with the role of collateral knowledge, and the peculiar mix of mathematical, scientific and work context knowledge needed to use mathematical signs in solving production problems. In particular, we acknowledge Peirce’s distinctions between several types of signs, the most important of which
Improving work processes
347
for our analysis is the diagram: a sign representing relationships. A diagram almost always is a complex sign, consisting of many elements with different functions, and it often functions as a model (for a more detailed account, see Bakker & Hoffmann, 2005). The particular relevance of the semiotic approach for what follows is that 1) signs are visible, whereas the objects they represent are often not (such as the cause of a problem); 2) people’s responses to signs depend on their knowledge of them and their experiences with interpreting such signs in particular situations; and 3) signs mediate between subjects and the purpose of activity. We therefore make distinctions between: ● ●
●
●
Sign: what is visible, whether as a physical or a mathematical sign. Object: what the sign represents in someone’s interpretation or that someone wants to represent or measure. (Note that this Peircean notion of ‘object’ is different from the activity-theoretical one.) Interpretant: the response to the sign. The type of interpretant most relevant to our analysis is the ‘dynamic interpretant’, the action taken in response to a sign, which can be the production of a new sign, such as a table or diagram. The TmL that are required to create and interpret the sign and respond to it appropriately in the workplace.
An additional rationale for our focus on semiotic mediation is methodological: TmL are most likely to become visible to us as researchers when employees use mathematical signs – signs with their origin in mathematical or scientific disciplines. As such, those signs can become boundary objects between activity systems. Methodological remarks The broad research programme of the current study began with a phase of interviews combined with ethnographic observation of ten companies in the different sectors described earlier, in order to identify and categorise different forms of TmL. Here we will focus on just one of the companies we observed, a biscuit manufacturing and packaging company. While we describe our observational methodology as ethnographic, we should be careful to state that we do not attempt the kind of engagement which is typical of ethnography amongst professional anthropologists, such as immersion of the researcher in the community under investigation over periods of months or years. As we noted above, the notion of TmL has developed out of our previous research on mathematics in workplaces, and thus, to a certain extent, our data collection has been driven by the motive of ‘looking for’ TmL, rather than merely ‘looking at’ workplaces in general. There has been, of course, a necessary balance between ‘looking at’ and ‘looking for’, particularly in the early work of the project. One technique that we have found productive is to focus initial workplace observations on situations where routine working practice breaks down: this has brought into view the explicit problem-solving and communication strategies of employees –– thus suggesting to us the TmL which might underlie those strategies,
348 A. Bakker et al. and suggesting issues to be looked for in subsequent observations. As illustrated in the next section, we often used ‘mathematical’ signs such as graphs as boundary objects to coordinate employees’ and our own perspectives as researchers. For each company that we have studied, interviews and observations (including artefacts collected) from workplace visits were written up as detailed reports and transcripts. Starting from these raw data sources, our analysis has proceeded by developing a preliminary categorisation and description of TmL in order to identify significant work episodes that exemplify one or more elements of such knowledge. These work episodes were written up collaboratively by the project team, discussed and revised as appropriate. Similarly the emerging TmL categorisation and descriptions were collectively and iteratively examined and revised. The analytical schemes for the work episodes span various dimensions: routine or non-routine situation, the nature and role of the models, tools and artefacts used or available, and the ways that TmL is mobilised (or not) to communicate between different groups or to make decisions. Note that, in general, we do not code individual ‘chunks’ of data, such as individual interview responses, since the understanding of how TmL is being used in practice requires a synthesis of different viewpoints and data sources. In fact, as we pointed out in the introductory section, we started from the presumption that TmL cannot be separated from the activity systems in which they are observed, a presumption which has been corroborated in each setting we have examined. Triangulation is a key concern for our research (cf. Hammersley & Atkinson, 1995). In collecting data, we continuously seek to triangulate different views of the same workplace activity, seeking the perspectives of employees including shop-floor operators, supervisory managers, process engineers and process improvement specialists, maintenance engineers, and more senior managers. In analysing data, we share and elaborate interpretations of the raw data (audio transcripts, photographs of workplaces, artefacts in the form of paper documentation) amongst the project team. We further triangulate our findings by presenting provisional versions of them to the companies in which the research was carried out (‘feedback meetings’), and by means of consultation with experts in the particular industrial sector involved (‘validation meetings’ in which sector experts are invited to learn about project findings, comment on their validity and generality). The characterisation of TmL presented in the next section was, in fact, one of the major topics addressed during a validation meeting with ten managers and technical consultants from the packaging sector and four researchers (workplace research, mathematics and statistics –– excluding ourselves). Using data to solve problems in food production In this section, we present some empirical findings that suggest what it means in practice to make visible key variables in the production process, to see what is important to be seen and to act accordingly, that is actually solve a problem. After sketching the relevant activity systems as a broader context, we analyse the data on process
Improving work processes
349
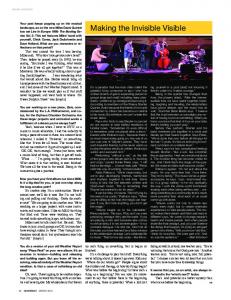
improvement from a semiotic perspective and point out how the analysis suggests the need for a theoretical framework which can address more adequately the role of TmL in activity. The example concerns a programme of process improvement work that is being carried out in a food factory, with the overall goal of improving efficiency (less waste, more production) and hence increasing profitability. Among the aims of the programme are: 1. dealing with obvious process deficiencies; 2. building, in the long-term, a culture among employees of thinking about process improvement, and simultaneously upskilling employees at all levels to support this change. One part of the programme is the formation of ‘process improvement teams’ (PI teams), which spend several weeks working full-time on one particular production line. Each team consists of volunteers who have different roles across the company –– managers, maintenance engineers and shop-floor operators –– with the idea that by interacting in detail with the managers and engineers, the operators will become stakeholders in process improvement. We focus on one PI team as the subjects, trying, as the object of activity, to reduce the waste problem in one production area, using a series of graphs, tables, diagrams and data as mediating signs. From our point of view –– though not necessarily that of the PI team –– the process improvement exercise was an attempt to make visible and explicit the relationships between elements and variables of the process. As such its key component can be seen as a form of modelling –– making relationships visible with signs such as diagrams. This process is often cyclical, as it involves several steps of measuring variables, representing them and deciding what to do next. The analysis presented below is an attempt to clarify one defining characteristic of TmL as rendering the invisible visible through the use of mathematical signs and developing meanings for action from their interpretation. We highlight the interpretants of signs since these appear to be critical in revealing the TmL that the members of the PI team used to solve problems. Capacity profile chart as a boundary object The PI team that we observed began with several days of classroom training. After this, the first problem-solving activity of the team was to collect data about the whole production line and assemble it into a single chart, known as the ‘capacity profile chart’ (Figure 1). The intention of this chart was to reveal any ‘bottlenecks’ in the production process, so that the PI team could prioritise a programme of tasks to remedy the most important sources of inefficiency. However, the meanings drawn from reading this chart are not unproblematic. From the point of view of the PI team, the chart was to serve as a problem-solving tool, but also to get a better overview of the whole process, which many operators needed: They run a packaging machine far faster than the production so that misalignments are very likely –– so the machine will miss cartons and pile-up, and if you say ‘why don’t you
350 A. Bakker et al.
220 200 180 160 140 120 100 80 60 40 20 0
Maximum Actual
M ix in g D e po Ba sit ki ng s t ag Ba e1 ki ng s Co ta ge ol in 2 g sta Co g ol e1 i To ng s ta pp ge in g 2 d To ep pp os in it g 1 de po sit 2 Co lla tio n O ve Ch rw ra ec p k w ei gh e Ca r rto ne r Pa lle tis er
Items per minute
Production Capacity Profile
Figure 1.
Capacity profile chart showing the actual and maximum possible speeds of the different stages in a baking process
turn it down a bit’, they’ve already accumulated stackwork because of the pile-ups, so they say ‘we can’t turn it down we’ve got to deal with this stackwork’. They get into a cycle of running the machine faster than needed, which creates a problem, which creates stackwork to deal with. [Engineer in the PI team]
Also notable about the capacity profile chart is the way that it served as a boundary object between us as researchers trying to understand what we were observing, and the industrial context. As mathematical experts we experienced some confusion as we tried to make sense of the chart: it became clear on trying to understand it that we needed contextual knowledge. Mathematically speaking, Figure 1 looks like a bar chart of the different components in the baking process. Yet implicit in the horizontal axis is a time dimension, which is the sequence of baking and packing stages. Thus the chart should be read from left to right through the baking process (mixing of raw ingredients, baking, cooling, adding toppings, packaging of the finished biscuit). Furthermore, we expected that the heights of all the ‘actual’ bars would be the same through the process (that is, there is one overall production rate). The fact that they are not, as we learnt by talking about this chart to employees, is in part due to the approximate nature of many of the measurements taken, and in part due to the fact that the process is not continuous in practice (there are breaks between stages where biscuits may be removed from the process for temporary storage). During the feedback meeting, employees (including the PI facilitator) were shocked that we did not really understand their graphs; they assumed that their Figure 1. Capacity profile chart showing the actual and maximum possible speeds of the different stages in a baking process
Improving work processes
351
graphs must in some way be faulty as they could not be read by ‘the mathematicians’. Our own experience of reading the capacity profile chart contrasted nicely with the response of an experienced packaging manager (from a different company), when we presented the chart at the validation meeting. To him the process, and the location of the bottleneck, was obvious: It is a very complex science marrying all the equipment in a factory, like a jigsaw puzzle that needs many calculations. The maximum capacity has to be measured by the marriage of all the machines, and whichever one is producing the lowest is the point of action [the ‘Depositor’ bar in Figure 1, second from left]. If the investment is not made at that particular point, then that is the maximum that can be achieved.
Returning to the PI team, the depositor was identified as the major bottleneck, but another variable was brought into play: senior managers noted that the cost of fixing this bottleneck was so high that it would require a high-level decision that could not be made within the time frame of the PI exercise. Consequently, the team decided to shift its attention away from bottlenecks; the PI facilitator with the team judged the waste issue in the production line to be a manageable set of problems within the available time span of a few weeks. From our point of view, as exemplified by the chart example, the process improvement exercise was an attempt to make explicit the relationships between elements and variables of the process, and it is for this reason that it makes sense to regard it as a form of modelling. Though seen scientifically the depositor was the main problem in the work flow, the contextual constraints and collateral knowledge accompanying the graph demanded the PI team to work at a more manageable problem. In this sense, the abstraction of the work process instantiated as the capacity profile chart could only be interpreted within the specificities of the workplace situation: it is a situated abstraction of the work process. We now analyse the solving of the waste problem in three steps, illustrating the cyclical nature of producing and interpreting mathematical signs to make explicit the implicit causes of problems. Step 1: measuring waste (Table 1) Having decided to focus on waste, the PI team wished to obtain a clearer image of the problem, and the areas to prioritise in solving it, by measuring the quantity of wasted biscuits in a more detailed way than hitherto existed. Instead of weighing the waste collected over an entire day and coming from several different areas of the production line (which was the routine practice), they separately measured the waste arising from particular areas and for the particular different types of biscuits being produced during the day. As one manager said: ‘With better collection of information, we should be able to highlight where the problems are’. These measurements were recorded in a table (see Table 1). From this table, it was clear to the team that most waste was generated in Area 3, the topping depositor, where jam and other toppings are deposited onto biscuits from a set of nozzles (see Figure 2). At this point it is worth noting that there is not
352 A. Bakker et al. Table 1.
The waste table produced by the PI team (machine names have been replaced by Area 1, 2, etc.)
Product (type of biscuit) Jam Vanilla Chocolate Total
Area 1 (after baking) (waste Area 2 (waste in kg) in kg) 10 30 – 40
31 87 22 140
Area 3 (topping) Area 4 (waste (waste in kg) in kg) 134 141 131 406
20 59 120 199
Area 5 (packing) 576 packs 2304 packs
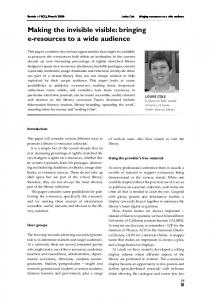
always a need to use the mediation of mathematical signs to see the cause of a problem. As a team member said: ‘sometimes you can see it straight away’ (although, in this case what is obviously ‘visible’ is only visible when one looks for it!). As we have seen in other companies as well, data representations often serve to confirm what people have already seen, but the availability of quantified data can help prioritise the different actions to be taken. In this case, once the topping depositor had been identified as a priority area, it was investigated further to find out the causes of the waste. In short, Table 1 helped the team to know on which area to focus in reducing the waste. The TmL involved in this interpretation and action are identifying and measuring key variables, representing and interpreting data, and thus refining the definition of the problem (i.e. its location in the topping depositor as opposed to general ‘waste’ from the production line). Figure 2. Schematic drawing of the topping depositor area: two nozzles, one for vanilla and one for jam, deposit toppings onto biscuits
Figure 2.
Schematic drawing of the topping depositor area: two nozzles, one for vanilla and one for jam, deposit toppings onto biscuits
Improving work processes
353
TOPPINGS DEPOSIT PROBLEMS
X
DEPOSITOR LEAKS Optimal: no leaks Actual: leaks
FIRST LEVEL PROBLEMS
LEAKS FROM HEAD Optimal: no leaks Actual: leaking
X
* CHECKED AND RESEALED
X
LEAKS FROM MAIN MACHINE Optimal: no leaks Actual: leaking
WEIGHT FROM NOZZLE Optimal: Correct Actual: Incorrect
RISE & FALL UNIT Optimal: no leaks Actual: leaking
X
* NUTS TIGHTENED
X
TOPPING DENSITY Optimal: Actual: 190 - 220
SECOND LEVEL PROBLEMS
SURFACE CONTACT AREA Optimal:Actual: ?
THIRD/FOURTH LEVEL PROBLEMS
Figure 3.
OUT OF LINE BISCUIT Optimal: In line Actual: Out of line not straight
DEPOSIT SUCKED BACK UP Optimal: None Actual: Some
SPEED Optimal: ? Actual: ?
X INGREDIENT SUPPLY Optimal: Constant Actual: Varies
HEIGHT OF HEAD FROM BISCUIT Optimal: ? Actual:?
X
PISTON ADJUSTMENT Optimal:Actual:
X TEXTURE OF TOPPING Optimal: As runny as possibleActual:
X MOVEMENT OF PISTON Optimal: Actual:
HEIGHT OF BISCUIT Optimal: Actual:
TEMPERATURE Optimal: ? Actual: ?
HEIGHT OF NOZZLES Optimal: Fixed Actual: Varies
STANDING TIME IN DEPOSITOR Optimal: as quick as possible Actual: sometimes left overnight
Cause and effect diagram of the topping deposit problems. The bold boxes show the line of investigation we analyse here
Step 2: making a cause-and-effect diagram (Figure 3) Alongside both the numbers in the tables and observations from the topping depositor area, the team discussed how the problem could ‘be broken down into manageable sub-problems’ (as one team member phrased it) and from this produced a cause-and-effect diagram of the part of the process around ‘Topping deposit’ (Figure 3). This diagram was used as a ‘dynamic’ tool by the PI team; it was drawn on a whiteboard and revised daily as the work progressed. Each day, sub-teams of two or three people were assigned to look at different problem areas, with a feedback meeting held at the end of each day. The version of the diagram shown here comes from part way through the work; we have added divisions into ‘first level’, ‘second level’ problems etc. in order to make the diagram more readable. There are three main problem areas (first level), which have been broken down for investigation into sub-problems (second level), and several of these have been further broken down (third/fourth level). For each problem box, the optimum and actual states are indicated (many of these are shown incomplete, since they were as yet not investigated); an X indicates that the problem is still unsolved, and a tick indicates a problem solved (there is only one tick, so much work remains to be done!); problems without X or tick are still to be investigated at this stage of the work. Figure 3. Cause and effect diagram of the topping deposit problems. The bold boxes show the line of investigation we analyse here
354 A. Bakker et al. This diagram helped the team to coordinate their actions of assessing and prioritising sub-problems and of measuring actual values. This involves similar TmL as in the previous step, but also conjecturing on the relationships at issue. Moreover, systematic measurement of key variables is crucial. In the first and second step the mathematical knowledge at stake is mainly measuring and methodically presenting data and relationships. The cause-and-effect diagram can be seen as a model of the problem, representing the key variables and their relationships. Much more important than its representational function, however, is the fact that it is action-oriented. In the experience of the team members, the diagram tells them what to do. This emphasises the highly situated nature of such a model; having the scientific and general analytical skills to make this model and visualise the salient features and relationships of the process is only part of the story, complementary to its mediational function in solving the problem. The next step more explicitly highlights the lack of and need for TmL. Step 3: tackling sub-problems We were able to observe directly the work of the team as it tackled the ‘Deposit sucked back up’ and ‘Topping density’ sub-problems: We are trying to work out why we are getting a lot of waste… [currently] we are looking at one aspect of that, the topping weight… the deposit head, which is trying to stick topping onto the biscuit… it is the surface area of contact between topping and biscuit which determines if the topping stays on the biscuit or gets sucked back up again …so we are trying to increase that surface contact area. … The team are trying to reduce the density of the topping, so that same weight will deposit at a lot higher volume. At the moment they are gradually introducing more air into the topping to see if they improve the surface contact. [Process Improvement facilitator]
As part of this work, several operators had been given the task of trying to work out both an optimum height of the delivery of toppings onto biscuits, and the density of the topping material, controlled by the amount of air injected into it (these were both sub-problems as identified in Figure 3). There was a significant complexity regarding the meaning of optimum in this situation: there were multiple variables to consider – height of delivery nozzles, density of topping ingredients and temperature of the ingredients – and we suspect that even the more expert members of the team did not have a very good understanding of the optimal solution that might be achieved. (Note that ‘optimal’ here implies something rather different than a mathematically optimal construction, since it depends on many factors within the work context, only some of which may be quantifiable.) We were struck by the fact that operators – in seeking some kind of optimal value – did not use a consistent way of measuring the height of the nozzles. For instance, they would measure from the top of the biscuit to the ring of the nozzle in some cases, but from the bottom of the biscuit in other cases. This, of course, made it hard to make reliable judgements on the data. Moreover, they recorded their data using very rough and loosely organised pen-and-paper notes.
Improving work processes
355
This example suggests the role of TmL which are concerned with combining and coordinating different data sources to assess the relative effects of key variables, but it also points to a lack of TmL in systematic measurement and optimisation. Scientific disciplines such as mathematics and statistics provide powerful techniques to assist this optimisation process, ranging from simple graphical displays to sophisticated techniques such as designs of experiments (Montgomery, 1997), although the latter are clearly beyond the scope of operators and even most managers. Nevertheless, it is worth remarking that using such a scientifically sound technique would probably have quickly delivered a reliable optimum, perhaps saving the company a lot of waste. We speculate that the measuring and recording tasks would have been more successful if the operators had had spreadsheet software available to organise their data and look for relationships between variables. This, however, was explicitly ruled out by the Process improvement facilitator: We [the facilitators] do the number crunching part, and use graphs to communicate. … It would be helpful if everyone could design and use their own spreadsheets, but they can’t so we do it – it would save us a lot of time and we could get more done in the time available. We try to keep things simple so everyone can progress at the same speed – it is really bad to have people left behind and lose interest.
Apart from this choice in division of labour, it obviously would not be enough to give spreadsheets to operators: there is a need for them to acquire common TmL, such as systematic measurement, through using the tools and techniques that a spreadsheet provides. Summary In semiotic terms, this sequence of sign production and developing meaning for action can be summarised as in Table 2. Sign refers to any visible issue, whether physical or mathematical. Object refers to the mostly invisible issue that is represented by the sign or, seen from the user perspective, the issue that employees wanted to measure and tackle. Actions are the responses (interpretants) to the sign or a combination of signs. The TmL refer to what is required to interpret the signs and act upon them. Note that the TmL in ‘Coming to a decision and identifying an action’ (Table 3) are required at all stages of the sequence. In brief, the waste table (Table 1) served to make visible the point at which the major waste problem was located. The actions that followed from this interpretation involved looking at the major waste area and analysing how to break down the overall problem into manageable sub-problems, which was supported by a cause-and-effect diagram (Figure 3). Next, systematic measurement had to lead to optimising certain key settings (eg height from nozzle to biscuit). The data we have presented here exemplify TmL, part of a broader set of literacies, which we have observed in process improvement activity in other contexts besides the bakery. Overall, these TmL fall into two categories: making the invisible visible, and coming to an informed action. The TmL commonly required in making the invisible visible are: defining a problem, seeing the need to quantify, identifying and measuring key variables, representing and interpreting data. In our list of common
356 A. Bakker et al. Table 2. Sign
A sequence of sign production and developing meaning for action Object
Actions
1. Waste table (Table 1) Total weight of wasted Focus on highest biscuits in different areas numbers first: at topping depositor. Make a causeand-effect diagram 2. Cause and effect Relationships between Assess and prioritise diagram (Figure 3) causes, and manageable sub-problems; sub-problems measuring actual values 3. Data about subproblems
Relationships within and Cycles of sign between sub-problems production leading to further actions and signs: defining and trying to find optimal values for each subproblem (e.g. height from nozzle to biscuit)
TmL required Identifying and measuring key variables Representing and interpreting data As above, plus: Conjecturing Systematic measurement of key variables As above, plus: Combining and coordinating different data sources; Optimisation
TmL we have left out the optimisation issue mentioned in step 3, because this is more specific to certain situations. The TmL involved in coming to an action are conjecturing about possible causes and communicating about the data to come to a decision (see Table 3). We would like to stress two points: 1. The nature of TmL is that these cannot be seen as generic competences or general problem-solving skills; they require constant recontextualisation as well as ‘webbing’ (Noss & Hoyles, 1996) of contextual and mathematical knowledge. Table 3.
Common TmLs for situated modelling in context
Making the invisible visible Posing a problem Identifying key variables Appreciating the need to quantify Systematic measurement and sampling Representing data Combining and coordinating different data sources to assess relative effects of key variables Coming to a decision and identifying an action Interpreting, conjecturing and communicating with data Making a decision based on information Judging implications of possible decisions and deciding action - mediated by available technology and situated in the work context
Improving work processes
357
2. The TmL listed do not provide exhaustive or exclusive sets of steps that have to be taken in a specific order; for example, the definition of a problem is often refined during other steps. The two sets of TmL can be grouped under one heading of ‘situated modelling’: the problem-solving activity of the PI team exemplifies the development of knowledge about models of processes represented in diagrams (in this case, the processes in a manufacturing production line), in order to identify and understand the problems and the relationships between problems inherent in different processes. We characterise these models as situated because their understanding depends on a combination of contextual and mathematical issues, and because the meanings of signs for the different actors are contingent on work experience as well as expertise with mathematical signs. As such, the modelling described here is rather different from the standard type of mathematical modelling in which a real-world situation is ‘translated’ into a mathematical model so that it can be used to solve a (now) mathematical problem or make a prediction that is translated back to the real world, while neglecting any ‘noise’ from the context. On the contrary, the situated approach takes the ‘noise’ (from a mathematical perspective) as providing much of the meaning to the diagram or model and thus the basis for decision-making. Discussion The episodes reported here illustrate the nature of TmL during process improvement, specifically those needed by employees with relatively little formal education. Compared to other companies we have investigated, the bakery in which we observed this particular waste problem being solved was at an early stage of implementing a process improvement programme and was comparatively ‘low-tech’. In later work, we will be able to contrast more high-technology settings with that of the bakery, and assess the extent to which technology affords different kinds of uses of mathematical signs such as tables, diagrams and graphs to make problems visible and prioritise actions. Based on workplace research literature (e.g. Zuboff, 1988; Reich, 1991; Kim, 2002) and our own observations, we would be surprised if companies at the higher end of the spectrum of deploying process improvement programmes and high-tech tools would not require a much higher level of TmL for many of their employees. As a signal of this trend towards scientifically based business programmes, we cite the general manager from this bakery: ‘We are an engineering business that happens to make biscuits’. Compare this with one of the operators with many years’ experience of one production line who confessed to us that in moving from one biscuit line to another (which to us, looked more or less identical) she felt ‘lost’. She certainly did not think –– or want to think –– of her job as engineering, preferring instead to maintain a craft-based approach to her work. We do not comment on whose perspective –– hers or the general manager’s –– is preferable; only that the manager is pointing to an abstraction of the work process he wants to share, and we remark on the possible role of symbolic boundary objects in achieving this outcome.
358 A. Bakker et al. As the bakery example points out, it is not just mathematical or statistical knowledge and computer skills that are needed. One manager said to us: ‘people will be able to make more decisions from the data at their fingertips and they will need more skills to do that – not really computer skills, more decision-making skills’. When we have asked managers how they recruit and develop new employees, they often speak of looking at processes and making decisions. What is needed, said one manager, is ‘the ability for people to look at things and react’. From a semiotic perspective this implies that people need to interpret signs and know what to do in response. To interpret information and make data-informed decision requires a mixture of collateral knowledge forms including mathematical knowledge, while crucially webbing this knowledge with invaluable familiarity of the work system. A word more about webbing and collateral knowledge. We have emphasised that TmLs cannot be seen as generic competences, and have illustrated how there is an organic link between context and the signs used to represent the workplace. Elsewhere we have commented on this linkage as a fundamental characteristic for developing mathematical meaning, and referred to it as webbing. The idea of webbing evokes the ways that people can come to construct mathematically based knowledge by forging internal connections in interaction of internal and external resources (cognitive and artefactual tools) during activity and in reflection upon it. The notion of webbing aims, therefore, to recognize the central significance of signs and tools as external resources that shape the nature of the mathematical resources constructed. The notion of webbing also resonates with Peirce’s idea of collateral knowledge as the many different knowledge forms that allow people to interpret and use signs (cf. Hoffmann & Roth, 2005). We have taken activity theory as a theoretical background framework, and attempted to complement it with elements of a semiotic perspective to analyse how mathematical signs mediate within those systems. The fundamental idea is that signs do more than merely represent and mediate – they create for themselves a voice in the system, a voice which can only be heard, or at least understood, as part of a broad set of TmLs whose existence cannot be taken for granted. In the examples we have ‘zoomed in’ on semiotic mediation to identify the nature of TmLs, but we would like to remark that ‘zooming out’ to activity systems is equally important, particularly if we are interested in engendering change in the workplace. For example, it was apparent from our observations that it is not enough to educate other operators on the production line by simply presenting to them the results of the PI team. One of the operators from the PI team reported that: ‘we changed things while we were working on the plant, and people have gone back to doing things as before’. He gave an example of how they had found an optimal speed for a conveyor belt, but operators (who had not been in the PI team) changed it back to what they were used to: ‘we slowed down the conveyor belts so people could be more productive putting biscuits on, and now they have speeded it back up. They think about getting more biscuits out, but they sometimes struggle getting the biscuits on’. This is not surprising if we realise that only a subset of the operators have undergone the same process of sign production and developing meanings or taken part in the activity
Improving work processes
359
system of the PI team. As an extreme example of the struggle between craft and scientific approaches, we heard of another company in which operators use fake control panels. They think they have the freedom to manipulate certain variables but in fact the settings are fixed by the engineers! An extreme example, perhaps, but it highlights a crucial specificity in the role of mathematically derived symbols. The special property of mathematical symbols is that in order to deal with them, to infuse them with meaning, it is necessary to situate them internally as part of a system of relationships between signs as well as externally, as part of a system of more or less familiar relationships between things (some of which might, of course, be symbolic). The balance between this internal and external system of relationships is one of the ways to recognize ‘mathematical’ activity of a professional kind. The symbols seem to have a life of their own, they are constitutive of meaning, but only when an appropriate balance is achieved (appropriate, that is, for the object of activity). When this integration fails (as in the case of the operators who did not participate in the PI team) or is deliberately fractured (in the case of the operators ‘duped’ into using fake control panels) the abstractions of the work process they represent remain just that –– unsituated and non-constitutive of meaning. Our current focus of research has shifted to intervention –– via the development and evaluation of learning opportunities –– and while this lies outside the scope of the current paper, it is worth enquiring why the PI team trainers were so reticent to introduce a tool such as a spreadsheet into their work. In part, we conjecture that this is part of a cultural assumption that spreadsheets are just ‘too much maths’ –– and they may be right. But our experience so far, in other contexts, suggests that this is a short-sighted view, and one that excludes some important –– and, it seems so far, approachable –– ways to link collateral knowledge with mathematical and technical knowledge. In this short-sighted view, technology is something which automates the workplace, and ‘de-skills’ the production employees rather than ‘informates’ the workplace (Zuboff, 1988), that is, provides information to employees such that they develop a greater knowledge of the production process and become more effective controllers of it. We recognize that theoretical work remains to be done to articulate the ‘micro-level’ understanding of the TmL which individuals deploy as they work within activity systems with a ‘macro-level’ (activity-theoretical) understanding of how individuals operate collectively as communities. We expect that the second phase of our research, when we design learning opportunities for TmL, will help us develop such a framework. Acknowledgements We gratefully acknowledge funding by the United Kingdom Economic and Social Research Council’s Teaching and Learning Research Programme (www.tlrp.org), Award Number L139-25-0119. See also www.ioe.ac.uk/trlp/technomaths. We are grateful to our colleague Dr David Guile for his contributions to our research and for discussions of an earlier version of this paper.
360 A. Bakker et al. Note 1.
We do not naïvely believe that the interests and — by implication — the ‘needs’ of employees and employers are coincident, or even convergent, but consideration of this and similar sociological issues lie outside both our professional competence and the scope of this paper.
References Bakhurst, D. (1996) Social memory in Soviet thought, in: H. Daniels (Ed.) An introduction to Vygotsky (London, Routledge), 196–218. Bakker, A. & Hoffmann, M. (2005) Diagrammatic reasoning as the basis for developing concepts: A semiotic analysis of students’ learning about statistical distribution, Educational Studies in Mathematics, 60, 333–358. Beach, K. D. (1999) Consequential transitions: A sociocultural expedition beyond transfer in education, Review of Research in Education, 24, 101–139. Deming, W. E. (1986). Out of the crisis (Cambridge, MA, MIT Press). Engeström, Y. (2001) Expansive learning at work: Toward an activity theoretical reconceptualization, Journal of Education and Work, 14(1), 133–156. Guile, D. & Young, M. (2003) Transfer and transition in vocational education: Some theoretical considerations, in: T. Tuomi-Gröhn & Y. Engeström (Eds) Between school and work: New perspectives on transfer and boundary-crossing (Amsterdam, Pergamon), 63–81. Hammersley, M. & Atkinson, P. (1994) Ethnography: principles and practice (Routledge-Falmer). Hoffmann, M. H. G. & Roth, W.-M. (2005) What should you know to survive in knowledge societies: On a semiotic understanding of ‘knowledge’, Semiotica, 156, 101–138. Hoyles, C., Wolf, A., Molyneux-Hodgson, S. & Kent, P. (2002) Mathematical skills in the workplace (London, Science, Technology and Mathematics Council). Lave, J. (1988) Cognition in practice: mind, mathematics and culture in everyday life (Cambridge, Cambridge University Press). Kim, Y.-H. (2002) A state of the art review on the impact of technology on skill demand in OECD countries, Journal of Education and Work, 15(1), 89–109. Montgomery, D. C. (1997) Design and analysis of experiments (4th edn) (New York, John Wiley & Sons). Nakajima, S. (1988) TPM: introduction to total productive maintenance (Portland, Oregon, Productivity Press). Noss, R. (1998) New numeracies for a technological culture, For the Learning of Mathematics, 18(2), 2–12. Noss, R. & Hoyles, C. (1996) Windows on mathematical meanings (Dordrecht, the Netherlands, Kluwer Academic Publishers). Noss, R., Hoyles, C. & Pozzi, S. (2002) Abstraction in expertise: A study of nurses’ conceptions of concentration, Journal for Research in Mathematics Education, 33, 204–229. OECD (2003) PISA 2003 assessment framework (Paris, Organization for Economic Cooperation and Development). Peirce, C. S. (1976) The new elements of mathematics, in: C. Eisele (Ed.) The new elements of mathematics (vol. I-IV). (The Hague-Paris/Atlantic Highlands, N.J., Mouton/Humanities Press). Pyzdek, T. (2001) The six sigma handbook (New York, McGraw-Hill). Reich, R. B. (1991) The work of nations: Preparing ourselves for 21st century capitalism (London, Simon & Schuster). Roth, W.-M. & Bowen, G. M. (2003) When are graphs worth ten thousand words? An expertexpert study, Cognition and Instruction, 21(4), 429–473. Seeger, F. (2005) Notes on a semiotically inspired theory of teaching and learning, in: M. Hoffmann, J. Lenhard & F. Seeger (Eds) Activity and sign – grounding mathematics education (New York, Springer), 67–76.
Improving work processes
361
Star, S. L. & Griesemer, J. (1989) Institutional ecology, ‘translations,’ and boundary objects: amateurs and professionals in Berkeley’s Museum of Vertebrate Zoology, 1907–1939, Social Studies of Science, 19, 387–420. Stevenson, J. (2002) Concepts of workplace knowledge [Special Issue], International Journal of Educational Research, 37, 1–15. Tuomi-Gröhn, T. & Engeström, Y. (Eds) (2003) Between school and work: new perspectives on transfer and boundary-crossing (Amsterdam, Pergamon). Zuboff, S. (1988) In the age of the smart machine: The future of work and power (New York, Basic Books).